Article Text

Abstract
Objectives To determine whether patterns of high internal tissue stress during gait are associated with patterns of monosodium urate crystal deposition and bone erosion in gout.
Methods We compared patterns of foot von Mises stress predicted computationally during gait in volunteers of normal and high body mass index (BMI) with patterns of urate deposition in gout and asymptomatic hyperuricaemia, and bone erosion in gout using dual-energy and conventional CT data.
Results The highest average and peak von Mises stress during gait was observed at the third metatarsal (MT) head. Similar stress patterns were observed for high and low BMI groups. In contrast, for both urate deposition and bone erosion, the first MT head was most frequently affected, with very infrequent involvement of the third MT head. There was no clear relationship between average or peak von Mises stress patterns with patterns of urate deposition or bone erosion (−0.29>r<0.16). Addition of BMI into linear regression models did not alter the findings.
Conclusions These data do not support the concept that elevated internal tissue stress during biomechanical loading plays an important role in patterns of monosodium urate crystal deposition or structural damage in gout.
- Gout
- Rehabilitation
- Physcial therapy
This is an Open Access article distributed in accordance with the Creative Commons Attribution Non Commercial (CC BY-NC 4.0) license, which permits others to distribute, remix, adapt, build upon this work non-commercially, and license their derivative works on different terms, provided the original work is properly cited and the use is non-commercial. See: http://creativecommons.org/licenses/by-nc/4.0/
Statistics from Altmetric.com
Key messages
What is already known about this subject?
In gout, there is preferential involvement of certain joints. Gout is also associated with obesity and osteoarthritis. These observations suggest that biomechanical load or tissue stress contribute to deposition of monosodium urate crystals.
What does this study add?
This study did not demonstrate a relationship between average or peak internal stress patterns during normal gait with patterns of urate deposition in hyperuricaemia and gout.
Introduction
Gout typically presents as a severe inflammatory arthritis at characteristic sites; the first metatarsophalangeal joint, midfoot or ankle.1 ,2 Advanced imaging techniques have also demonstrated that these sites are preferentially affected by urate deposition and bone erosion in patients with gout.3–5 Obesity is an important risk factor for development of gout.6 Although this relationship may be partly mediated through hyperuricaemia,7 it is also possible that altered biomechanical loading or tissue stress in weight-bearing joints contributes to monosodium urate (MSU) crystal deposition in overweight/obese individuals. Furthermore, it is well-recognised that gout frequently coexists with osteoarthritis,8 a disease that is strongly mediated by abnormal biomechanics.9 Collectively, these observations suggest that biomechanical load or tissue stress contribute to deposition of MSU crystals.10 We hypothesised that patterns of high internal tissue stress during gait are associated with patterns of urate deposition and bone erosion in gout.
A key challenge to examining the relationship between biomechanical stress and MSU crystal deposition or joint damage in gout is that people with established gout have major alterations in their gait pattern even in the absence of acute attacks or clinically apparent tophi.11 These changes may occur due to off-loading of painful joints or altered loading due to joint deformity. Therefore, examining biomechanical load during gait in people with established gout may not accurately reflect tissue stress that occurs at the time of MSU crystal deposition. For this reason, we designed a study comparing patterns of foot tissue stress measured computationally during gait in healthy volunteers without gout with patterns of MSU crystal deposition and bone erosion in people with gout. A further aim of this study was to examine whether tissue stress patterns in overweight/obese individuals were associated with patterns of urate deposition and bone erosion in gout.
Methods
This study was designed to compare patterns of bone stress predicted computationally during gait in volunteers of normal and high body mass index (BMI), with patterns of urate deposition in hyperuricaemia and gout, and patterns of bone erosion in gout using published data from dual-energy CT (DECT) and conventional CT studies.3 ,4
Foot tissue stress data
We recruited 50 healthy participants by public advertising; 25 with normal BMI (18–25 kg/m2) and 25 with high BMI (>25 kg/m2). Inclusion criteria were: male sex; age 18–60 years; and no history of diabetes, arthritis, foot surgery or other foot problems. The University of Auckland Human Participants Ethics Committee approved the study and participants provided written informed consent.
Each participant had their right foot scanned while standing barefoot and in an undeformed configuration using a structured light scanner (Mephisto, EX-PRO scanner, 4DDynamics, Antwerp, Belgium). All scanned data were registered and combined using the open source software CloudCompare (http://www.danielgm.net/cc) to make a full three-dimensional scanned rendering of the foot. Each participant then performed three walking trials, at 1.2 m/s (the self-selected speed of most people). Participants walked over an Emed pressure platform (Novel, Munich, Germany), a system that contains 6080 individually calibrated capacitive sensors with a resolution of four sensors per cm2 (pressure range 10–1270 kPa). For each participant, an average foot pressure map, a centre of pressure map and ground reaction force plot was generated for the entire gait cycle using the data from the Emed platform.
These data were then applied to a previously developed generic anatomically based finite element computational musculoskeletal model of the foot,12 ,13 which was based on a healthy middle-aged male with no foot pathology (and no history of gout or diabetes). The geometric data from each participant was used to morph the generic foot into the participant's shape and incorporate their measured foot pressure (biomechanical data) on the sole of the foot. The computational model was then solved in the finite element software Abaqus (3DS, Tokyo, Japan) to obtain the tissue von Mises stresses within the various foot regions (bones, muscles and fatty tissues). Von Mises stress is a single value that accounts for stresses in all directions and describes the yield stress of a material.14 Bone stress values at the following sites were analysed using this model: distal and proximal portions of the first proximal phalanx, first to fifth metatarsal (MT) heads, first to fifth MT bases, lateral, middle and medial cuneiforms, navicular, cuboid, anterior process of calcaneus, proximal calcaneus, and distal talus.3 ,4
Gout urate deposition and bone erosion data
For the urate deposition analysis, we used published data from DECT scans of both feet from 92 patients with tophaceous gout (mean age 58, BMI 33 kg/m2) and 25 patient with asymptomatic hyperuricaemia (mean age 64, BMI 32 kg/m2).4 ,15 The percentage (95% CI) of patients with DECT urate deposition at each bone site described above was used in the analysis.
For the bone erosion analysis, we used published data from conventional CT scans of both feet from 25 patients with gout.3 This data set included erosion size scored semiquantitatively at bone sites described above, scored separately from 0 to 10.16 The mean (95% CI) bone erosion score at each site was used in the analysis.
Statistical analysis
Data were analysed using Prism (V.6, GraphPad, San Diego, California, USA) and SPPS (V.22, SPSS Inc, Chicago, Illinois, USA). Means with SDs and percentages were used to describe the characteristics of participants. Wilson score CIs for proportions were calculated using http://www.OpenEpi.com.17 Pearson's correlation tests were used to examine the relationship between CT and tissue stress variables. Analysis of 20 bone sites allowed 80% power (α 0.05) to detect a correlation coefficient ρ of at least 0.53. Linear regression models were used to examine the relationship between CT values with tissue stress and BMI. All tests were two tailed and p<0.05 was considered statistically significant.
Results
Gait study participants
The 50 healthy male participants had mean (SD) age 28 (8) years, weight 81.9 (18.1) kg, and BMI 26.2 (5.1) kg/m2. Ethnicities were Caucasian (60%), Asian (36%) and Polynesian (4%). The mean (SD) BMI was 30.9 (2.5) kg/m2 in the high BMI group and 21.5 (1.3) kg/m2 in the low BMI group. The average and peak von Mises stress values of the tissue at each site for the entire group are represented in figure 1 and for each BMI group in table 1. The highest average and peak stress was observed at the third MT head with lower tissue stress values at all other MT heads. Although ground reaction forces were higher in those with high BMI (p<0.0001), foot contact area was also higher (p<0.0001), with similar von Mises stress patterns observed in the high and low BMI groups (p>0.29).
Average and peak von Mises stress values for all participants and the high and low BMI groups
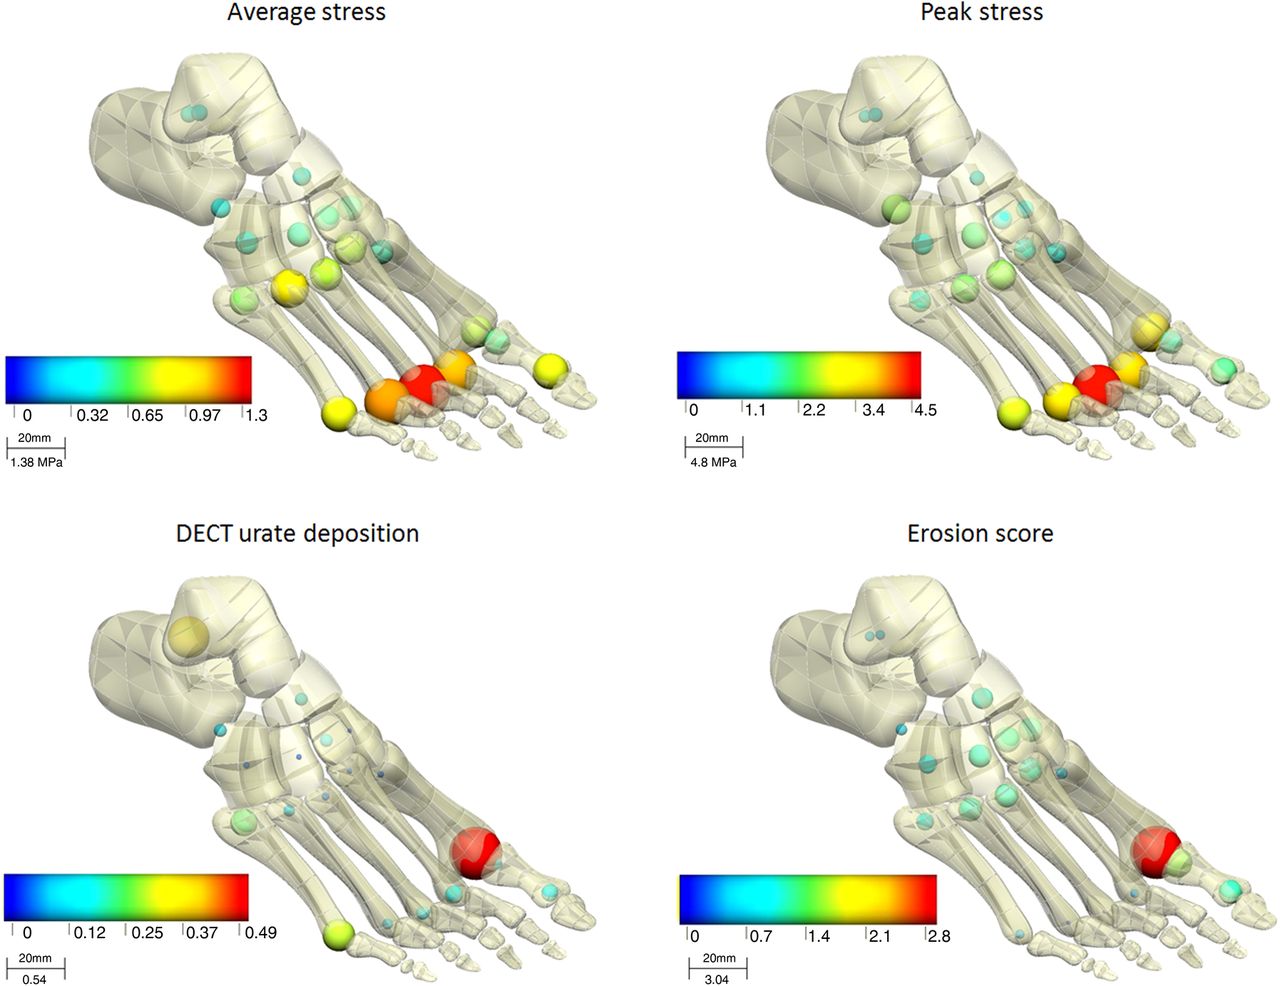
Foot maps showing the patterns of average tissue stress, peak tissue stress, urate deposition in gout and bone erosion in gout. For each map, both the sphere diameter and colour represents the linear range from 0 to the maximum value, as shown in the figure keys (DECT, dual-energy CT).

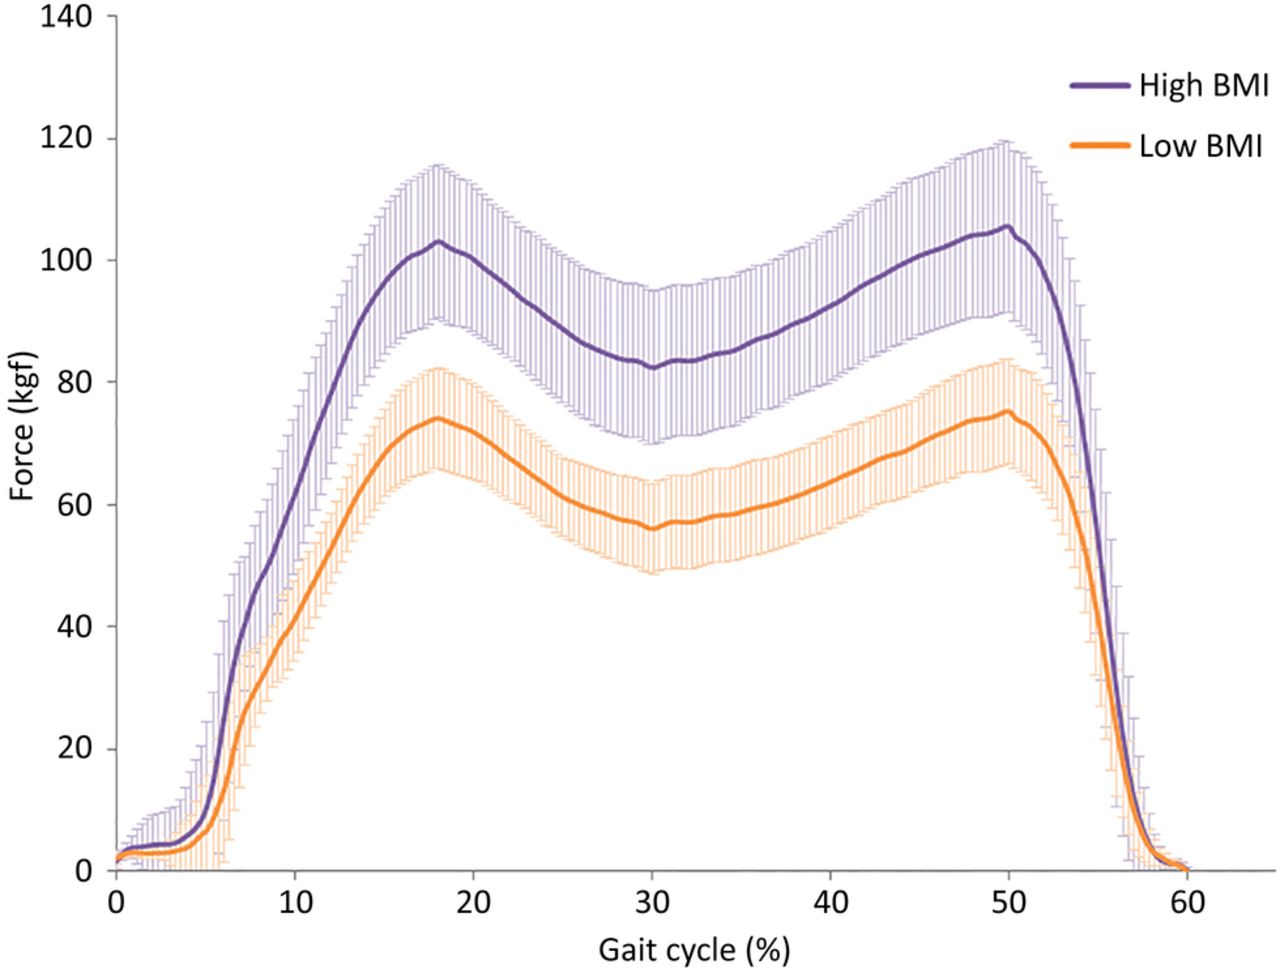
Foot ground reaction force during stance phase of gait (average gait cycle at 1.2 m/s) showing difference between high and low body mass index (BMI) cohorts. Data are presented as mean (SD).
Relationship between tissue stress and patterns of urate deposition and bone erosion
The patterns of urate deposition and bone erosion in gout are shown in figure 1. The first MT head was most affected, with infrequent involvement of the third MT head. There was no clear relationship between average or peak von Mises stress with patterns of either urate deposition or bone erosion in gout (figure 3, −0.20>r<0.16 for all comparisons). Similar results were observed for high and low BMI groups, and addition of BMI into linear regression models did not alter the findings (data not shown).

XY plots with regression lines (red) showing the relationship between average (left panel) and peak (right panel) tissue stress at all bone sites for (A) dual-energy CT (DECT) urate deposition in gout, and (B) conventional CT bone erosion score in gout. Error bars represent 95% CIs.
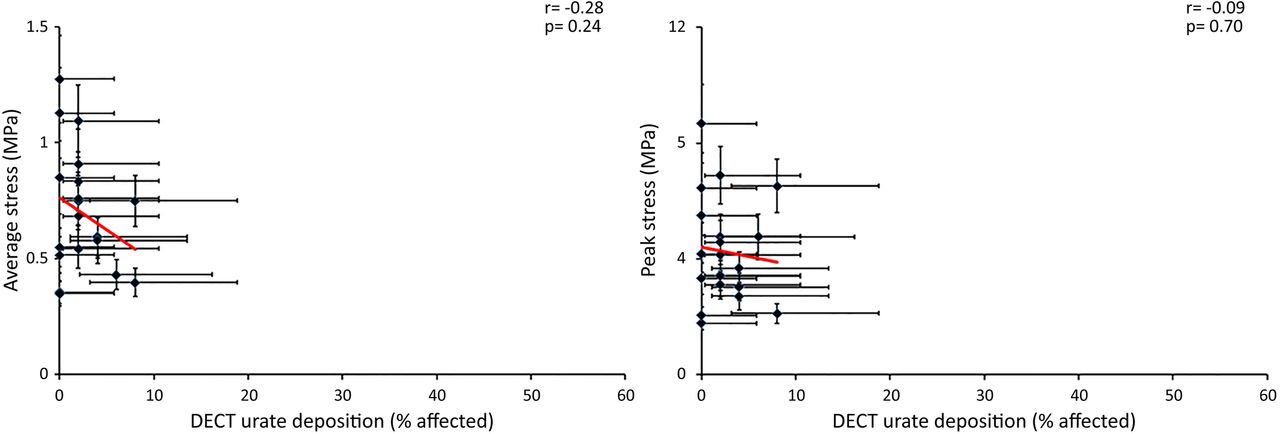
The frequency of urate deposition was <10% in all bone areas in asymptomatic hyperuricaemia. There was no positive relationship between patterns of urate deposition in asymptomatic hyperuricaemia with either average or peak von Mises stress (figure 4, r=−0.28 and r=−0.09 respectively).
XY plots with regression lines (red) showing the relationship between average (left panel) and peak (right panel) tissue stress at all bone sites for dual-energy CT (DECT) urate deposition in asymptomatic hyperuricaemia. Error bars represent 95% CIs.
Discussion
This study has not demonstrated a relationship between patterns of urate deposition and bone erosion in gout and patterns of tissue stress during gait in volunteers of normal and high BMI. Although ground reaction forces were higher in those with high BMI, von Mises stress during gait did not differ between BMI groups, suggesting that alterations in internal tissue stress due to overweight/obesity do not explain the preferential involvement of certain sites in gout.
The lack of relationship between tissue stress and patterns of MSU crystal deposition and erosion in gout raises further questions about what factors do contribute to the preferential sites of involvement in gout. Factors known to promote MSU crystal formation in vitro have been postulated, including physical shock, decreased temperature and lower pH.18 ,19 Our analysis did not include other dynamic tasks such as stair climbing or running. It is conceivable that pathological changes that occur due to intensive joint loading or joint injury may promote both osteoarthritis and also MSU crystal formation in the presence of urate supersaturation.20
This study, examining tissue stress in normal and high BMI volunteers without gout, was carefully designed to avoid the potential confounding effect of pathological changes in biomechanical loading that occur in established urate deposition.11 Importantly, the majority of participants in our study will not develop gout, and the tissue stress patterns in people with hyperuricaemia who develop gout may differ from those who do not. Further exploration of factors, including local bone and joint factors, contributing to development of both asymptomatic and symptomatic MSU crystal deposition will require large prospective studies of people with hyperuricaemia.
APPENDIX
SUPPLEMENTARY METHODS
Calculation of von Mises stress
The von Mises stress yield criteria (σv) is typically used to evaluate the failure of tissues in bioengineering. In musculoskeletal applications it is used to establish when bone is likely to be damaged initiating a process of repair and remodelling. It has been previously used to determine when damage and remodelling occurs in bone.[14] It represents a combination of three principal stresses σ1, σ2, σ3 combined into an equivalent stress which is then compared to the yield stress of the material. If the von Mises stress of the material exceeds the yield value then the material will undergo failure, damage and remodelling. The von Mises stress in 3D is shown in equation 1: where, σʋ is the von Mises stress, σ1 is the principal stress in the x-direction, σ2 is the principal stress in the y-direction and σ3 is the principal stress in the z-direction. This stress is an internal tissue stress, which is different to the surface plantar pressure typically reported in foot biomechanics studies. Von Mises stress can only be computed using computer modelling.
SUPPLEMENTARY RESULTS
Data collected from the Emed® pressure platform (Novel, Munich, Germany) included foot ground reaction force, foot contact area and peak plantar pressure for both low and high BMI cohorts. These raw data were entered into the computer model to predict the bone von Mises stress.
The high BMI group showed a higher ground reaction force than the low BMI group (two way ANOVA p<0.0001, Figure 2). However, the high BMI group also exhibited higher foot contact area (for high BMI group average (SD) area 154 (20) cm2 and for low BMI group 125 (13) cm2, p<0.0001). Consequently, there was no difference in peak plantar pressures between the low and high BMI groups (p>0.37).
References
Footnotes
Contributors ND is the guarantor, and had control over the decision to publish. ND, KM and JF designed the study. MD collected the data. All authors analysed and interpreted the data. ND, MD and JF prepared and revised the manuscript. All authors read and approved the final manuscript.
Funding This study was funded by the Auckland Medical Research Foundation (Grant number 1/1/12/008).
Competing interests ND has received consulting fees, speaker fees or grants from the following companies: Takeda, Teijin, Menarini, Pfizer, Ardea, AstraZeneca, Savient, Fonterra, Metabolex.
Patient consent Obtained.
Ethics approval The University of Auckland Human Participants Ethics Committee approved the study (2012/8685).
Provenance and peer review Not commissioned; externally peer reviewed.
Data sharing statement No additional data are available.