Article Text

Abstract
Objective To determine whether characterisation of patients' metabolic profiles, utilising nuclear magnetic resonance (NMR) and mass spectrometry (MS), could predict response to rituximab therapy. 23 patients with active, seropositive rheumatoid arthritis (RA) on concomitant methotrexate were treated with rituximab. Patients were grouped into responders and non-responders according to the American College of Rheumatology improvement criteria, at a 20% level at 6 months. A Bruker Avance 700 MHz spectrometer and a Thermo Scientific Q Exactive Hybrid Quadrupole-Orbitrap mass spectrometer were used to acquire 1H-NMR and ultra high pressure liquid chromatography (UPLC)–MS/MS spectra, respectively, of serum samples before and after rituximab therapy. Data processing and statistical analysis were performed in MATLAB. 14 patients were characterised as responders, and 9 patients were considered non-responders. 7 polar metabolites (phenylalanine, 2-hydroxyvalerate, succinate, choline, glycine, acetoacetate and tyrosine) and 15 lipid species were different between responders and non-responders at baseline. Phosphatidylethanolamines, phosphatidyserines and phosphatidylglycerols were downregulated in responders. An opposite trend was observed in phosphatidylinositols. At 6 months, 5 polar metabolites (succinate, taurine, lactate, pyruvate and aspartate) and 37 lipids were different between groups. The relationship between serum metabolic profiles and clinical response to rituximab suggests that 1H-NMR and UPLC–MS/MS may be promising tools for predicting response to rituximab.
- Rheumatoid Arthritis
- Inflammation
- Lipids
- Treatment
This is an Open Access article distributed in accordance with the Creative Commons Attribution Non Commercial (CC BY-NC 4.0) license, which permits others to distribute, remix, adapt, build upon this work non-commercially, and license their derivative works on different terms, provided the original work is properly cited and the use is non-commercial. See: http://creativecommons.org/licenses/by-nc/4.0/
Statistics from Altmetric.com
Key messages
What is already known about this subject?
Current methods make it challenging to accurately predict rituximab response in patients with rheumatoid arthritis.
What does this study add?
This study demonstrates differential metabolism between patients who respond to rituximab and those who do not and identifies several metabolites and pathways as potential biomarkers.
How might this impact on clinical practice?
Metabolite profiles can differentiate rituximab responders and non-responders when other clinical measures fail to do so, thus streamlining treatment protocols.
Introduction
Early detection and initiation of an effective treatment in rheumatoid arthritis (RA) is critical for minimising damage caused by the disease and improving immediate and long-term patient outcomes and quality of life.1 Aggressive treatment is key if the damage caused by RA is to be controlled. In particular, successful disease management requires better tools for diagnosis and streamlining of treatment protocols.1 ,2 Thus, if choosing and initiating the right biological treatment earlier in the course of disease could help to reach the goal of remission, a greater effort should be made to develop the tools necessary to employ a ‘personalised’ medicine approach, in an attempt to match patients with the most appropriate therapy option for their disease subtype.
Once genetic and epigenetic risk factors and environmental triggers have led from preclinical to clinical disease, RA may be driven by several different factors, including cytokines, such as tumour necrosis factor (TNF) or interleukin 6 (IL-6), or different cell subset, such as B cell, T cell or macrophages, which ultimately lead the perpetuating cycle of chronic synovitis.3 ,4 Given the complexity and heterogeneity of RA, it seems doubtful that a single cytokine or biomarker will be sufficient for therapy discrimination. Instead, biomarker signatures may represent more realistic approach for the future of personalised therapeutic protocols for those suffering from the disease.5 Identifying these unique signatures could make a significant difference in RA management and attainment of disease remission. Metabolomics is the science of identifying and quantifying the biochemical by-products of metabolism, frequently referred to as metabolites.6 ,7 The goal of metabolomics is to comprehensively measure the small molecules present in a specific cell, tissue, organ, organism or biofluids.6–8 Variations in metabolite concentrations can serve as diagnostic or prognostic biomarkers. We propose that the study of metabolomics in RA can be useful to identify biomarker signatures.9–11 Metabolomics has many applications and is frequently used to identify single biomarkers, classify metabolite patterns of health or disease, elucidate pathways involved in pathogenesis, uncover novel targets for modulation of dysregulated pathways and to monitor treatment and/or disease status.12–14 Recent studies in other fields, such as oncology, demonstrate the applicability of metabolomics using serum and urine samples for diagnosis and prognosis.15–21 The application of metabolomics to RA is still in its infancy, but early studies have yielded promising results.2 ,22–27 These studies suggest that metabolomics analyses of several different biological fluids may be useful diagnostic tools prior to initiation of treatment and may also prove effective for earlier detection of RA. They also suggest that metabolic profiling has the potential to effectively predict patient response to therapy prior to administration. Here, we show that an untargeted analysis of polar and lipid metabolites from serum samples is a promising clinical tool for predicting response to rituximab therapy and ultimately improving patient outcomes.
Methods
Patients and clinical outcomes
The ARISE (Assessment of Rituximab's Immunomodulatory Synovial Effects registered at ClinicalTrials.Gov NCT00147966) clinical trial was recently described in detail28 and is briefly described in online supplementary material. The primary clinical outcome was response according to the ACR improvement criteria, at a 20% level (ACR20), at 6 months. Patients who left the study before 6 months were considered non-responders. Secondary clinical outcomes included ACR20 as well as ACR50 and ACR70 responses at monthly time points, Disease Activity Score using a 28-joint count (DAS28)29 and changes in individual disease activity parameters: tender joint count, swollen joint count, physician global assessment of disease, patient global assessment of disease, patient assessment of pain, measure of functional status using the Health Assessment Questionnaire (HAQ) and C-reactive protein (CRP) and erythrocyte sedimentation rate (ESR) at monthly time points.
supplementary data
Metabolomics analysis
A total of 43 samples were prepared and analysed using nuclear magnetic resonance (NMR) and ultra high pressure liquid chromatography (UPLC)–mass spectrometry (MS)/MS analytical platforms10 ,15 ,30–33 as described in online supplementary material. Frozen sera were obtained from the Division of Rheumatology, Allergy and Immunology at UC San Diego School of Medicine (San Diego, California, USA) for polar and lipid analyses. NMR spectra were acquired with a 16.4 T (700 MHz) Bruker Avance spectrometer (Bruker BioSpin, Billerica, Massachusetts, USA) equipped with a 5 mm TCI cryogenically cooled probe and an autosampler at 30°C. Following acquisition, spectra were processed using NMRlab and MetaboLab.34 Metabolite assignment and quantification were performed using several database.31 ,35
UPLC–MS analysis on lipid fraction was performed on a Q Exactive Hybrid Quadrupole-Orbitrap Mass Spectrometer equipped with an Accela 1250 pump and an autosampler as described in online supplementary material (Thermo Scientific, Waltham, Massachusetts, USA). Metabolite assignment was performed at a 5 ppm mass accuracy range by interrogation of several databases.35–40 MetaboAnalyst V.3.041 and VANTED42 software were used for metabolic pathway analysis (see online supplementary material).
Statistical analysis
Partial least squares discriminant analysis (PLSDA) with venetian blinds cross-validation was performed using PLS-Toolbox (Eigenvector Research, Manson, Washington, USA). Polar metabolite correlation relationships were reported in Pearson's correlation coefficients and visualised as a heat map with hierarchical clustering analysis with Euclidean distance metric by MATLAB. Statistical significance analysis between responders and non-responders was performed using an unpaired Student's t-test (statistical significance: *p<0.1, **p<0.05 and ***p<0.01).
Results
Patient characteristics
After 6 months of rituximab therapy, patients were divided into two groups according to their response, as determined by the 1987 ACR classification criteria. At baseline, 14 patients were classified as responders and 9 as non-responders.28 Similarly, of the 20 patients who followed up at 6 months, 13 were responders and the remaining 7 were non-responders. With the exception of ACR response, no significant differences were observed between rituximab responders and non-responders at baseline. Age, gender, baseline methotrexate doses, nonsteroidal anti-inflammatory drugs (NSAIDs) and prednisone users were all comparable between groups. In addition, clinical disease parameters, including DAS, HAQ, pain, joint swelling and tenderness, ESR, rheumatoid factor (RF), anti-CCP and CD19+ cells were similar between groups prior to rituximab administration (see online supplementary table S1).
Metabolomics analysis
Polar and apolar fractions were prepared for all 43 samples and analysed by 1D 1H-NMR and UPLC–MS/MS, respectively.31 ,35 ,38–42 Identified polar metabolites include amino acids, ketone bodies and intermediates of energy metabolism (see online supplementary table S2). Interrogation of several reference libraries yielded 584 known lipid compounds from the apolar fraction.35 ,37–39 Several major classes of lipids were well represented including phosphatidic acids (PA), phosphatidylcholines (PC), phosphatidylethanolamines (PE), phosphatidylglycerols (PG), phosphatidylinositols (PI), phosphatidylserines (PS), sphingomyelins, ceramides, sterols, triglycerides and free fatty acids. Conventional ester, alkyl ether (O-prefix) and alkenyl ether (P-prefix) linkage glycerophospholipids were identified.
Differences in metabolite profiles before treatment
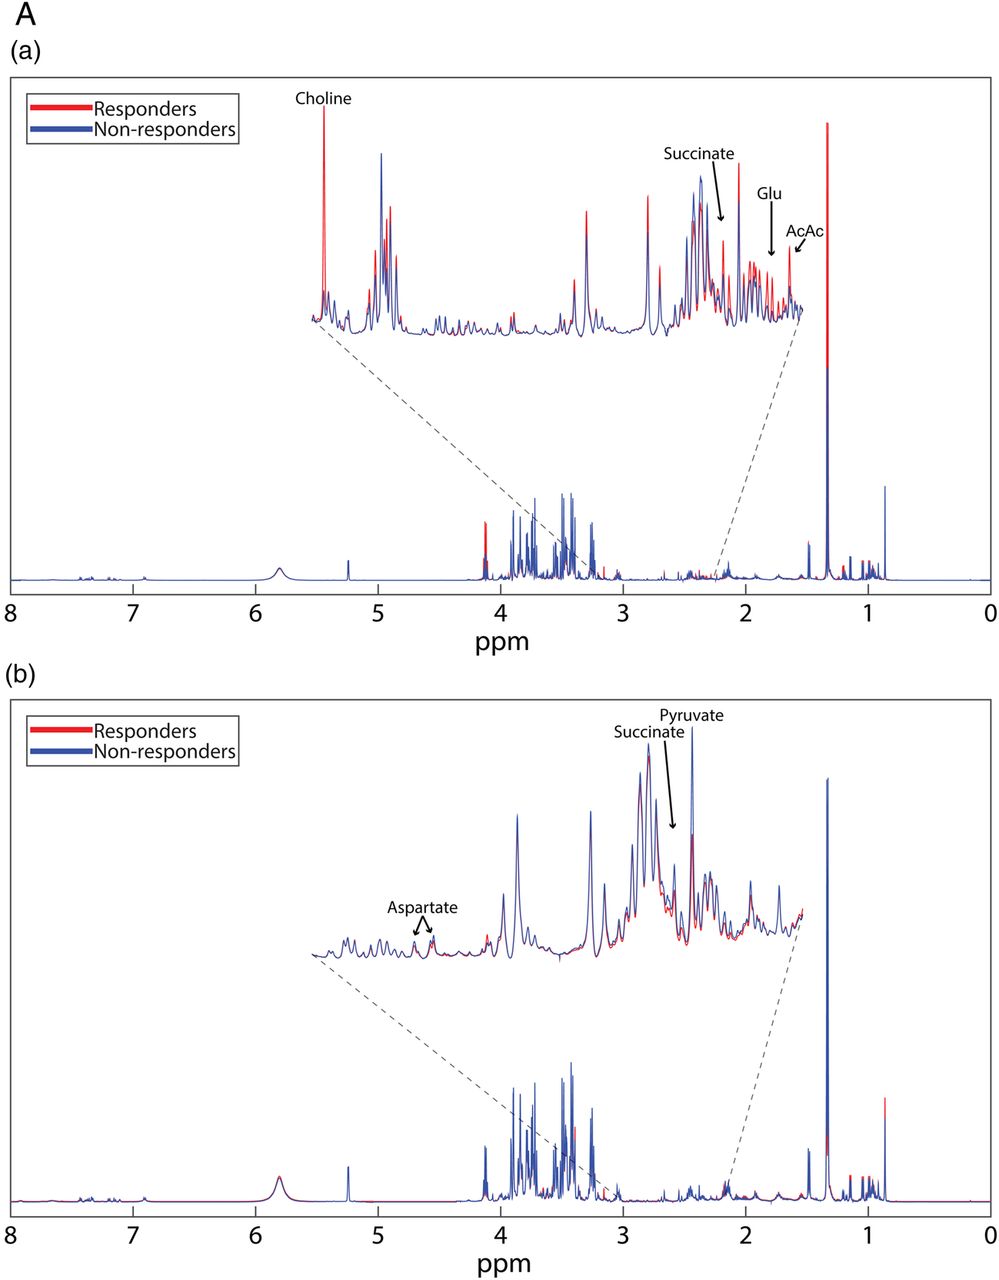
Polar metabolite profiles of patient sera before rituximab therapy was accomplished using 1D 1H-NMR spectroscopy (figure 1A(a)). Thirteen polar metabolites had p<0.10, seven of which achieved p<0.05 (phenylalanine, 2-hydroxyvalerate, succinate, choline, glycine, acetoacetate and tyrosine; figure 1B(a)). Mean spectra (figure 1A(a)) show that most, but not all features are diminished in responders. Pearson's correlation coefficients show positive relationships between identified polar metabolites. Metabolites primarily cluster into groups according to their biological function or chemical classification (see online supplementary figure S1).

(A) Mean NMR spectra of patient sera show differences in metabolite intensities between responders and non-responders before (a) and 6 months after (b) treatment with rituximab. Variations in metabolite concentrations between groups indicate unique metabolite profiles between responders and non-responders at both time points. Labelled peaks indicate significant metabolites. (B) Concentrations of specific polar metabolites are different between rituximab responders and non-responders. The mean concentrations (±SD) of sera polar metabolites of patients with RA measured by 1H-NMR before (a) and after (b) treatment with rituximab (lactate excluded due to scale). These metabolites represent a group of potential biomarkers for predicting and assessing patient response to rituximab treatment. *p<0.1 **p<0.05. AcAc, acetoacetate; Glu, glutamate; NMR, nuclear magnetic resonance; RA, rheumatoid arthritis.
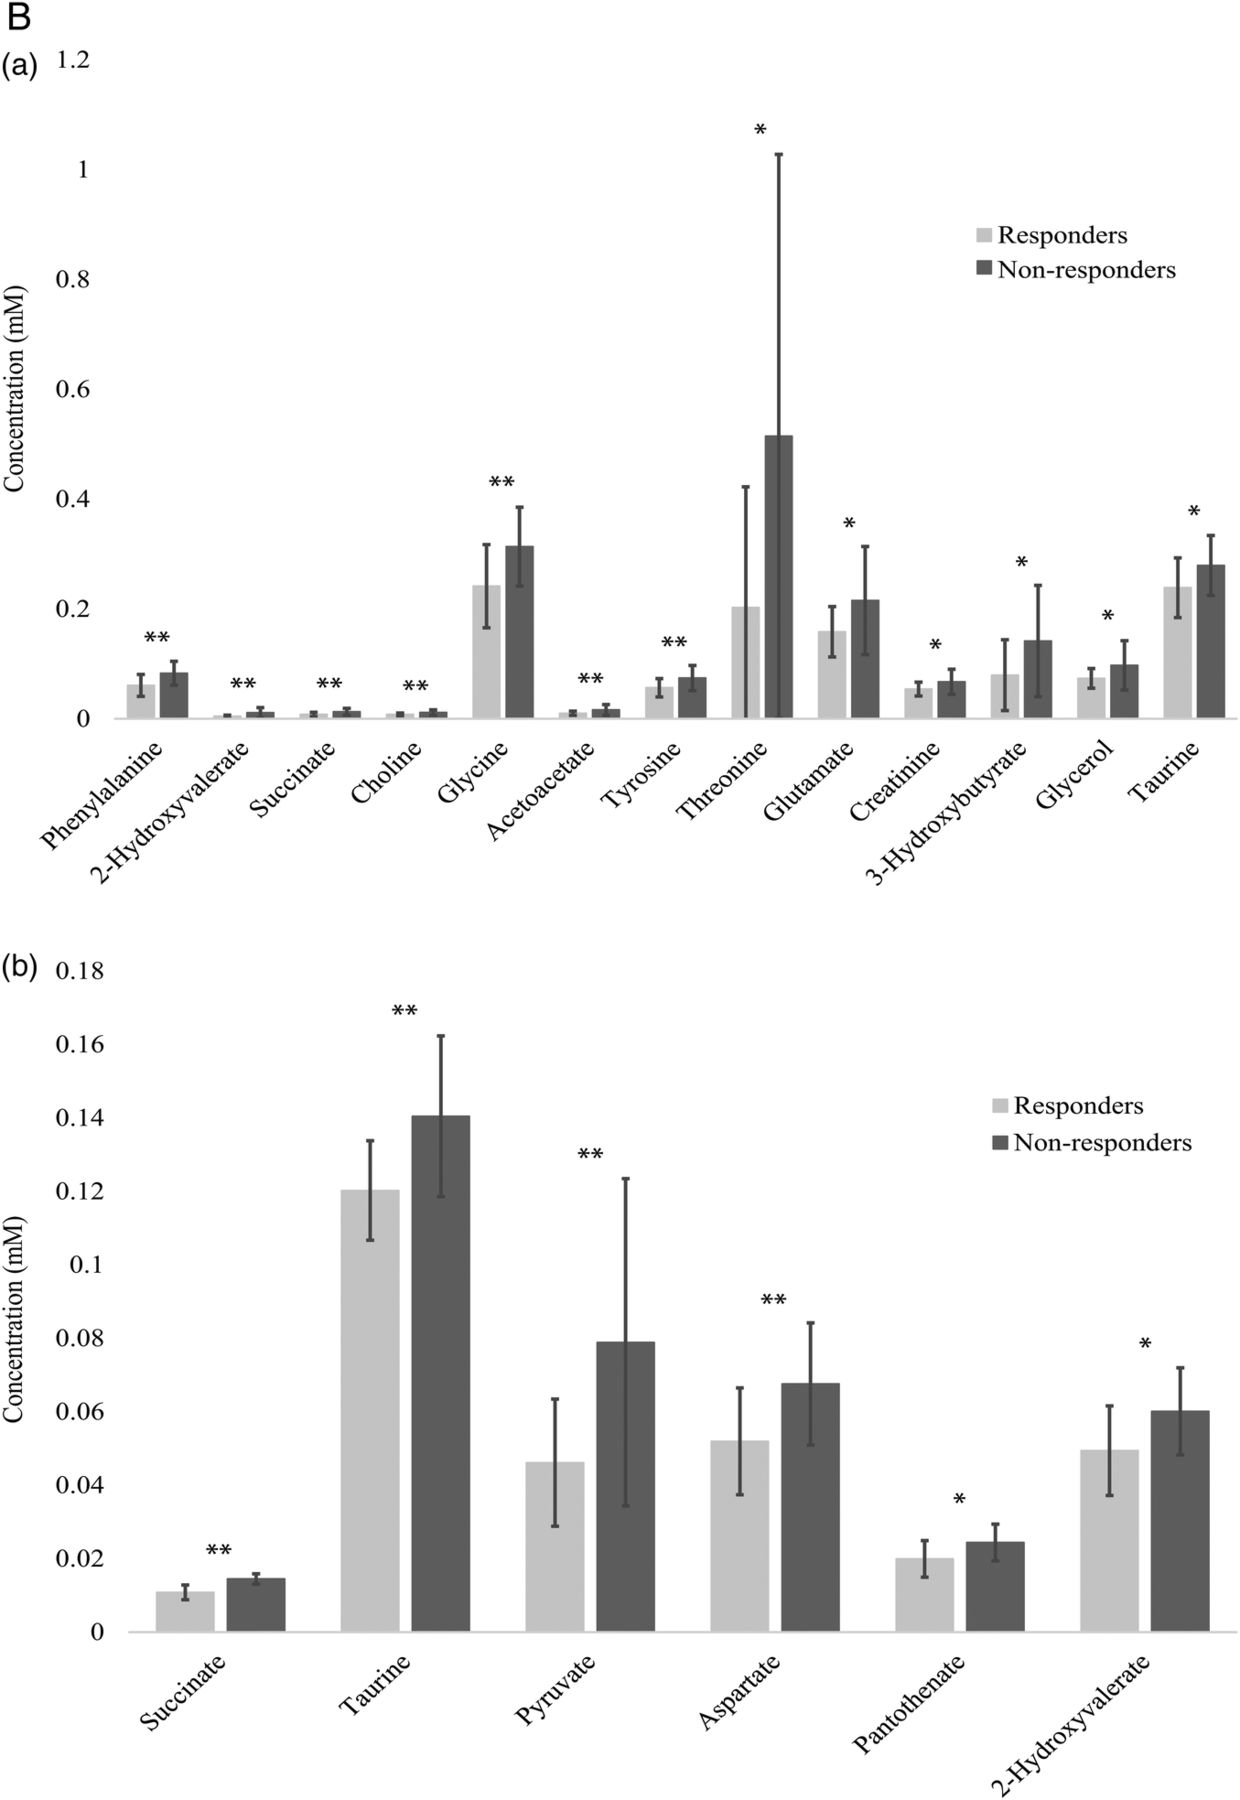
Continued
Apolar metabolites were isolated by UPLC–MS/MS in negative and positive modes for the most complete lipidome coverage. Thousands of features were detected in the MS spectra, of which, 584 were matched to known compounds reported in established libraries. Forty-one identified compounds achieved p<0.10. Of these lipids, 15 reached p<0.05 (see online supplementary table S3). Of the statistically different lipids, 80% (12/15) were glycerophospholipids, suggesting that regulation and metabolism of this lipid class is an important difference between groups. Lipid species that were identified as statistically significant were grouped according to their classes. This revealed interesting trends among lipid species. Relative to non-responders, responders displayed elevated levels of ester-linked PI and PC. In contrast, ester linked PG, all PE, all PS, O/P-PC and O/P-PI were lower in responders than non-responders (see online supplementary table S5).
Differences in metabolite profiles following treatment
Serum collected at the 6-month follow-up was used for metabolomics analysis. Mean 1D 1H-NMR spectra at 6 months (figure 1A(b)) show clear differences between time points that are indicative of differential metabolic response to rituximab as well as the effects of rituximab on both populations despite clinical parameters. Polar metabolite quantification at 6 months revealed seven metabolites that attained p<0.10 between responders and non-responders. Five of these metabolites, succinate, taurine, lactate, pyruvate and aspartate achieved p<0.05 (figure 1B(b)).
Following rituximab therapy, the composite UPLC–MS analysis of the apolar fraction of patient sera resulted in the identification of 69 lipid species that achieved p<0.10. Of these, 37 metabolites resulted in p<0.05 (see online supplementary table S4). Similar to baseline, many of these lipid species belong to the glycerophospholipid class (24/37 or 65%). Again, significant lipids were clustered by class to identify trends. Relative fold-changes were calculated for lipid species that were significant between responders and non-responders (data not shown). Six months after treatment with rituximab, elevated levels of PA, PC, PS and O/P-PG were observed in responders relative to non-responders. Conversely, PE, PG, O/P-PI, O/P-PC and O/P-PS were lower in responders than in non-responders (table 1).
Pathway analysis of polar compounds by MetaboAnalyst
Statistical analysis of metabolite profiles
Polar and apolar data sets were combined to capture the relative contribution of each metabolite to the overall differences observed between responders and non-responders before and after rituximab treatment. At both time points, PLSDA successfully separated responders and non-responders (figure 2). Pretreatment and post-treatment metabolites show similar degrees of separation, particularly with respect to latent variable 1 (LV1). Following treatment, separation is largely diminished in regard to latent variable 2 (LV2), reflecting the observed shifts in the metabolite profiles of both groups over time. Despite the relatively small latent variables, clear separation between groups is observed in both score plots, particularly in the x-direction. The R2 values for pretreatment and post-treatment analyses were 0.91 and 0.97, respectively (see online supplementary table S6).
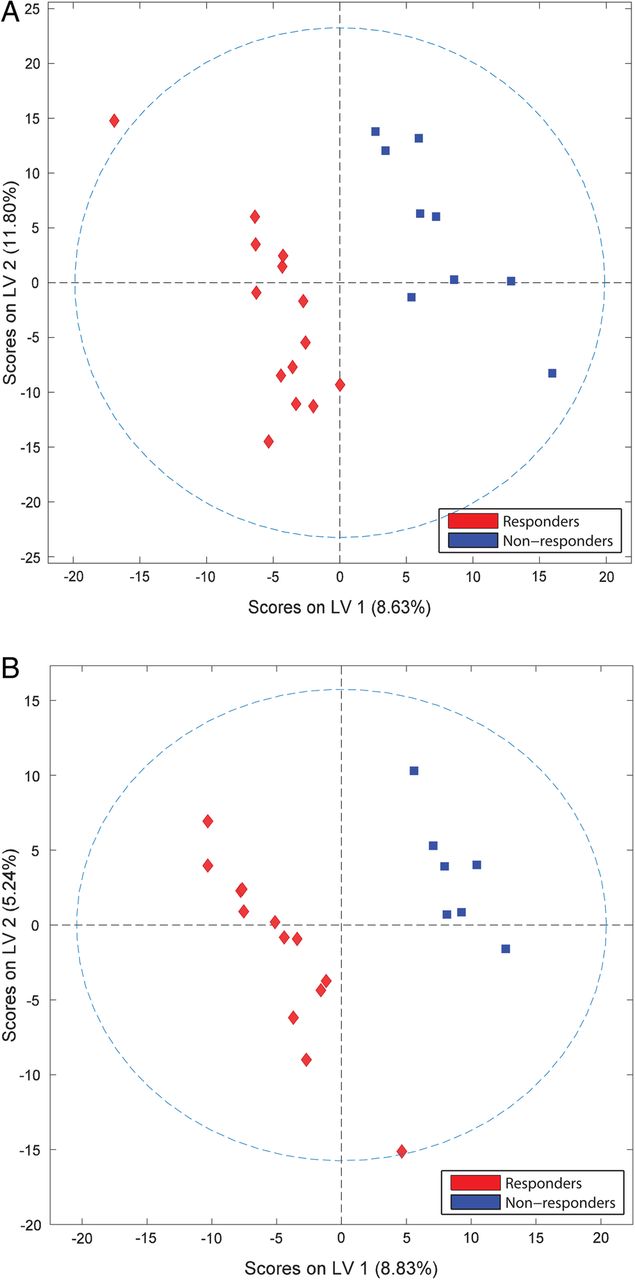
Sera metabolite profiles of patients with RA discriminate rituximab responders and non-responders. PLSDA score plots obtained from NMR and MS of samples collected before (A) and after (B) treatment with rituximab demonstrate group separation based on latent variables (LVs). LV1, latent variable 1; LV2, latent variable 2; NMR, nuclear magnetic resonance; MS, mass spectrometry; PLSDA, partial least squares discriminant analysis; RA, rheumatoid arthritis.
Owing to the large number of apolar metabolites identified, lipids were grouped into general classes, to simplify analysis and draw conclusions based on metabolite chemistry and biological function as opposed to chain length or minor differences in double bond number and location. Fold changes were calculated using only the metabolites present in >50% of the patient samples to ensure more robust results. This information was then used to generate a pathway to visualise global shifts in metabolite profiles as opposed to specific changes to individual metabolites.
Pathway analysis
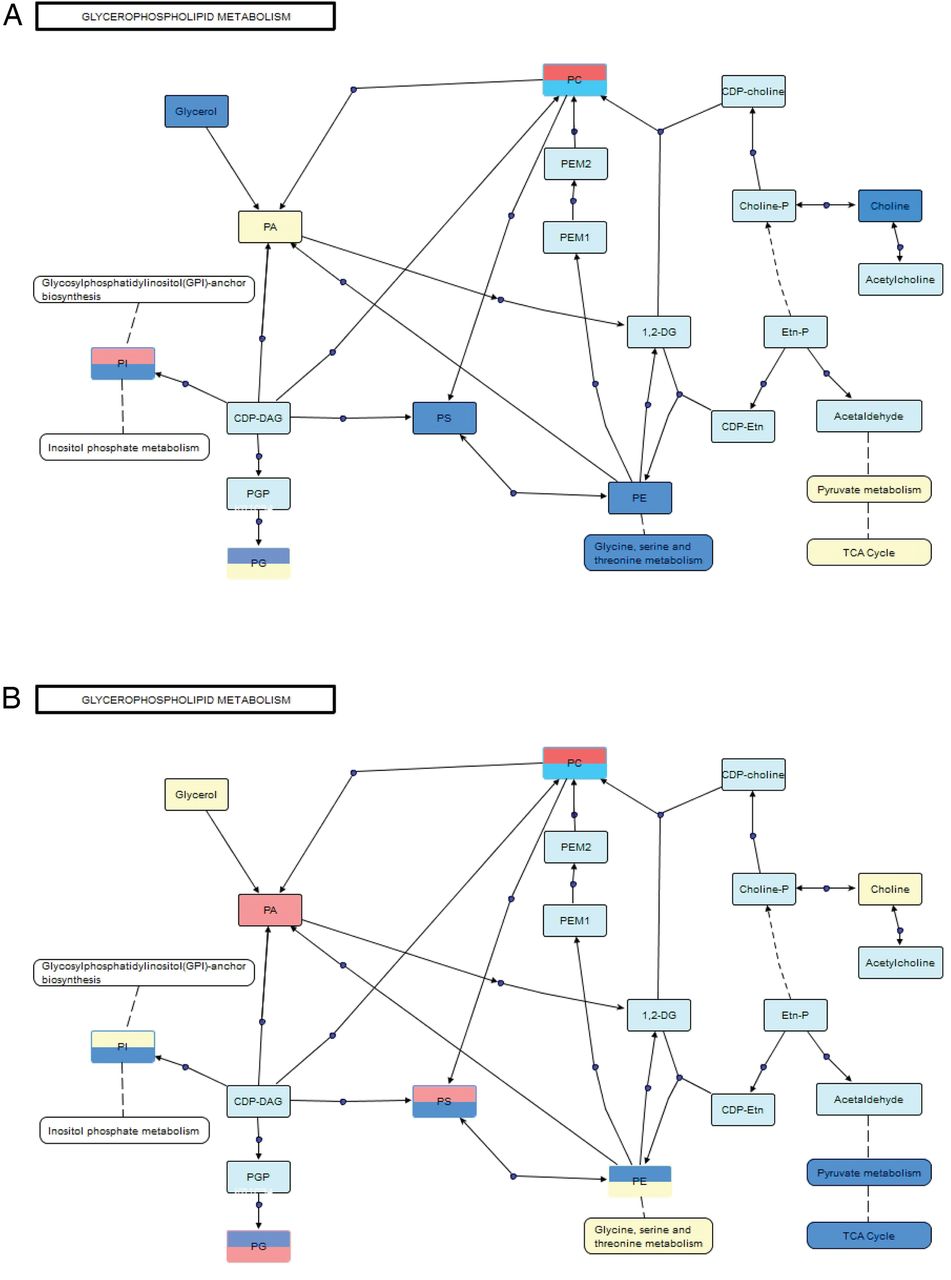
Polar metabolites were mapped to known metabolic pathways using MetaboAnalyst V.3.0.41 Pathways were ranked by their overall p values (table 1). VANTED software42 was used to construct a metabolic pathway for glycerophospholipids, which represents the majority of the significant apolar metabolites identified at both time points (≥65% for both). Mixed polar and apolar pathway analysis were combined to provide a comprehensive picture of the global differences in metabolism between rituximab responders and non-responders (figure 3). Pathway analyses were performed at both time points to reflect metabolic changes initiated by rituximab therapy. Prior to treatment, several classes of glycerophospholipids were downregulated in responders relative to non-responders. Similarly, the polar metabolites related to these pathways were also lower in responders. Downregulation of the glycine, serine and threonine pathway, which is connected to PE and PS metabolism, is consistent with the observed relative intensities of these phospholipid classes in responders. Furthermore, choline, an essential component of PC, was reduced in responders, which is consistent with the relative downregulation of O/P-PC. Free glycerol was also lower in responders when compared to non-responders prior to treatment with rituximab. Taken together, these data indicate that the global metabolite signatures of responders and non-responders are distinctive before treatment with rituximab.
Glycerophospholipids and related metabolites are differentially expressed in sera from patients with RA before (A) and after (B) treatment with rituximab. Pathway map connects related classes of compounds based on biological activity. Blue indicates classes that are downregulated in responders, red indicates classes that are upregulated in responders, yellow is no significant difference and light blue indicates not detected. Split boxes represent standard ester linkage glycerophospholipids on the top and alkyl ethers on the bottom. CDP, cytidine diphosphate; CDP-Etn, CDP-ethanolamine; Etn-P, phosphoethanolamine; PA, phosphatidic acids; PC, phosphatidylcholines; PE, phosphatidylethanolamines; PEM1, phosphatidyl-N-monomethylethanolamine 1; PEM2, phosphatidyl-N-monomethylethanolamine 2; PG, phosphatidylglycerols; PM1, phosphatidyl monomethylethanolamine; PS, phosphatidylserines; TCA, tricarboxylic acid.
In many cases, treatment with rituximab either ablated or reversed the trends observed before treatment. The previously detected differences in the glycine, serine and threonine metabolic pathway as well as glycerol and choline were not observed after treatment. Instead, changes in pyruvate metabolism and tricarboxylic acid (TCA) cycle intermediates, namely, lactate, pyruvate, fumarate, citrate and succinate, contributed more significantly to differences seen between the groups following treatment. Changes in apolar metabolites involved in the glycerophospholipid pathway were consistent with their polar counterparts. Interestingly, after treatment there are distinct trends between ester and alkyl/alkenyl ether (O/P-) linkage species for all major classes of phospholipids. In fact, in many cases, opposite trends were observed between linkage types for the same class of phospholipid. These differences clearly demonstrate that global metabolite signatures of responders and non-responders are distinctive following treatment with rituximab.
Discussion
Sera collected from patients with RA were examined to identify potential biomarkers to predict response to rituximab treatment. At both time points, polar and apolar profiles were significantly different between patients with RA who were classified as either responders or non-responders according to their ACR20 scores. Prior to rituximab administration, 24 metabolites achieved p<0.05 between patients who would later be categorised as a responders and non-responders. When mapped into metabolic pathways, it becomes clear that metabolites involved in glycerophospholipid, amino acid and energy metabolism are all important pathways that are differentially regulated between responders and non-responders. As expected, following rituximab therapy, there were greater differences between responders and non-responders, with 43 significant metabolites, likely due to the changes induced by rituximab treatment. Interestingly, many trends between responders and non-responders were ablated and, in some cases, reversed the following treatment. In addition, several metabolites were significant in both groups when comparing time points. This is likely due to the fact that while both groups experienced loss of circulating B cells, there is still a discrepancy in metabolic response to rituximab as is indicated by the difference in clinical outcomes. Owing to the indiscriminate depletion of circulating B cells, some of these changes could represent the loss of metabolic pathways important within B cells and/or dependent on their presence and activation.
Currently, predictive biomarkers that would separate patient populations with RA with respect to their outcome in response to a particular therapy is an unmet need. Several approaches have been tried to address this issue. Most studies investigating differences in gene expression, mRNA and protein levels in blood have failed to successfully identify any good biomarker.43–45 Although a greater probability of clinical benefit from rituximab in CCP+ patients and normal levels of CD19+ B cells versus CCP− patient has been described,46 the effect is discreet and heterogeneous, so additional biomarkers are needed. Of interest, though, type I interferon signatures were found to negatively predict clinical response to rituximab.47 To the best of our knowledge, the metabolites that are known to be associated with interferons are in the kynurenine pathway.48 Metabolites in this pathway were either not detected or insignificant in our patient population. However, owing to the signalling potential of many lipids, in particular phosphoinositols, there may be a relationship between interferon activation and differences in lipid profiles that should be further investigated.
Here, we offer an alternative approach by identifying that global biomarker signatures may represent more appropriate approach for improving treatment protocols and outcomes of patients with RA. Metabolites serve as direct signatures of biochemical activity and may be easier to correlate with phenotype.49 Perturbations in a biological system lead to correlated changes in metabolite patterns and pathways, which represent the final response to disease status or an external intervention.49 ,50 NMR and MS can delineate patterns of changes and biomarkers that are highly discriminatory for the observed disease or intervention.1 A small number of metabolomics studies have been focused on identifying metabolites associated with rheumatic diseases, primarily for diagnostic purposes,22–24 but even fewer have attempted to predict response to treatment. An NMR analysis of baseline urine metabolome successfully discriminated patients with RA based on their response to anti-TNF therapy.2 Here, we used a different approach from previous studies, as we determined polar and apolar metabolite profiles by NMR and MS. Combining techniques provides more information about the pathways involved and a more complete profile to later discriminate between responders and non-responders before treatment.
Although these findings are certainly promising, this study is not without limitations. Most importantly, we evaluated a small number of clinical samples. Despite similar clinical parameters for patient inclusion, large biological variance is expected in primary samples. Confirmation of our results with a larger sample size from an independent group of patients is necessary to strengthen our conclusions and to improve statistical confidence. In addition, analysis was performed on peripheral blood samples. However, further studies are needed to evaluate relationship between circulating metabolites and synovial pathobiology. Metabolite profiles in blood if correlating with metabolic changes in synovial tissue will certainly help to know more about RA aetiology. Furthermore, this study assessed response to a single drug. Future studies comparing anti-B cell, anti T-cell, anti-IL6 and anti-TNF biological treatments simultaneously to determine whether different therapies can be successfully distinguished prior to initiation of treatment have the potential to further elucidate the relationship between metabolic dysregulation and RA.
Limitations exist for each approach. In vitro experiments yield more statistically consistent data but fail to accurately recapitulate the complexity of real biological systems. Genetic and protein biomarkers also tend to be less sensitive to biological perturbations than metabolite profiles, however, they often fail to explain differences observed between individuals. For these reasons, we feel that despite the limitations of this study, we have shown promising new data for improving protocols of patients with RA by applying a metabolomics approach to differentiate response to rituximab treatment. In addition, we have laid a foundation for continued metabolomics research into RA by providing baseline metabolic profiles for future investigation into RA specific metabolism and the relationship between treatment and circulating metabolites.
Acknowledgments
The authors thank Surendar Tadi for his technical support with the MS experiments.
References
Footnotes
ST and MG contributed equally.
Contributors MG and ST designed and supervised the overall project. DB and AK designed and conducted the ARISE trial. MG, ST, AK and SRS analysed the data and wrote the manuscript. SRS performed NMR and MS acquisition. SRS, AL and BW processed and interpreted NMR and MS data.
Funding This work was supported by grants from the National Institutes of Arthritis and Musculoskeletal and Skin (MG: 1K08AR064834). The support for the NMR facility was provided by the University of Texas Health Science Center at San Antonio (UTHSCSA) and National Institutes of Health Grant NCI P30 CA54174 (CTRC at UTHSCSA). Funding sources were not involved in a part of this study, including, but not limited to, data collection, analysis, reporting or publication.
Competing interests None declared.
Patient consent Obtained.
Ethics approval Patients were enrolled in the ARISE clinical trial following written informed consent. Ethical approval was granted by the Institutional Review Board (IRB) at UCSD.
Data sharing statement No additional data are available.