Article Text

Abstract
Objectives To assess the performance of circulating vascular endothelial growth factor (VEGF) levels as a tool for diagnosing giant cell arteritis (GCA) in a cohort of patients referred for assessment of suspected GCA.
Methods We selected 298 patients recruited to the multicentre study Temporal Artery Biopsy versus Ultrasound in diagnosis of suspected GCA (TABUL). In a random subset of 26 biopsy-proven GCA cases and 26 controls, serum from weeks 0, 2 and 26 was analysed for VEGF concentration using ELISA. VEGF concentration at week 0 was used to generate a receiver-operating characteristic curve and thereby identify a cut-off for an abnormal result which was used to analyse the full patient cohort. Sections of paraffin-embedded temporal artery were stained by immunohistochemistry for VEGF.
Results The mean (95% CI) VEGF concentration at week 0 was 873 pg/mL (631 to 1110) in 26 patients versus 476 pg/mL (328 to 625) in 26 controls (p=0.017). This difference was not observed at any other time point. The optimal cut-off of 713 pg/mL was applied to the whole patient cohort (n=298), yielding sensitivity of 32% and specificity of 85%. This was not improved by combination with any clinical parameters. When patients with biopsy-proven GCA were compared with controls, sensitivity was 58% and specificity remained 85%. Sections of biopsy from biopsy-positive GCA showed intense staining in the adventitia which was not seen in controls.
Conclusions Serum VEGF concentration predicts biopsy positivity but is not useful for differentiating clinical cases of GCA from controls. Further studies into VEGF as a prognostic marker and therapeutic target are warranted.
Trial registration number NCT00974883; Post-results.
- Giant Cell Arteritis
- Systemic vasculitis
- Inflammation
This is an Open Access article distributed in accordance with the Creative Commons Attribution Non Commercial (CC BY-NC 4.0) license, which permits others to distribute, remix, adapt, build upon this work non-commercially, and license their derivative works on different terms, provided the original work is properly cited and the use is non-commercial. See: http://creativecommons.org/licenses/by-nc/4.0/
Statistics from Altmetric.com
Key messages
What is already known about this subject?
Vascular endothelial growth factor (VEGF), mainly derived from macrophages and giant cells, promotes angiogenesis and increased vascular permeability in health and in disease.
Circulating levels of VEGF are increased in patients with giant cell arteritis (GCA).
What does this study add?
We have shown that levels of circulating VEGF are significantly higher in patients with newly diagnosed GCA compared with controls, especially if their temporal artery histology is positive, but could not be used to successfully differentiate between cases and controls.
How might this impact on clinical practice?
There is not enough evidence to use VEGF as a diagnostic test, either alone or in combination with clinical features suggesting the diagnosis.
The role of VEGF as a prognostic marker or potential therapeutic target could be explored.
Introduction
Giant cell arteritis (GCA) is the most common primary systemic vasculitis1 ,2 typically presenting with headache, constitutional symptoms and visual disturbance.3 Diagnosis is challenging,4 relying on clinical judgement and imperfect yet potentially invasive tests including temporal artery biopsy.5 Elevation of inflammatory markers (erythrocyte sedimentation rate (ESR) and C-reactive protein (CRP)) are non-specific and can be misleading.6 Furthermore, permanent visual loss affecting up to 20%7 requires timely diagnosis. Most patients present to their general practitioner; therefore, a serological biomarker that could be tested in primary care, could aid the diagnosis of GCA thereby avoiding more invasive, costly and time-consuming tests.
Pentraxin-3 is a peripheral marker upregulated in GCA, and associated with optic nerve ischaemia.8 Pentraxins are members of the acute phase reactant superfamily. Pentraxin-3 is synthesised in response to vascular injury,9 and levels correlate with disease activity in small-vessel vasculitides.10 ,11 Therefore, it holds promise as a potential biomarker in GCA.
Vascular endothelial growth factor (VEGF) promotes angiogenesis and increased vascular permeability in health and in disease.12 There are five variants of which VEGF-A is the predominant in adults,13 with higher levels in serum than in plasma.14 In GCA, neoangiogenesis occurs throughout the vessel wall, correlating with increased tissue expression of VEGF.15 The main source of VEGF is CD68 macrophages and giant cells within the vessel wall,15 ,16 and this local production of VEGF is mirrored by raised serum levels of VEGF in patients with GCA compared with controls.8 Furthermore, allelic variants in VEGF confer different susceptibility to development of GCA17 ,18 and certain polymorphisms are associated with increased risk of ischaemic complications.18 ,19
VEGF may function in GCA either to compensate for ischaemia in the thickened artery,20 or to drive inflammation by increasing new blood vessels which are the primary expressers of adhesion molecules involved in recruitment of inflammatory cells.16 Regardless of its role, VEGF represents an attractive candidate biomarker for the diagnosis of GCA. We evaluated the performance of VEGF-A as a diagnostic tool for GCA within a large cohort study of patients referred with suspected GCA (Temporal Artery Biopsy vs ULtrasound study (TABUL), HTA 08/64/01). We also undertook a preliminary investigation of pentraxin-3 as a candidate diagnostic marker for GCA.
Materials and methods
Study population
We used samples collected during the TABUL study, n=298 total serum samples, and n=40 total plasma samples. Written consent was obtained according to the Declaration of Helsinki (BMJ 1996; 313:1448) and ethical approval was gained from Berkshire Research Ethics Committee (09/H0505/132). TABUL recruited patients referred to secondary care for investigation and management of suspected GCA. Patients with a previous diagnosis of GCA or polymyalgia rheumatica, and those who had received glucocorticoids for longer than 7 days, were excluded. Among the 298 participants, 202 patients had a final diagnosis of GCA (based on expert consensus using clinical judgement, histology, biochemistry and imaging), and 96 patients were given a diagnosis other than GCA (controls). Clinical data were collected during the study including age, sex, presenting symptoms, glucocorticoid duration at baseline and laboratory test results (ESR and CRP). Research bloods were taken at baseline (week 0) and at week 2 and month 6 of follow-up. Serum samples were prepared as per standard protocols and frozen at −80°C within 4 hours. No samples had been thawed prior to use in this study.
Enzyme-linked immunosorbent assay
Serum samples were analysed in duplicate using a high-sensitivity ELISA kit (R&D systems, Quantikine Human VEGF-165 kit, assay range 31.2–2000 pg/mL) according to the manufacturers' instructions. Each plate included a standard curve of known VEGF concentrations, and calculations were performed using a four-parameter logistical curve fitting. In a random subset of 26 biopsy-proven GCA cases and 26 controls, sera from weeks 0, 2 and 26 were analysed for VEGF concentration using ELISA. VEGF concentration at week 0 was used to generate a receiver-operating characteristic curve and identify a cut-off for abnormal results, which was used to analyse the full patient cohort. For pentraxin-3 measurements, plasma samples were used. Samples from 20 randomly selected biopsy-proven GCA patients and 20 controls were analysed in duplicate using a high-sensitivity kit, according to the manufacturer's instructions (R&D systems, Quantikine Human Pentraxin-3 kit, assay range 0.3–20 ng/mL).
Immunohistochemistry
Paraffin-embedded temporal artery samples were obtained from the TABUL study for five patients; three had a positive biopsy and two were control patients. Sections were cut at 4 μm and mounted on adhesive glass slides for staining. Slides were deparaffinised in xylene and rehydrated through a graded series of 100–50% ethanol. Endogenous peroxidase activity was blocked by 3% hydrogen peroxide. Heat-induced antigen retrieval for VEGF-A was performed by citrate buffer (10 mM anhydrous citric acid, 0.05% Tween 20, pH 6.0). Non-specific reactivity was blocked in buffer solution containing 3% filtered bovine serum albumin (BSA). Representative sections from each patient were incubated with 1:100 dilution of rabbit anti-human VEGF polyclonal IgG antibody (ABCAM). Negative control sections were incubated with non-immune rabbit IgG (R&D Systems). Secondary biotinylated goat anti-rabbit antibody (Vector Laboratories) was added at 1:250 dilution before incubation with avidin-biotin-peroxidase (ABC, Vectastain Elite kit, Vector Laboratories). Staining was developed with DAB substrate kit (Vector Laboratories) and counterstained with haematoxylin (Vector Laboratories). Images were captured using a microscope (Zeiss Imager M1) connected to a camera (Zeiss Axiocam). For general morphological analysis, serial sections were stained with Mayer's H&E.
Sample size calculation
For the VEGF subset, sample size was based on previous analysis21 with mean values in the control group of 362 pg/mL (SD=178 pg/mL) and mean values in the GCA group of 1145 pg/mL. Therefore, to give an α of 0.01 and a power of 0.9, the required size was 26 per group. For the pentraxin-3 study, the sample size was based on Baldini et al8 where pentraxin-3 in controls was 3.97±0.28 ng/mL and in patients with GCA, it was 23.3±4.06 ng/mL. Therefore, to give an α of 0.01 and a power of 0.9, the required size was 20 per group.
Subgroup analysis
In 26 cases and 26 controls, we undertook a subanalysis of glucocorticoid duration, grouping patients according to duration of steroid treatment, since the data were insufficient to allow for overall exposure to be calculated.
Statistical analyses
Statistical analysis was undertaken in GraphPad Prism V.6 and SPSS. Unless stated, significance was tested with the Mann-Witney U test for non-normally distributed data, with Bonferroni correction where appropriate for multiple comparisons. Receiver-operating characteristic curves, contingency table analysis, correlation and linear regression were performed in Prism V.6. Classification and regression tree analysis was performed in SPSS Statistics V.23 according to its standard protocols, using an input of VEGF concentration (high/low) and final diagnosis alongside other parameters including ESR, CRP and individual clinical features.
Results
From 298 available patients in the TABUL cohort (see figure 1), a randomly selected subset of 26 biopsy-proven cases of GCA were compared with 26 control patients who did not have GCA (Not GCA). These groups had an identical sex split (62% women each) but the mean age was slightly higher in the GCA group compared with controls (76, SD=7.3 vs 66, SD=11.3; p=0.003). The serum concentration of VEGF was measured at baseline (week 0), week 2 and week 26 (figure 2A). The mean (95% CI) baseline VEGF concentration was 873 pg/mL (631 to 1110) in GCA compared with 476 pg/mL (328 to 625) in controls (p=0.017). However, this difference was not observed at any later time point.
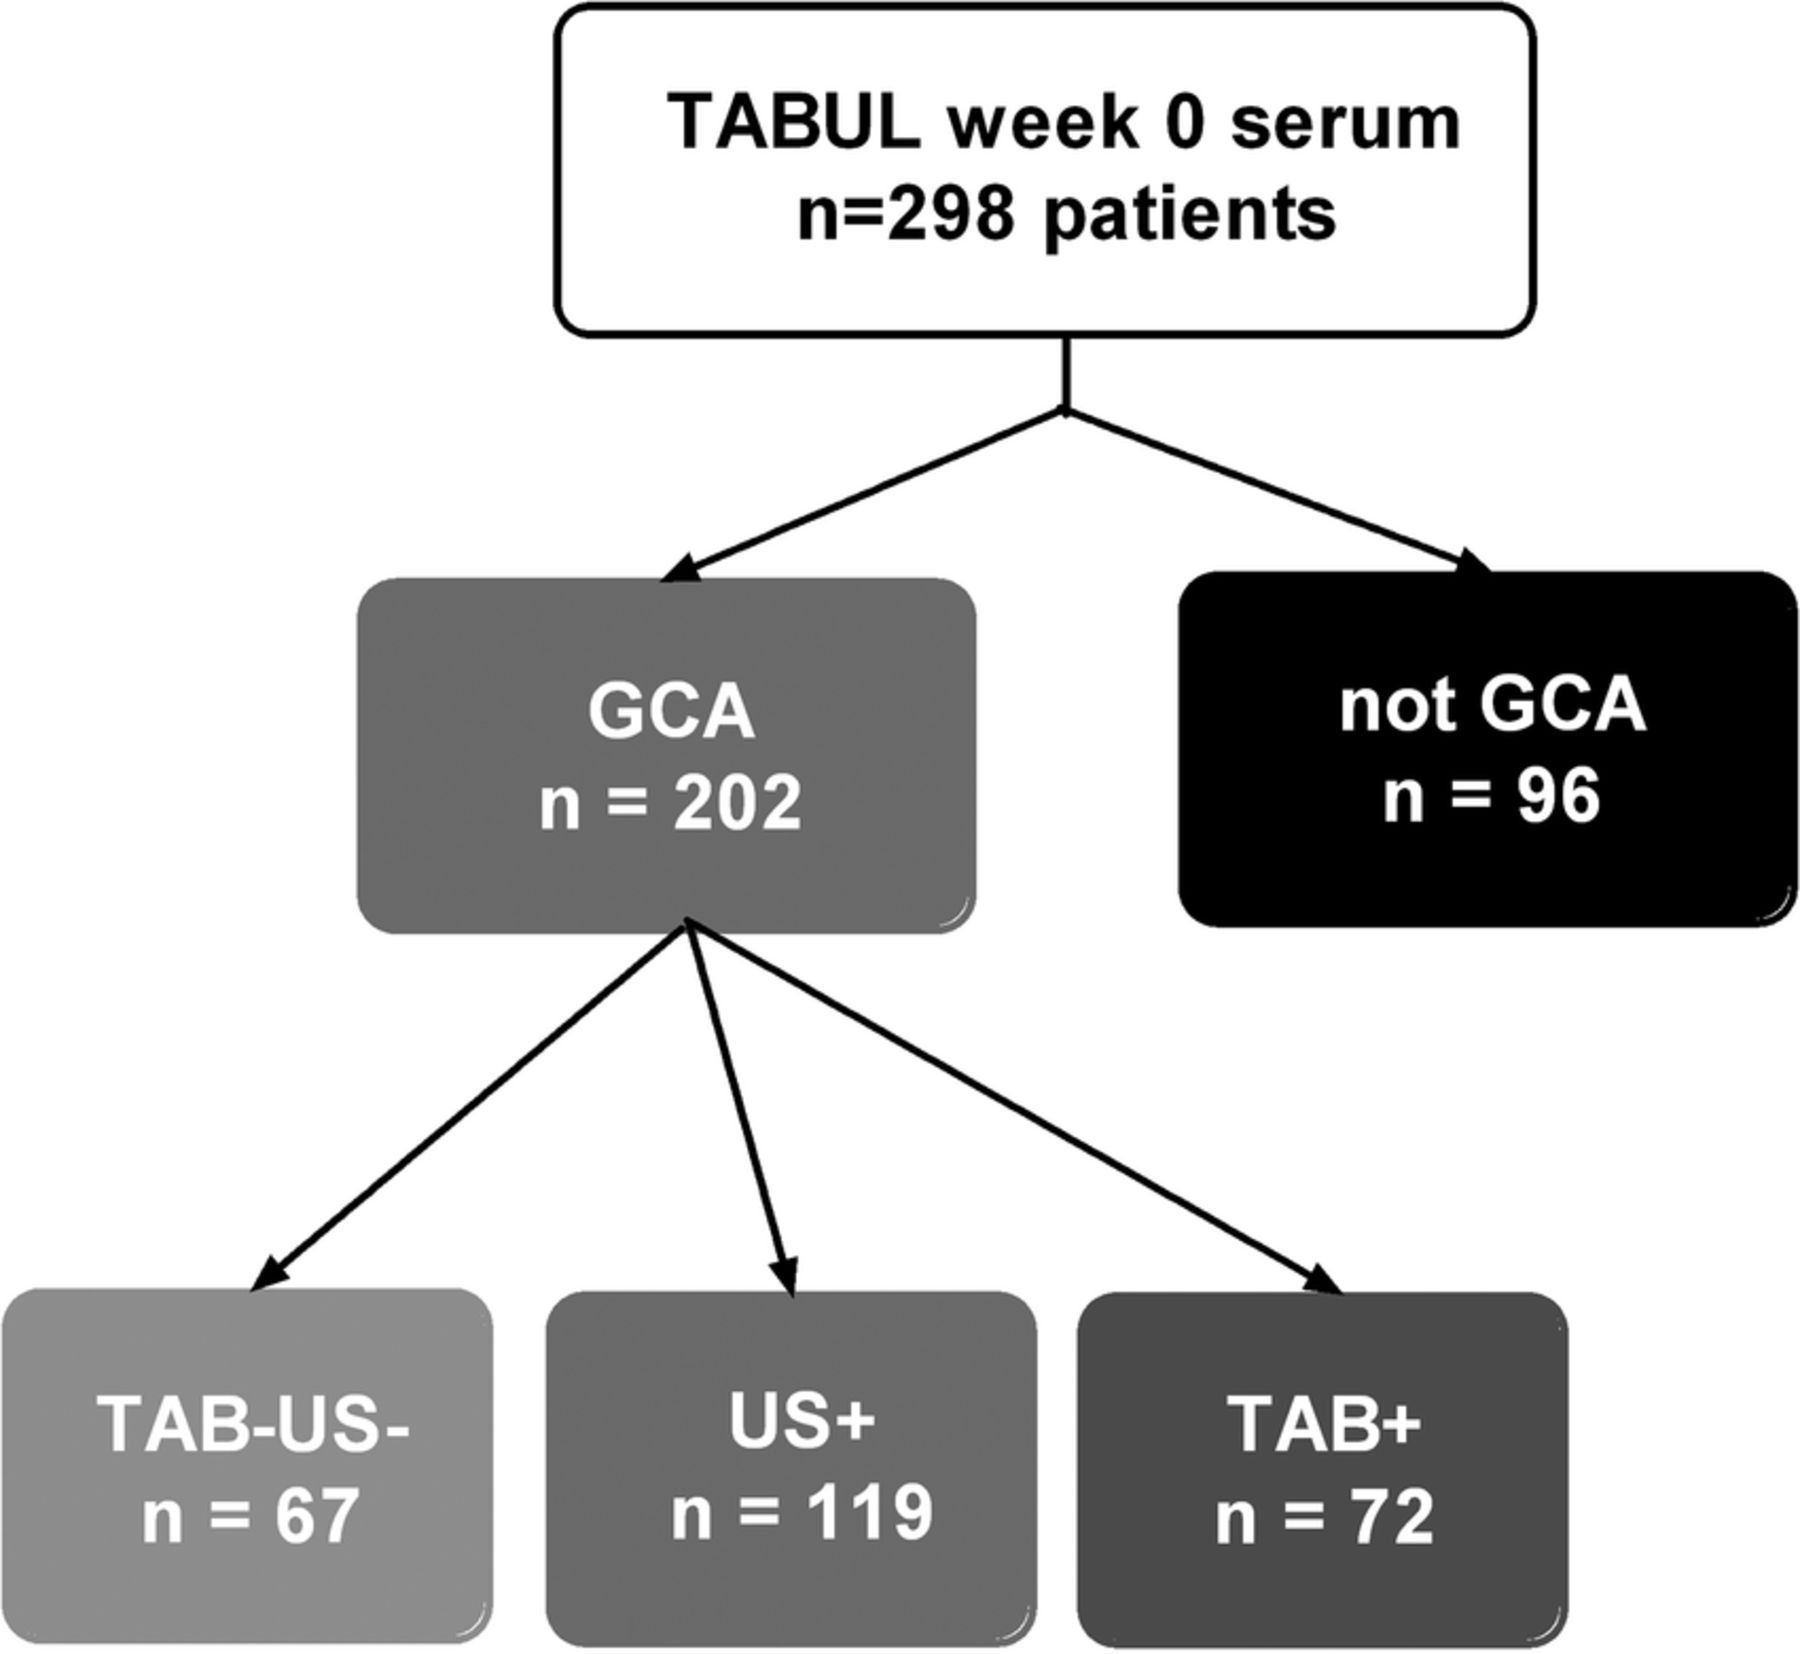
Distribution of patients amongst diagnostic groups in this study. TAB=temporal artery biopsy, US=temporal artery ultrasound, +=positive result compatible with GCA, −=negative result.
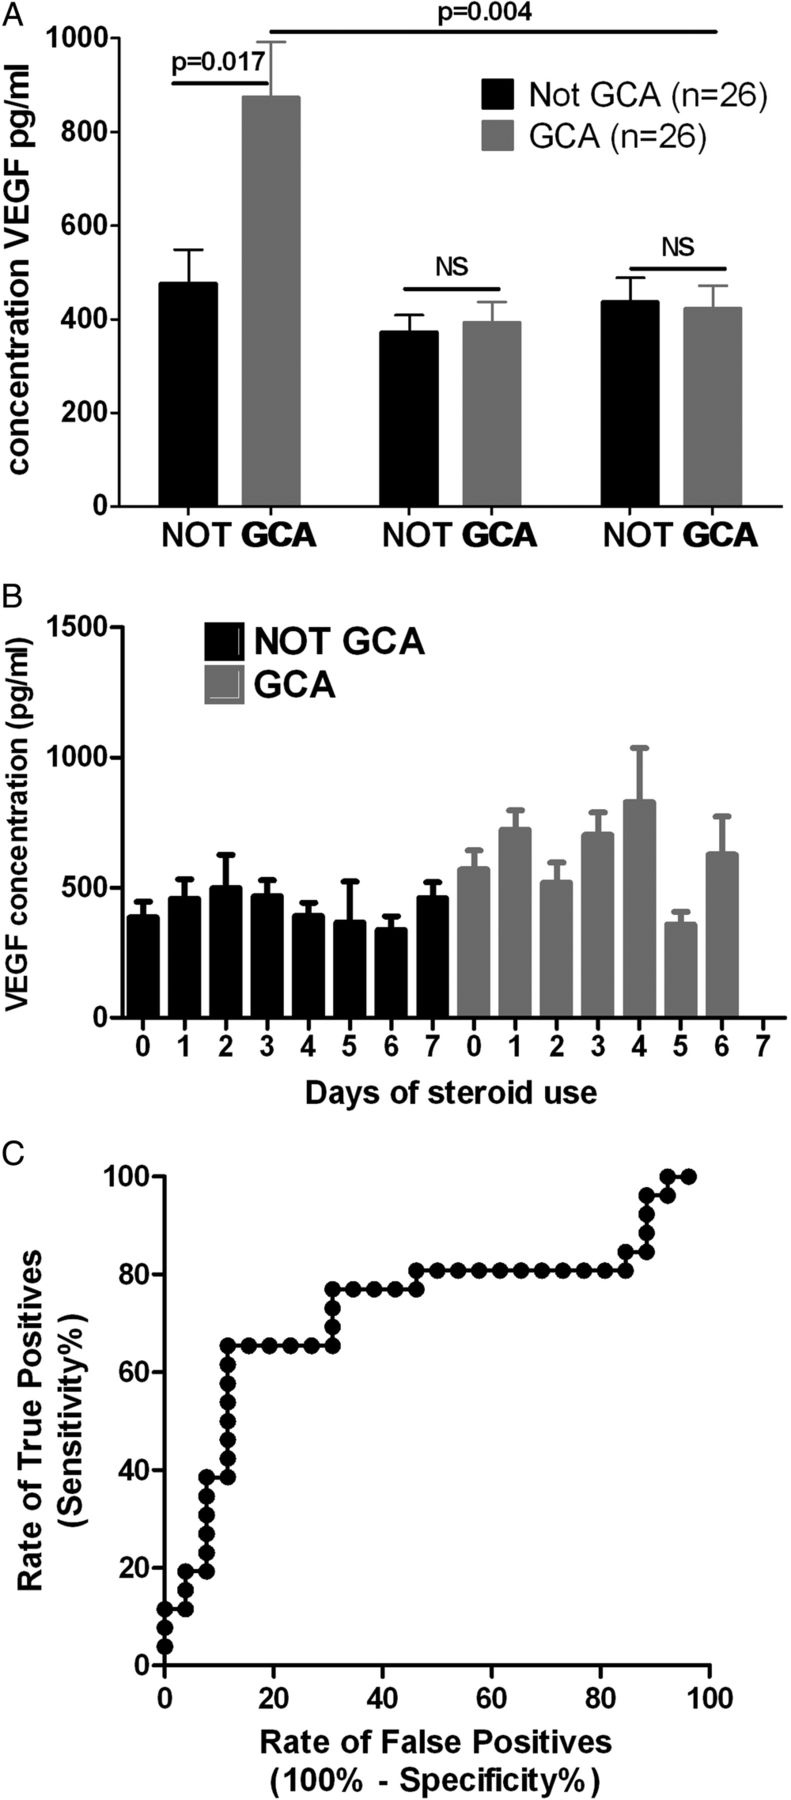
A. Serum VEGF is raised in patients with biopsy-proven GCA compared to controls at week 0, but this is not seen at any other time-point; B. Serum VEGF concentration is not dependent on duration of glucocorticoid therapy at the point of serum sampling. Graphs show mean ±SEM, significance tested with Mann-Whitney U test with Bonferroni correction; C. The receiver-operating characteristic curve for VEGF concentration at week 0 generates an optimal cut off of 713pg/ml
Mean serum VEGF concentration in GCA patients fell from 873 pg/mL at week 0 to 393 pg/mL at week 2. It was hypothesised that this rapid decline in VEGF concentration may represent glucocorticoid responsiveness. Since patients in TABUL had been taking glucocorticoids for between 0 and 7 days prior to their enrolment, it was possible that those with a longer duration of glucocorticoid therapy would have lower VEGF concentrations. This was tested with a subanalysis of VEGF concentration according to duration of glucocorticoid therapy and final diagnosis, but there was no association between glucocorticoid exposure and VEGF concentration (figure 2B). It was not possible to analyse overall glucocorticoid exposure because the data were insufficient for this purpose. The data from week 0 were used to fit a receiver-operating characteristic curve (figure 2C) which had an area under the curve of 0.73. The optimal cut-off for an abnormal result was 713 pg/mL, providing a sensitivity of 65% and specificity of 88%.
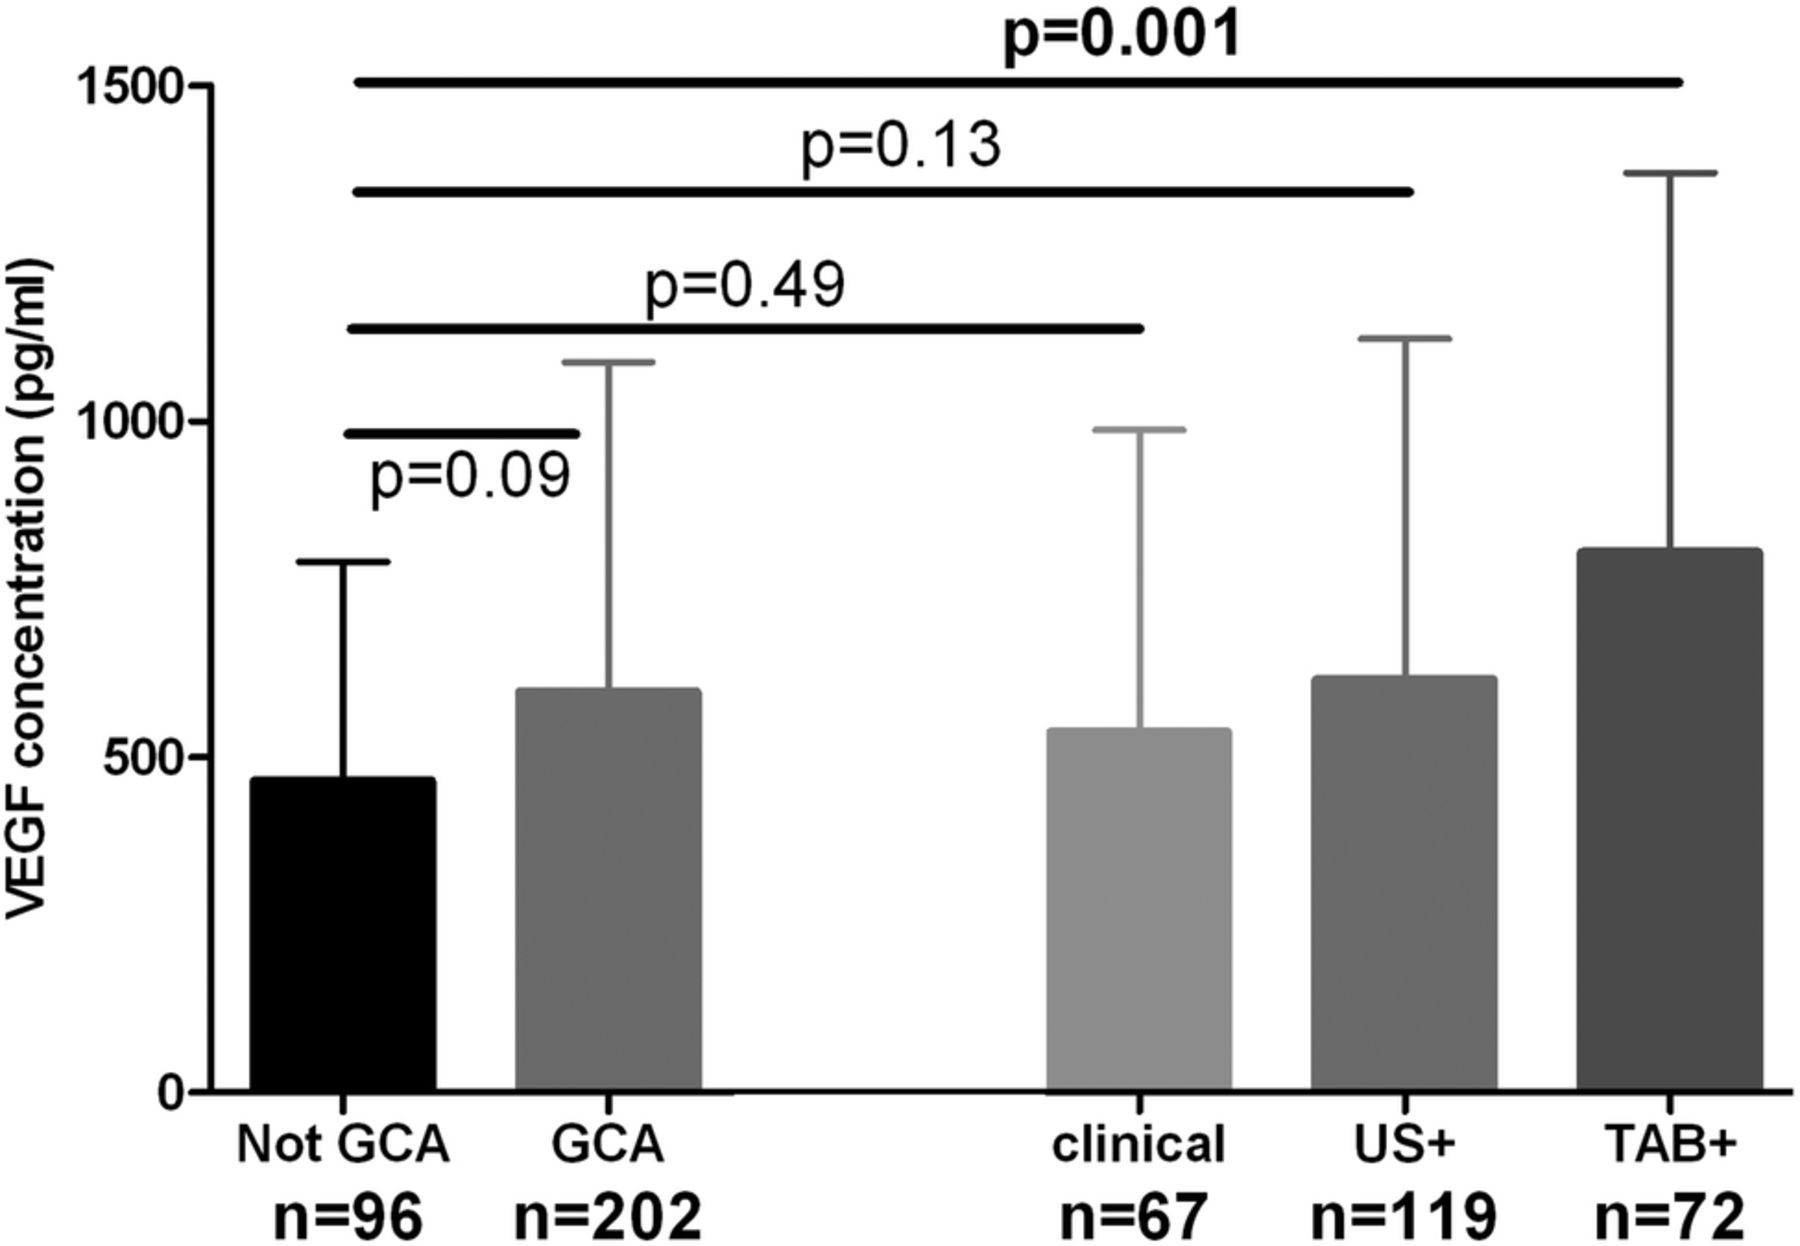
Sera from week 0 were analysed for all available TABUL patients, whose diagnosis was made by positive biopsy, positive ultrasound or purely clinical parameters (figure 1). VEGF concentration was higher in GCA (regardless of means of diagnosis) when compared with control patients but this difference was not significant (597 vs 464 pg/mL, p=0.09, see figure 3). When patients were separated into subgroups according to the means of diagnosis, the VEGF concentration at week 0 was significantly higher only for patients with a positive biopsy (804 vs 464 pg/mL, p=0.001). Diagnoses for control patients were as follows: 67% non-specific headache, 1% temporomandibular dysfunction, 11% cervical spondylosis, 1% granulomatosis with polyangiitis (GPA), 1% other vasculitis, 19% other diagnosis (mostly acute infections).

VEGF concentration at week 0 is significantly raised in biopsy-proven GCA (TAB+) but not in Ultrasound-positive (US+) GCA or in clinical diagnoses of GCA. Graph shows mean ± 95% CI. Significance tested with Mann-Whitney U test with Bonferroni correction.
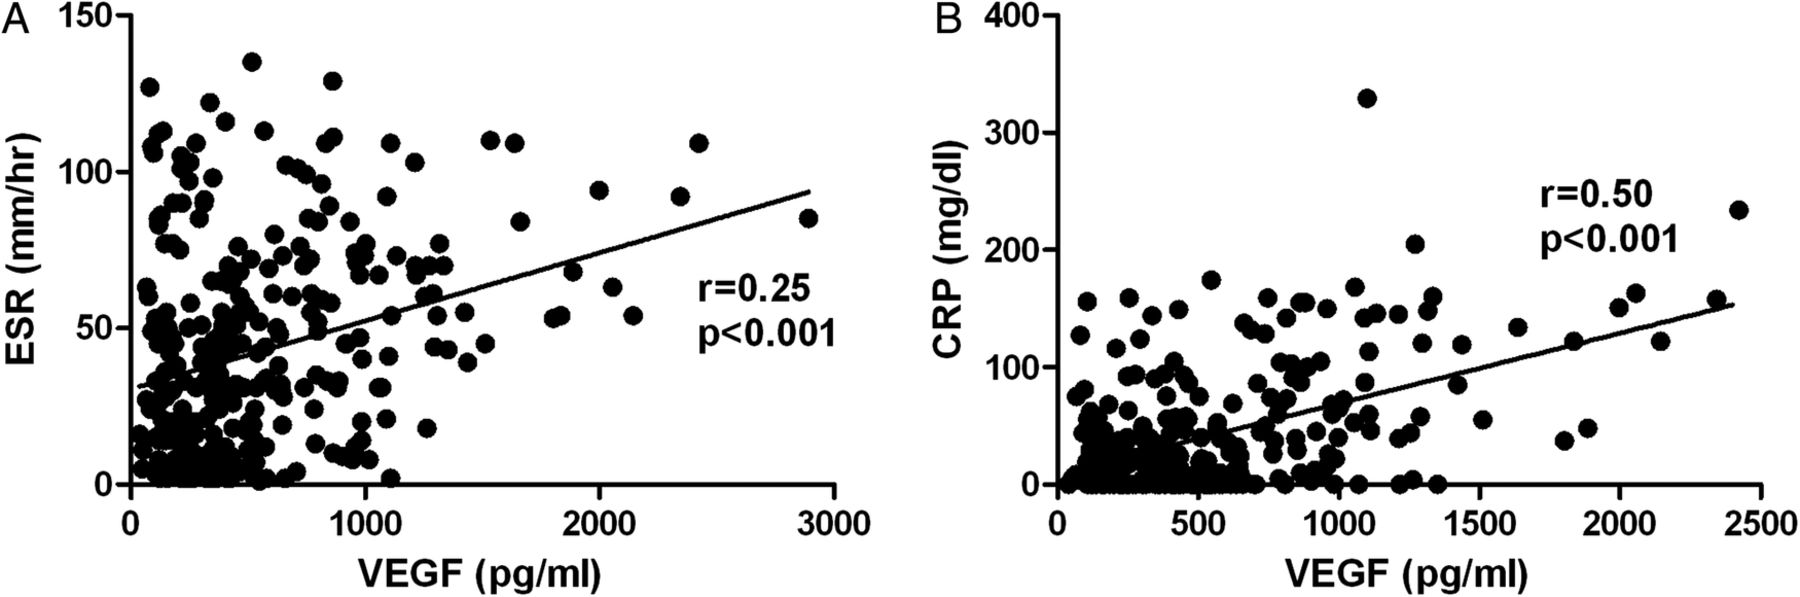
We correlated VEGF levels with traditional acute phase reactants CRP and ESR (figure 4). There was a moderate positive correlation for VEGF with CRP (r=0.50; 95% CI 0.40 to 0.58; p<0.001) and a weak positive correlation of VEGF with ESR (r=0.25; 95% CI 0.14 to 0.26; p<0.001).

Mild or moderate positive correlation between measurements of A. VEGF and ESR, B. VEGF and CRP at week 0.
When the cut-off of 713 pg/mL was used to dichotomise patient data into normal and abnormal results, the sensitivity of VEGF concentration at week 0 was 34% and specificity was 85%. When patients were subgrouped according to diagnostic method, specificity remained stable but sensitivity fell to 25% for clinical GCA diagnoses rising to 58% for biopsy-positive cases (table 1). Correlation and regression tree analysis undertaken to determine whether VEGF concentration could be useful in combination with other parameters including CRP, ESR, headache, jaw or tongue claudication and sight loss (temporary or permanent) failed to reveal any combination that improved the diagnostic performance of the test in this cohort.
VEGF concentration predicts biopsy positivity but is not useful to identify other diagnostic subgroups. Performance of VEGF expressed as sensitivity and specificity based on data dichotomised by the cut-off of 713 pg/mL, subgrouped according to method of diagnosis
It is not known whether VEGF concentration in the serum reflects local VEGF expression in the temporal artery. Therefore, we used immunohistochemistry to look for local VEGF expression in biopsy-positive cases of GCA, compared with control sections from patients who were not diagnosed with GCA. Representative images in figure 5 show that in this small group of samples, the VEGF staining in biopsy-positive GCA patients was much stronger than in controls, and was predominantly in the tunica adventitia, although some staining was seen in the media.
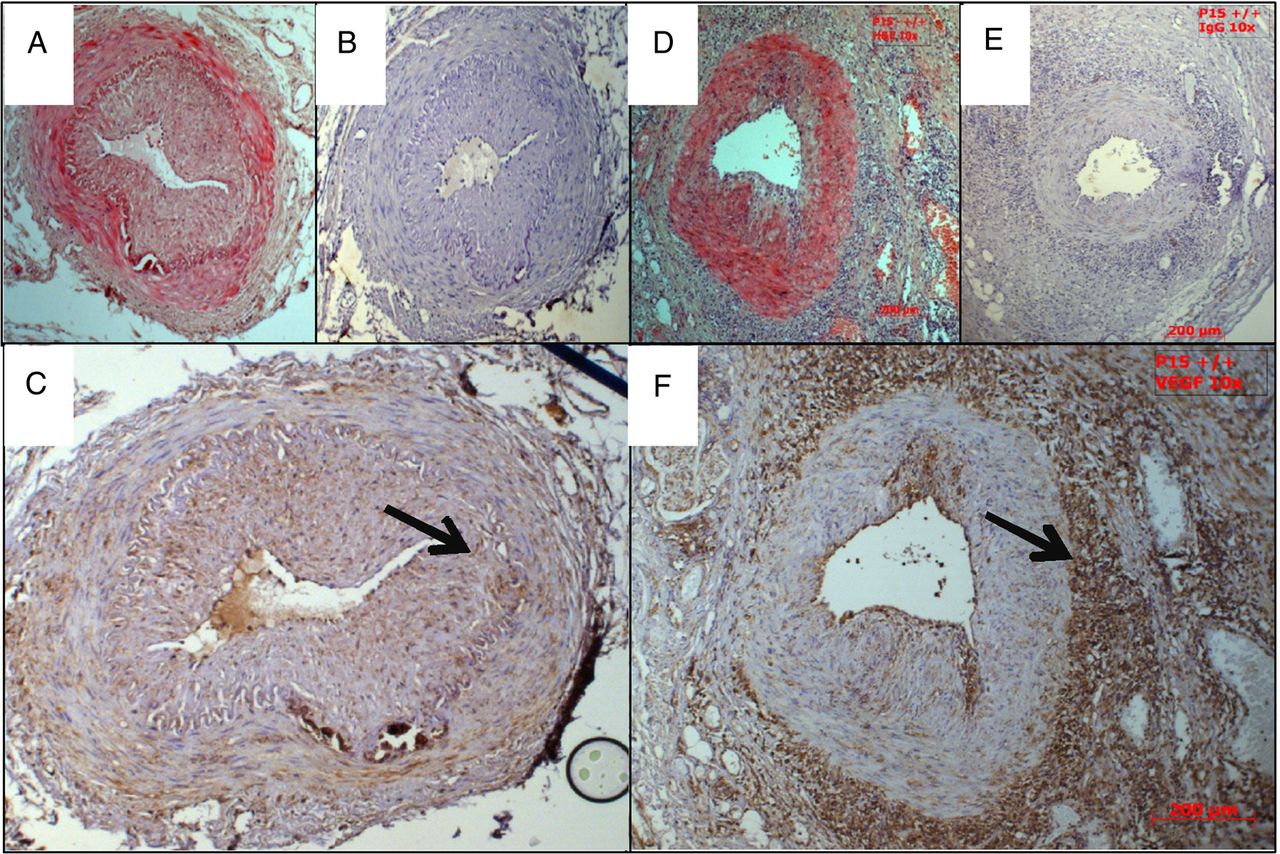
VEGF is upregulated in the arterial wall of patients with biopsy-proven GCA but not in controls. Representative images of VEGF immunohistochemistry, all taken at 10× magnification. A–C from control patient; A. H&E, B. control IgG, C. αVEGF; arrow=tunica adventitia. D–F from GCA patient; D. H&E, E. control IgG, F. αVEGF; arrow=internal elastic lamina
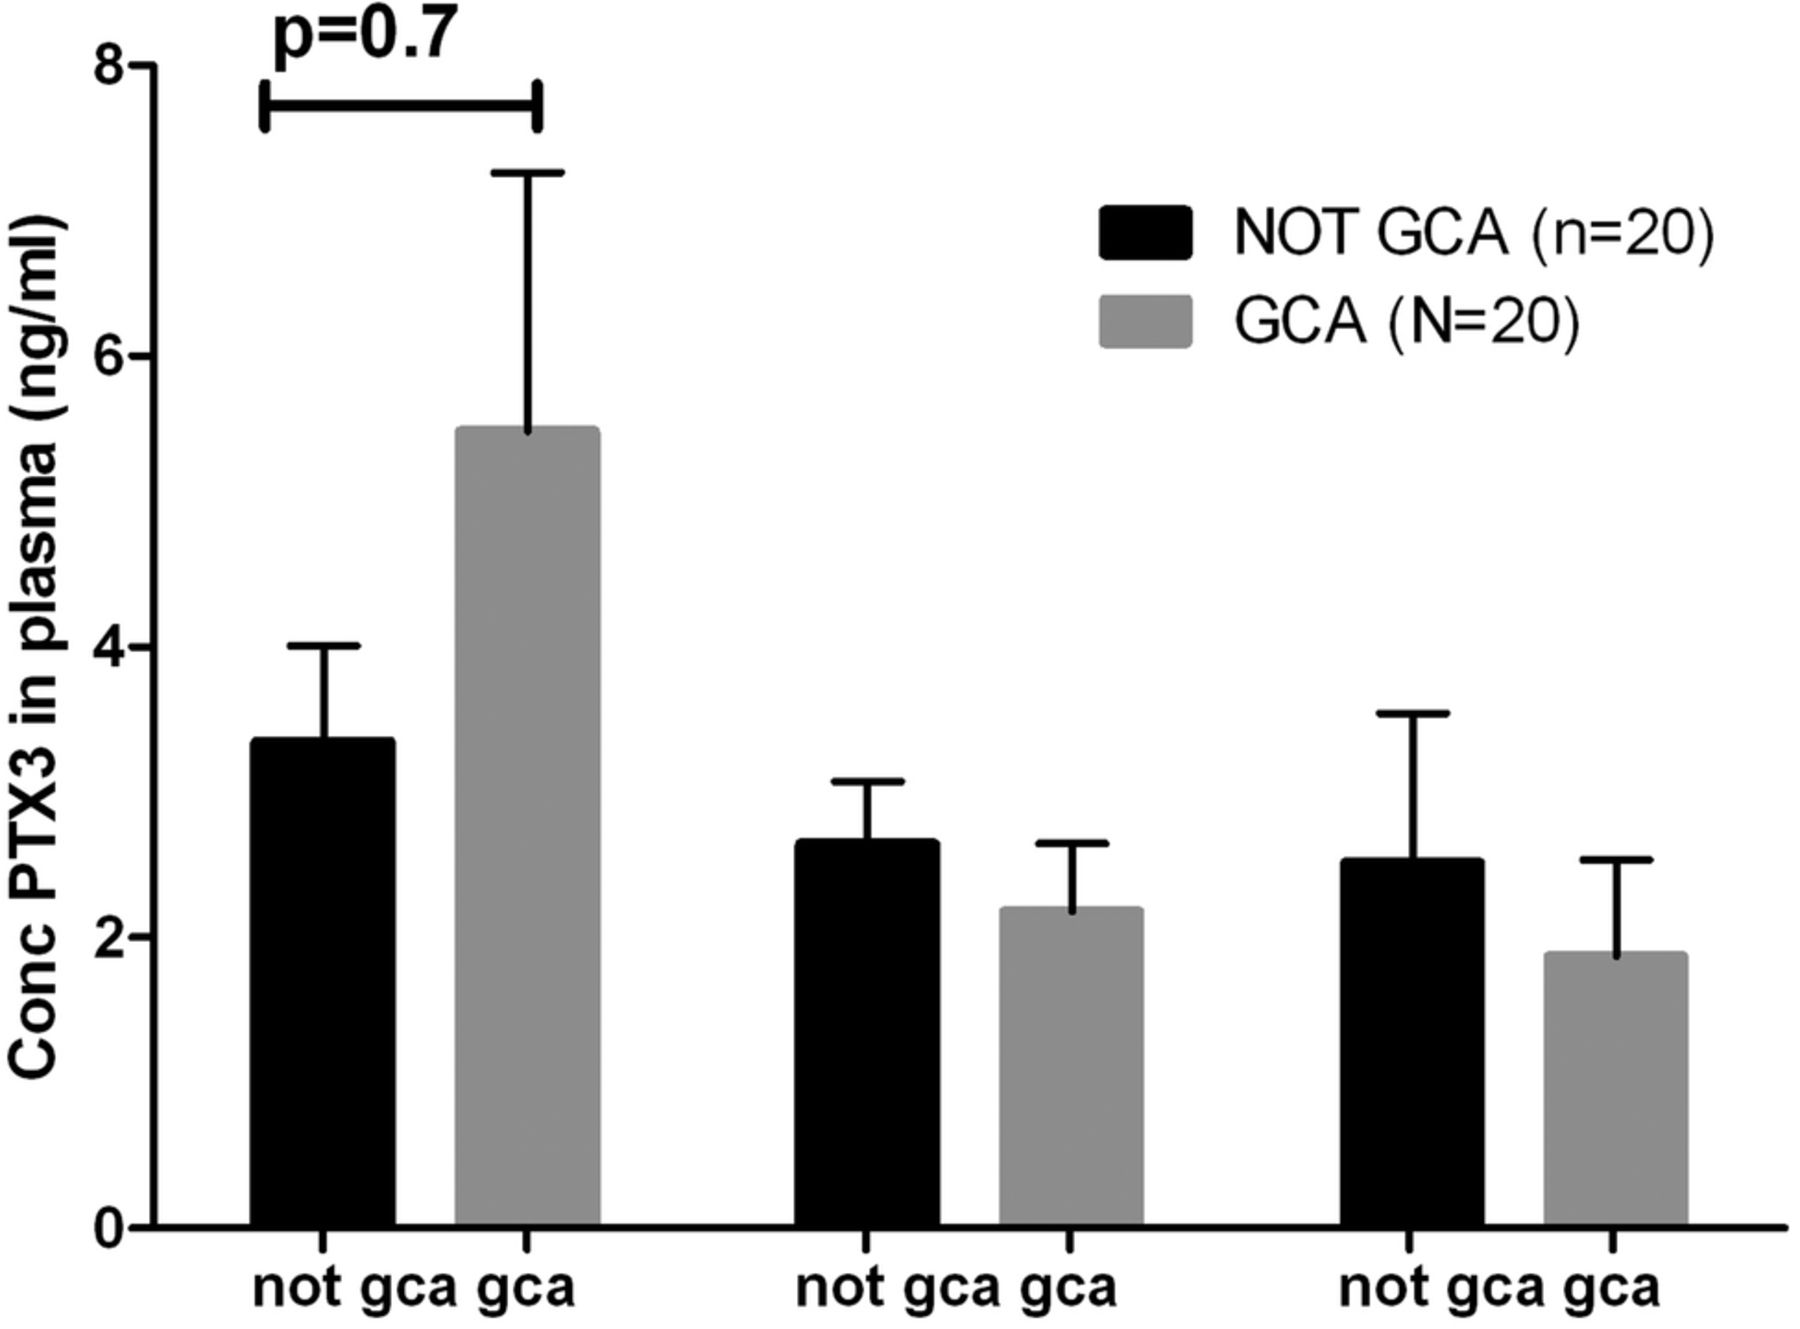
For analysis of pentraxin-3 as a diagnostic tool, we used randomly selected patients from TABUL and compared controls with biopsy-positive GCA patients, on the basis that this was the group which had a significant difference in VEGF concentration. Groups had similar proportions of women (60% in GCA group, 55% in control) but age again was slightly higher in the GCA group (75, SD 6.3) compared with the controls (69, SD 10.2, p=0.03). Plasma samples were analysed from week 0, 2 and 26. In contrast to the findings of Baldini et al, no significant difference was observed between patients with GCA and controls at any of the three time points tested (figure 6), therefore this marker was not tested in any further groups.

Pentraxin 3 concentrations in the plasma of biopsy-positive GCA patients and controls are indistinguishable at weeks 0, 2, and 26. Graph shows mean ± SEM.
Discussion
We hypothesised that VEGF might be a diagnostic marker in GCA, but the evidence from the current study was not conclusive evidence, although we have been able to demonstrate a strong association between biopsy-positive GCA and elevated serum levels of VEGF. Serum concentration of VEGF at first presentation of patients with suspected GCA has some predictive power for a positive temporal artery biopsy. However, it does not have good diagnostic performance in separating all cases of GCA, regardless of diagnostic method, from controls. There are several potential explanations for this discrepancy. It may be that a positive temporal artery biopsy reflects a more vigorous inflammatory process with increased local and systemic expression of factors including VEGF; therefore, a higher likelihood of measuring an abnormal VEGF concentration in the peripheral blood. Indeed, patients with a positive biopsy are more likely to have raised inflammatory markers, and more likely to develop visual complications.22 ,23 Alternatively, it may be that patients with a positive temporal artery biopsy have a more robust diagnosis, therefore are more likely to have a high inflammatory response including high VEGF concentrations.
Patients contributing to this study had been receiving glucocorticoids for up to 7 days at the point of blood collection. Twenty-three per cent controls and 22% GCA patients had not received any glucocorticoids at baseline and the remainder had received at least one dose. The duration of glucocorticoid exposure did not appear to affect VEGF concentrations in this study. However, it is possible that VEGF measurements may be more diagnostically accurate if taken prior to any glucocorticoid treatment. For most patients, this would involve testing blood samples taken at their general practitioners at the point of initial presentation. This may be a worthwhile future study.
One limitation of this study is the potential instability of VEGF after freeze–thawing. All samples used had one freeze–thaw cycle: they were frozen at acquisition then defrosted only when used in this study. One paper has compared samples from four patients which were either analysed fresh or after various cycles of freeze–thawing, and found that even after one cycle, the degradation in serum signal was on average 67% (range 30–90%).24 However, three other studies have failed to observe any difference in serum VEGF after freeze–thawing up to 10 times in 30 patients,25 20 patients26 and 9 patients,27 respectively. Therefore, it is not clear whether the VEGF measured in serum stored at −80°C is an accurate reflection of VEGF concentration at the time of sampling.
We selected controls for the study on the basis that they were presenting with a suspected diagnosis of GCA, but on further investigation, they did not have the condition. A significant limitation to the study is the absence of samples from other diseases including infection, malignancy and other inflammatory conditions. Further work could examine the comparative levels across these diseases; we speculate that the potential lack of difference between VEGF levels among different inflammatory conditions might make it difficult to use as a true diagnostic marker.
There is debate over the choice of plasma or serum for the measurement of VEGF concentration. VEGF is released from platelets on clotting28 and it has been argued that this would make plasma the sample of choice for measuring extracellular VEGF.29 This is a potential limitation given our choice of serum for its measurement. However, it is not clear whether intracellular or extracellular VEGF is more important in the inflammatory process in GCA. It remains unclear what contribution clotting would have had on the levels of VEGF measured or whether this effect was different between patients and controls. Furthermore, it was not feasible to measure the VEGF concentration in plasma as this was collected in far fewer patients in the parent TABUL study and therefore would have significantly reduced the power of this study. However, we would suggest that further studies are warranted comparing VEGF levels in serum and plasma in patients with GCA and controls.
We tested pentraxin-3 in this cohort, but there was no difference between biopsy-positive GCA cases and controls. This was surprising given that Baldini et al reported a sixfold upregulation of pentraxin-3 in GCA compared with healthy controls or controls with rheumatoid arthritis.8 Concentration of pentraxin-3 in controls for this study (3.35 ng/mL) was similar to Baldini et al (3.97 ng/mL) but concentration in GCA patients (5.48 ng/mL) was significantly lower than in Baldini et al (23.3 ng/mL). This suggests that the groups of GCA patients in the two studies are different. Baldini et al studied patients with established GCA for between 0.25 and 125 months, whereas TABUL studied an inception cohort of new diagnoses. However, if pentraxin-3 levels increase over time then there ought to have been an increase over the 6 months of sample collection in TABUL, which was not seen. Samples for this study underwent one freeze–thaw cycle, but Baldini et al do not comment on whether their samples were analysed fresh or after freeze–thaw. However, there is evidence that freeze–thawing does not affect measurement of pentraxin-3,30 so this is probably not the cause of the discrepancy. It would be informative to study a third population to confirm whether there is or is not an upregulation in pentraxin-3 measurements in patients with GCA.
A challenge in managing GCA is accurate recognition or prediction of relapse. Despite early treatment with high-dose glucocorticoids, 34–79% relapse.31–34 We cannot predict which patients are likely to relapse; identification of relapse is complicated by presentation with non-specific symptoms coupled with normal laboratory tests in up to 20%.32 It is possible that VEGF may be a useful marker for the identification of relapsing patients, and this should be tested in future studies.
We report raised tissue expression and systemic concentration of VEGF, related to positive temporal artery biopsy, which in turn predicts more severe disease. VEGF may be part of a useful healing response to the vascular inflammation and injury, alternatively it may be driving the inflammatory process. If the latter is the case, then it provides a more specific therapeutic target in comparison to the current standard of care. There is an established role for anti-VEGF therapy in other diseases including neovascularising ophthalmological conditions (such as macular degeneration, proliferative diabetic retinopathy, retinal vein occlusion35–37) and cancers including colorectal, breast, ovarian and cervical.38 Therefore, a number of agents are available which have already been approved for use in humans, providing possible novel therapeutic options in GCA. Further studies should focus on delineating the role of VEGF in GCA to explore its usefulness as a prognostic and therapeutic target.
In conclusion, we report that serum levels of VEGF, a molecule with a potential role in the pathogenesis of GCA, are elevated in patients with newly diagnosed GCA, but its performance as diagnostic marker is currently unclear and should be further investigated.
Acknowledgments
The following individuals contributed to domains of TABUL. Statistics: Ellen Lee, Amanda Loban, Christopher Ellis, Mike Gillett, Mike Bradburn; Ultrasound training and expert review: Wolfgang Schmidt, Bhaskar Dasgupta, Andreas Diamantopoulos, Eugene McNally, Jennifer Piper; Data management: Wulf Forrester-Barker; Primary Care expertise: Willie Hamilton; Design and conduct: Brendan McDonald, Colin Pease, John Salmon, Allan Wailoo, Konrad Wolfe; Study coordination: Keri Fathers, Leo Marcus-Wan, Nicola Farrar, Varun Manhas, Connor Scott, Nicky Sullivan, Denise Brown, Gareth Bicknell, Karolina Kliskey, Wulf Forrester-Barker; Data entry: David Gray, Samiya Mahmood, Ann-Marie Morgan, Ifzal Ahmed; Trial Steering Committee: Michael Ehrenstein, Bleddyn Davies, Karim Raza, David Mant; Data Monitoring Committee: Lyn Williamson, Kate Gilbert, Simon Travis, Jonathan Sterne; Principal Investigators: Colin Pease, David Carruthers, Rainer Klocke, Vadivelu Saravanan, Damodar Makkuni, Ruth Geraldes, Andreas Diamantopoulos, Thomas Neumann, Adrian Pendleton, Khalid Ahmed, Richard Hull, Kuntal Chakravarty, Peter Lanyon, Antoni Chan, Nicholas Raj, Frances Borg, Eamonn Molloy, Malgorzata Magliano, David Wright.
References
Footnotes
Collaborators TABUL Investigators; Ellen Lee; Amanda Loban; Christopher Ellis; Mike Gillett; Mike Bradburn; Wolfgang Schmidt; Bhaskar Dasgupta; Andreas Diamantopoulos; Eugene McNally; Jennifer Piper; Wulf Forrester-Barker; Willie Hamilton; Brendan McDonald; Colin Pease; John Salmon; Allan Wailoo; Konrad Wolfe; Keri Fathers; Leo Marcus-Wan; Nicola Farrar; Varun Manhas; Connor Scott; Nicky Sullivan; Denise Brown; Gareth Bicknell; Karolina Kliskey; David Gray; Samiya Mahmood; Ann-Marie Morgan; Ifzal Ahmed; Michael Ehrenstein; Bleddyn Davies; Karim Raza; David Mant; Lyn Williamson; Kate Gilbert; Simon Travis; Jonathan Sterne; Colin Pease; David Carruthers; Rainer Klocke; Vadivelu Saravanan; Damodar Makkuni; Ruth Geraldes; Andreas Diamantopoulos; Thomas Neumann; Adrian Pendleton; Khalid Ahmed; Richard Hull; Kuntal Chakravarty; Peter Lanyon; Antoni Chan; Nicholas Raj; Frances Borg; Eamonn Molloy; Malgorzata Magliano; David Wright.
Contributors NG designed, executed and analysed the ELISA work and prepared the manuscript. JM conducted pilot experiment upon which the work is based and executed the immunohistochemistry with AZ. SS was the trial coordinator for the parent TABUL study. AS supervised JM and provided scientific design and expertise, and edited the manuscript. AH was the statistician for parent TABUL study, also helped with statistics for this study. VS helped to coordinate sample collection and storage. JV took over from SS as TABUL trial coordinator. SM was the research nurse for parent TABUL study, and helped coordinate sample collection and storage. AZ helped JM with immunohistochemistry. RL was the principal investigator for TABUL, was supervisor for NG, and was involved in design of work and editing of manuscript.
Funding This work was supported by the HTA (grant number 08/64/01 to RL), the Oxfordshire Health Research Services Committee (grant number 1175 to NG) and the NIHR (Academic Clinical Fellowship to NG).
Competing interests None declared.
Ethics approval Ethics approval was obtained from Berkshire Research Ethics Committee (09/H0505/132).
Provenance and peer review Not commissioned; externally peer reviewed.
Data sharing statement No additional data are available.