Article Text

Abstract
Introduction Interleukin-6 (IL-6) orchestrates formation of an inflammatory pannus, leading to joint damage in rheumatoid arthritis (RA). Sarilumab is a human monoclonal antibody blocking the IL-6Rα. In TARGET (NCT01709578), a phase 3 study in adults with moderate-to-severe RA and inadequate response or intolerance to tumour necrosis factor inhibitors, subcutaneous sarilumab 200 mg or 150 mg every 2 weeks (q2w) plus conventional synthetic disease-modifying antirheumatic drugs (csDMARDs) significantly reduced disease activity versus placebo plus csDMARDs.
Methods Circulating levels of biomarkers associated with synovial inflammation (matrix metalloproteinase 3 (MMP-3), collagen type I MMP-cleaved fragment (C1M), collagen type III MMP-cleaved fragment (C3M)), myeloid (soluble intercellular adhesion molecule 1 (sICAM-1), IL-8 and calprotectin) and lymphoid activation (chemokine, CXC motif, ligand 13 (CXCL13), CXCL10, B cell-activating factor) and bone remodelling (receptor activator of nuclear factor-κB ligand (RANKL), osteoprotegerin and osteocalcin) were evaluated in patients from a TARGET substudy.
Results Sarilumab significantly decreased C1M, C3M, CXCL13, MMP-3 and total RANKL levels at week 24 versus placebo; some markers were significantly suppressed at week 2 and normalised to levels in healthy controls. Levels of sICAM-1 were predictive of disease activity score by C-reactive protein and clinical disease activity index low disease activity (LDA) response in the sarilumab 200 mg q2w group at week 12. A trend was observed in which patients with lower sICAM-1 levels at baseline had better response compared with patients with higher sICAM-1.
Conclusions Sarilumab plus csDMARDs decreased circulating biomarkers of synovial inflammation and bone resorption; sICAM-1 was predictive of achieving LDA with sarilumab.
Trial registration number NCT01709578; Post-results.
- rheumatoid arthritis
- treatment
- dmards (biologic)
This is an Open Access article distributed in accordance with the Creative Commons Attribution Non Commercial (CC BY-NC 4.0) license, which permits others to distribute, remix, adapt, build upon this work non-commercially, and license their derivative works on different terms, provided the original work is properly cited and the use is non-commercial. See: http://creativecommons.org/licenses/by-nc/4.0/
Statistics from Altmetric.com
Key messages
What is already known about this subject?
Patients with rheumatoid arthritis (RA) have synovial inflammation, bone resorption and different synovial inflammatory cell types.
Circulating biomarkers reflective of different synovial inflammatory cell types predicted response to anti-interleukin (IL)-6R monotherapy in patients with inadequate response to methotrexate.
What does this study add?
Therapy with anti-IL-6R is able to normalise biomarkers of synovial inflammation and joint damage in patients for whom therapy with tumour necrosis factor inhibitors has failed.
Baseline levels of several biomarkers are modestly predictive of anti-IL-6R efficacy at week 24.
How might this impact on clinical practice?
Monitoring of biomarkers other than acute-phase reactants may add useful information for the management of patients with RA before initiating therapy.
Some markers may be useful in identification of patients likely to benefit from anti-IL-6R therapy but will need further validation in additional studies.
Introduction
Patients with rheumatoid arthritis (RA) develop bone and joint damage due to chronic joint inflammation. This inflammatory state is maintained by an invasive synovial pannus, which is composed of different cell types that secrete proinflammatory cytokines, such as interleukin-6 (IL-6).1 Through cytokine signalling cascades, the pannus acts in concert with resident-activated fibroblast-like synoviocytes to trigger the production of bone-resorptive factors (eg, receptor activator of nuclear factor-κB ligand (RANKL)) and the secretion of cartilage-damaging proteases (eg, matrix metalloproteinases (MMPs)), leading to bone and joint destruction (online supplementary figure).
Supplementary file 1
IL-6 is a pleiotropic cytokine that is produced by and acts on many cell types.2 It is typically present in circulation at low concentrations in healthy individuals and is upregulated during inflammation, infection and tissue damage. In RA, IL-6 is present at elevated concentrations in affected joints and serum.3–5 In preclinical studies, IL-6 was shown to mediate the production of joint inflammation proteins and subsequent bone-resorptive molecules.6–10 It was previously demonstrated that blockade of IL-6 signalling with sarilumab, a human monoclonal antibody blocking the IL-6α receptor (IL-6Rα), reduces levels of bone-resorptive and synovial inflammation markers in patients with RA and an inadequate response to methotrexate (MTX-IR).11 In that study, both doses of sarilumab tested in phase 3 (200 mg every 2 weeks (q2w) and 150 mg q2w) significantly reduced bone and joint damage assessed by X-ray at 52 weeks compared with placebo (by 91% and 76%, respectively). On the basis of these data, we hypothesised that sarilumab may also suppress bone-resorptive and synovial inflammation markers in patients who failed prior therapy with tumour necrosis factor inhibitors (TNFi).
In the phase 3 TARGET study (NCT01709578), subcutaneous administration of sarilumab 200 mg q2w, sarilumab 150 mg q2w or placebo plus background conventional synthetic disease-modifying antirheumatic drugs (csDMARDs) was evaluated in adults with active, moderate-to-severe RA and inadequate response or intolerance to ≥1 TNFi.12 Significant improvements were observed in patients receiving sarilumab 200 mg or 150 mg q2w plus csDMARDs compared with placebo plus csDMARDs in the primary endpoints of American College of Rheumatology 20% (ACR20) response rate at week 24 (P<0.001) and change from baseline in Health Assessment Questionnaire–Disability Index (HAQ-DI) at week 12 (P=0.0004).12 Similar findings were observed across other endpoints, including ACR50 and ACR70 response rates and HAQ-DI at week 24. Sarilumab also significantly reduced serum levels of the inflammatory marker C-reactive protein (CRP). The most common treatment-emergent adverse events were infections, neutropenia, injection site reactions, increased lipids and increased transaminases. Overall, safety and efficacy data from TARGET suggest that sarilumab may be an effective treatment option for patients with RA who do not respond to TNFi.
The objective of this exploratory substudy was to evaluate the pharmacodynamic effects of sarilumab treatment on circulating markers of synovial inflammation (MMP-3, collagen type I MMP-cleaved fragment (C1M), collagen type III MMP-cleaved fragment (C3M)), bone and joint damage (RANKL, osteoprotegerin (OPG), osteocalcin (OC)), as well as markers recently hypothesised to reflect lymphoid (chemokine, CXC motif, ligand 13 (CXCL13)) and myeloid synovial phenotypes (soluble intercellular adhesion molecule 1 (sICAM-1)), which differentially predict response to tocilizumab.13 The baseline concentrations of these analytes and additional markers associated with myeloid or lymphoid activation implicated in predicting response to RA biologicals (IL-8, calprotectin, B cell-activating factor (BAFF) and CXCL10)14–17 were also assessed for their ability to predict response to sarilumab treatment across a variety of disease activity measurements. The selection of these markers was based on literature reports demonstrating that the baseline levels of the markers could predict response to either anti-IL-6R or anti-TNF agents.
Methods
The phase 3 TARGET study has previously been described.12 Patients were randomised to receive sarilumab 200 mg q2w, sarilumab 150 mg q2w or placebo for 24 weeks with background csDMARDs. All patients provided written informed consent before study entry. The study was conducted in compliance with institutional review board regulations, the International Conference on Harmonisation Guidelines for Good Clinical Practice and the Declaration of Helsinki.
Sample selection and biomarker analysis
Sera samples from 291 patients from the intent-to-treat (ITT) population were analysed (placebo: n=97; sarilumab 200 mg q2w: n=97; sarilumab 150 mg q2w: n=97; biomarker population). Sera were collected at baseline (before first dose) and post-treatment through week 24 in patients treated with placebo or sarilumab (200 mg or 150 mg q2w) and stored frozen until analysis; time points for analysis of individual biomarkers are described in table 1. Patients were included in the biomarker substudy if the following criteria were met: 28-joint disease activity score by CRP (DAS28-CRP) assessment was available at baseline (before first dose) and week 24, serum samples were collected at baseline and week 24 and at least 16 weeks elapsed between randomisation visit and week 24 biomarker sample collection. Patients treated with placebo who were rescued with open-label sarilumab 200 mg q2w at week 12 were excluded from the analysis. Based on these criteria, 97 patients were included from the placebo group, and then equal numbers of patients treated in each sarilumab group were randomly selected in order to balance the sample size across treatment arms.
Baseline biomarker serum concentrations
Biomarker serum concentrations were retrospectively assessed using validated ELISAs at Bioclinica Laboratory (Lyon, France). Levels of CXCL13 and sICAM-1 were assessed at baseline and week 2 (Quantikine® ELISA kits (R&D Systems, Minneapolis, Minnesota, USA); inter-assay coefficient of variation (CV) <14% and intra-assay CV <15%) and at week 24 for CXCL13 only. Human calprotectin (myeloid-related protein (MRP) 8/14) was measured at baseline using the BioLegend® assay (San Diego, California, USA; interassay and intraassay CV <15%). Levels of IL-8, BAFF and CXCL10 were measured at baseline (Quantikine ELISA kits; interassay and intra-assay CV <12%). Levels of C1M, C3M and MMP-3 were assessed at baseline and weeks 2 and 24. RANKL (total and free) and OPG were assessed at baseline and weeks 12 and 24, and OC was assessed at baseline and week 24. Assays for these markers were described previously.11 The inflammation marker CRP was assessed during the main study using immunonephelometry (Covance, high-sensitivity CRP, Siemens BN II (Malvern, Pennsylvania, USA); CV <5%) and was used in this substudy as a positive control because the effects of sarilumab treatment on CRP reduction were previously demonstrated.12 18 19 No imputation was made for missing biomarker concentrations. Concentrations below the lower limit of quantitation (LLOQ) were replaced by LLOQ/2, and concentrations above the upper LOQ (ULOQ) were replaced by ULOQ.
Statistical methods
Pharmacodynamic analysis
To evaluate pharmacodynamic changes in circulating biomarker concentrations between treatment groups at each time point, the percent change from baseline in biomarker concentrations was analysed using non-parametric methods because of the non-normality of the distributions. For biomarkers measured once postbaseline, a rank-based analysis of covariance (ANCOVA) adjusted on baseline value was implemented. For biomarkers measured twice postbaseline, a mixed-effect model with repeated measures was performed on rank-transformed data (analysis of variance (ANOVA)-type method), with treatment, visit and treatment-by-visit interaction as fixed effects, baseline biomarker value transformed in rank, baseline biomarker value transformed in rank-by-visit interaction as fixed covariates and assuming an unstructured covariance structure. P values were adjusted for false discovery rate using the Benjamini-Hochberg procedure20 at a 5% threshold, except for CRP, which was used as a positive control, where nominal Pp values were reported.
The number of patients with abnormal biomarker levels at baseline that returned to normal levels at week 24 was compared between active groups and placebo using a χ2 test; unadjusted values are reported. Reference ranges were provided by the testing laboratory.
Assessment for changes in biomarker levels and clinical response
Clinical efficacy parameters that were analysed for association with circulating biomarkers included ACR50 and ACR70 at week 24, low disease activity (LDA) by DAS28-CRP and by clinical disease activity index (CDAI) at weeks 12 and 24 and remission by DAS28-CRP at the same visits (LDA defined as DAS28-CRP <3.2 or CDAI ≤10; remission defined as DAS28-CRP <2.6).3 CDAI remission was not analysed because of the small number of responders (data not shown). Similar non-parametric methods as previously described (rank ANCOVA or ANOVA type) were used to evaluate the association between the per cent change from baseline in biomarker concentrations at either week 2 or week 24 and ACR50 and ACR70 responders versus non-responders at week 24, as well as those achieving or not achieving DAS28-CRP LDA or remission, or achieving or not CDAI LDA. This analysis was performed in each treatment group at week 24, and unadjusted P values are reported.
Assessment of baseline biomarkers for prediction of response
Predictive effects of baseline biomarker values on efficacy endpoints were tested using a logistic regression with treatment group, region at study entry and number of previous TNFi as fixed effects, baseline biomarker (continuous covariate) and baseline biomarker-by-treatment group interaction; unadjusted p values for the interaction for each treatment group (predictive) are reported. Similar analyses were performed after categorisation of patients with high or low levels of the biomarkers at baseline (using the median value in the overall population and using the placebo group as the reference). In addition, pairwise comparisons of the response rates between each dose of sarilumab and placebo were performed separately in patients with high or low biomarkers at baseline, and the Mantel-Haenszel estimates of odds ratios (ORs), stratified by region and number of previous TNFi, and 95% CIs were derived and graphically represented using forest plots.
Assessment of combination of baseline biomarkers associated with myeloid and lymphoid activation for prediction of response
Differential combinations of circulating CXCL13 and sICAM-1 (with low or high levels defined relative to the pretreatment median levels) were assessed for prediction of response to sarilumab. For that purpose, the Mantel-Haenszel estimates of ORs were derived for each combination.
Results
Comparison between ITT and biomarker populations
Baseline demographics and disease characteristics of the biomarker population were generally similar between treatment groups and comparable with the overall ITT population. Although overall efficacy across all treatment groups was higher in the biomarker population compared with the ITT population (table 2), the difference in response between each active dose and placebo was consistent across endpoints in both populations. For instance, for ACR50, the delta between the sarilumab 150 mg q2w and placebo groups was 18.8% and 17.5% in the ITT and biomarker populations, respectively, and between sarilumab 200 mg and placebo, it was 22.6% and 22.7%, respectively. Treatment differences were similarly consistent between the ITT population and the biomarker population for other clinical response criteria (table 2). The greater efficacy observed in the biomarker population in the three treatment groups was likely due to the selection criteria for the biomarker population (ie, inclusion of patients who did not discontinue before 16 weeks after randomisation).
Patient demographics and disease characteristics at baseline and efficacy results at weeks 12 and 24
Biomarker levels at baseline
Baseline serum concentrations of most biomarkers were similar between treatment groups, except for MMP-3, CXCL13, IL-8 and CRP levels (P value of the Kruskal-Wallis test <0.05; numerically, the medians were higher in the sarilumab 200 mg q2w group; table 1). Median levels of C1M, total RANKL (tRANKL), C3M, MMP-3, IL-8, CRP and CXCL13 were higher than the reference ranges for healthy postmenopausal women.
Biomarker concentrations were also examined according to autoantibody status at baseline (all pooled groups). Notably, tRANKL concentrations were almost 10-fold higher in rheumatoid factor (RF)-positive versus RF-negative patients (median, 1610.1 vs 253.14 pmol/L; Mann-Whitney test P<0.0001) and in anticitrullinated protein autoantibody (ACPA)-positive versus ACPA-negative patients (median, 1415.6 vs 277.2 pmol/L; P<0.0001).
Pharmacodynamic effects of treatment on biomarkers
To compare the treatment effects of sarilumab 200 mg or 150 mg q2w with placebo on biomarker concentrations over time, the per cent change from baseline in biomarkers was analysed at various timepoints postdose. Week 2 was selected for analysis of inflammation markers to determine if these markers are acutely sensitive to inhibition of IL-6 signalling after the first dose of sarilumab. Weeks 12 and 24 were selected for analysis of bone remodelling markers because previous analysis of these markers demonstrated that these markers are not significantly dynamic at week 2 postsarilumab treatment in MTX-IR patients.11 Previous studies have demonstrated a robust effect of sarilumab on CRP11 12 18 19; therefore, CRP was analysed as a positive control, and robust suppression was observed after the first dose of sarilumab at week 2, which was sustained through week 24 at all study visits (figure 1A; weeks 2 and 24 only). Both doses of sarilumab significantly reduced biomarkers of synovial inflammation (C3M and MMP-3), tissue destruction and bone resorption (C1M, total and free RANKL) and a B cell chemoattractant (CXCL13) compared with placebo (figure 1B–F). Several biomarkers (CRP, C3M, C1M and CXCL13) were significantly reduced in the sarilumab-treated groups compared with placebo as early as week 2; reductions persisted at week 24 (figure 1). Significantly greater reductions in CRP, C1M and C3M were also observed in the sarilumab 200 mg q2w group compared with the 150 mg q2w group. No significant effects of sarilumab treatment were observed on free RANKL, sICAM-1, BAFF or OPG concentrations (data not shown). A numerical increase in OC, a marker of bone formation, was observed in both sarilumab-treated groups relative to placebo at week 24, but these differences were not statistically significant (placebo: 0.8%; sarilumab 200 mg: 8.0%; sarilumab 150 mg: 5.1%).

Median per cent change (error bars represent the quartile ranges Q1–Q3) from baseline in biomarkers of (A) acute-phase response (CRP), (B and C) synovial inflammation (C3M and MMP-3), (D) tissue destruction (C1M), (E) bone resorption (tRANKL) and (F) lymphoid RA synovial phenotype (CXCL13). ANOVA-type method was implemented. *Adjusted P<0.05 versus placebo; **adjusted P<0.01 versus placebo; †adjusted P<0.01 versus sarilumab 150 mg q2w (Benjamini-Hochberg procedure); ‡nominal P<0.0001 versus placebo (CRP only); §nominal P<0.0001 versus sarilumab 150 mg q2w (CRP only). ANOVA, analysis of variance; C1M, collagen type I MMP-cleaved fragment; C3M, collagen type III MMP-cleaved fragment; CRP, C-reactive protein; csDMARD, conventional synthetic disease-modifying antirheumatic drug; CXCL13, chemokine, CXC motif, ligand 13; MMP, matrix metalloproteinase; q2w, every 2 weeks; RA, rheumatoid arthritis; tRANKL, total receptor activator of nuclear factor-κB ligand.
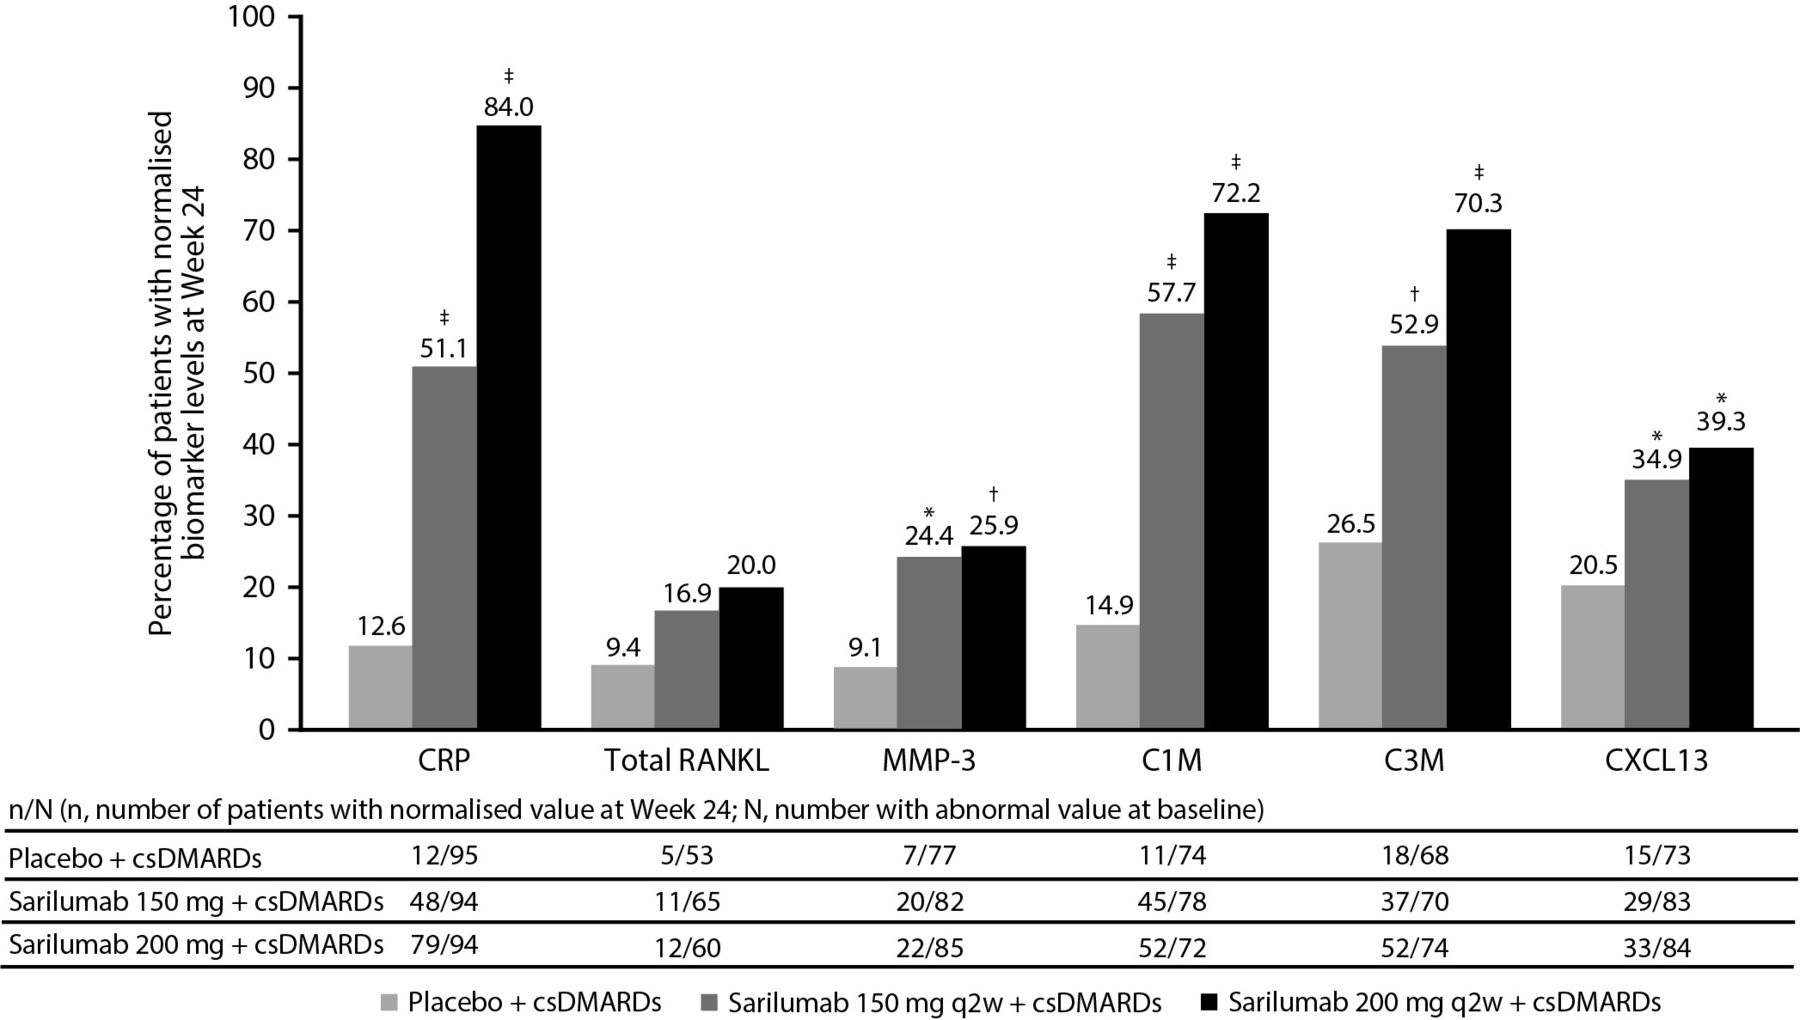
A small subset of patients in each treatment group had baseline biomarker levels that were outside the reference range relative to sex-matched healthy controls. Normalisation of biomarker levels to the healthy reference range was examined post-treatment at week 24 for individuals with baseline values outside the reference range. Both doses of sarilumab resulted in significantly greater normalisation of C1M, C3M, MMP-3, CXCL13 and CRP versus placebo (figure 2).

Percentage of patients in each treatment group whose biomarker values returned to normal reference ranges at week 24. C1M, collagen type I MMP-cleaved fragment; C3M, collagen type III MMP-cleaved fragment; CRP, C reactive protein; csDMARD, conventional synthetic disease-modifying antirheumatic drug; CXCL13, chemokine, CXC motif, ligand 13; MMP, matrix metalloproteinase; q2w, every 2 weeks; RANKL, receptor activator of nuclear factor-κB ligand. *P<0.05 versus placebo; †P<0.01 versus placebo; ‡P<0.0001 versus placebo (χ2 test, unadjusted P values).
Relationship between changes in biomarker levels and clinical response
To determine if the magnitude of biomarker changes post-treatment was associated with differences in efficacy, changes in markers at week 24 post-treatment were compared between responders and non-responders (assessed by ACR50, ACR70 and LDA by DAS28-CRP and CDAI, and remission by DAS28-CRP). At week 24, patients treated with sarilumab 150 mg q2w who achieved ACR50 response or DAS28-CRP LDA had significantly greater reductions in MMP-3 and increases in OC than patients who did not achieve response. Although the differences in OC were modest, the numerical trend was consistent between both sarilumab dose groups (table 3). Modest differences in CRP were observed in ACR50 and ACR70 responders versus non-responders in the sarilumab 200 mg q2w group only. Significant differences in CRP were noted as early as week 2 between patients who did or did not achieve DAS28-CRP LDA (data not shown), but this difference was nominal by week 24 (table 3). Other biomarkers suppressed by sarilumab did not significantly differ in patients who achieved a response compared with those who did not. Changes in biomarkers were not significantly different between patients who did and did not achieve CDAI LDA (table 3) and DAS28-CRP remission (data not shown).
Median per cent change from baseline in biomarker concentrations at week 24 in ACR50, ACR70, DAS28-CRP and CDAI LDA responder/non-responder patients
Predictive analysis of baseline biomarker levels and clinical response
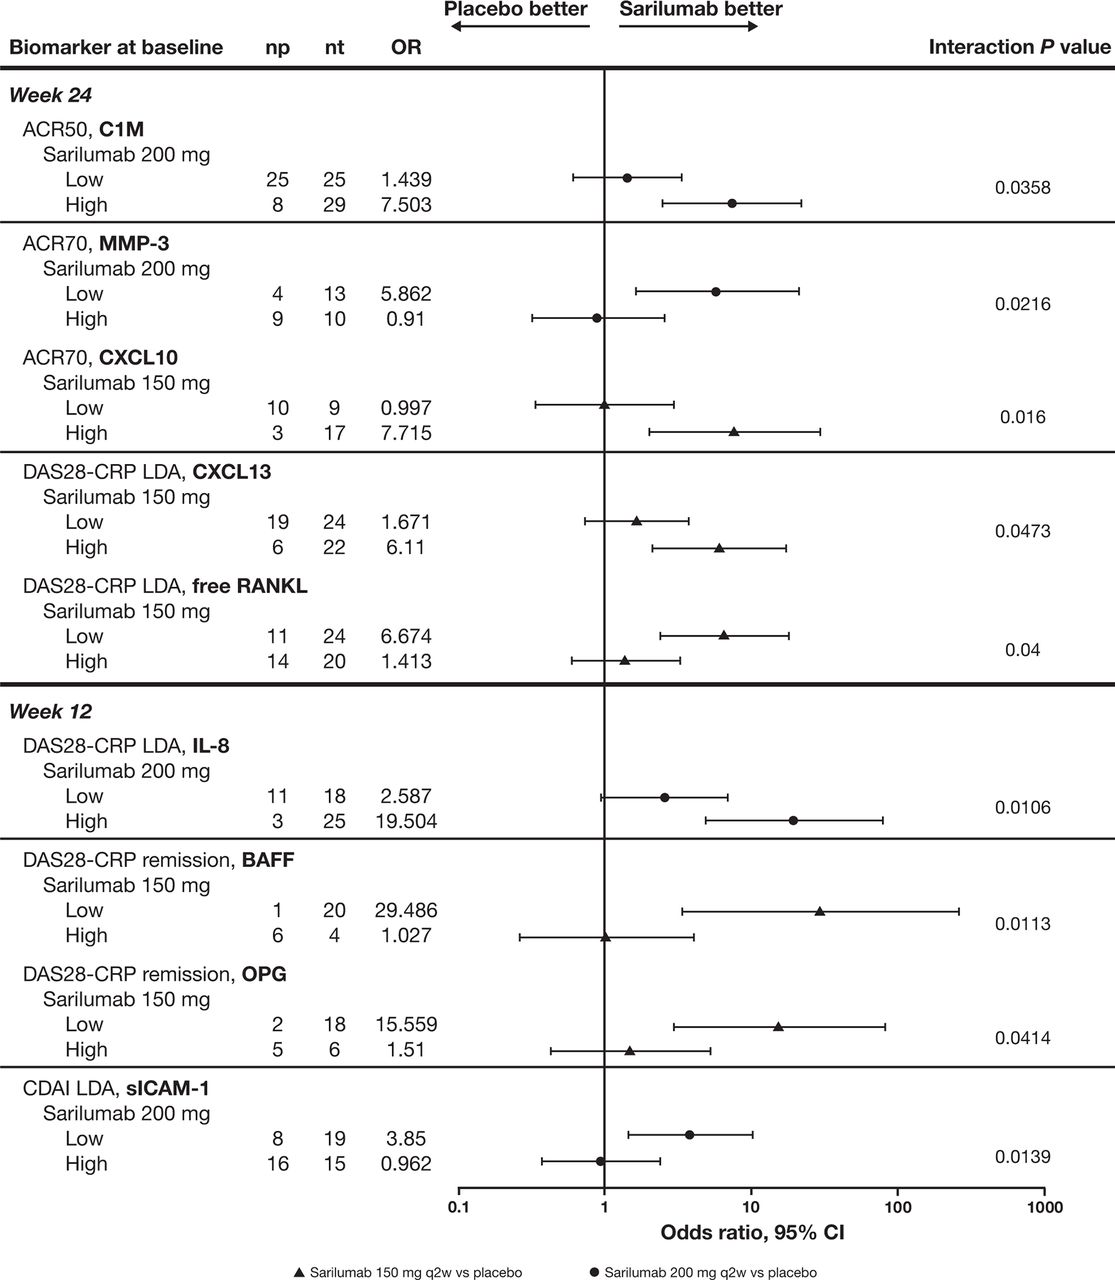
The utility of baseline biomarker concentrations in predicting clinical response to sarilumab was examined by analysing the biomarkers as continuous or binary measures (ie, greater than or less than median values in the overall biomarker population). Levels of sICAM-1 were predictive of DAS28-CRP and CDAI LDA response in the sarilumab 200 mg q2w group at week 12 only (interaction P values were 0.0332 and 0.0346, respectively). Median sICAM-1 levels at baseline were ~20 ng/mL lower for responders compared with non-responders. To illustrate these results, ORs between active treatment groups and placebo were computed separately for patients with high and low biomarker levels at baseline. A trend was observed in that patients with baseline sICAM-1 levels below the median had a better response to sarilumab: for DAS28-CRP LDA, the OR (95% CI) versus placebo was 11.377 (3.583 to 36.131) in patients with sICAM-1 <291 ng/mL versus 3.879 (1.436 to 10.480) in patients with higher sICAM-1 (interaction P value was not significant). For CDAI LDA, the OR (95% CI) was 3.850 (1.433 to 10.347) in patients with low sICAM-1 compared with 0.962 (0.381 to 2.433) in patients with higher sICAM-1 (interaction P=0.0139; figure 3).

Odds ratios for achieving ACR50 response, ACR70 response, DAS28-CRP LDA, DAS28-CRP remission and CDAI LDA at weeks 12 and 24. High, >median value in overall treatment groups; low, ≤median value in overall treatment groups. Median concentrations of biomarkers are 83.42 ng/mL (C1M), 49.70 ng/mL (MMP-3), 301.84 pg/mL (CXCL10), 19.90 pg/mL (IL-8), 132.33 pg/mL (CXCL13), 0.14 pmol/L (free RANKL), 1071.90 pg/mL (BAFF), 5.47 pmol/L (OPG) and 291.0 ng/mL (sICAM-1). ACR50/70, American College of Rheumatology 50%/70% improvement; BAFF, B cell-activating factor; CDAI, clinical disease activity index; C1M, collagen type I MMP-cleaved fragment; CXCL, chemokine, CXC motif, ligand; CDAI, clinical disease activity index; CRP, C-reactive protein; DAS28-CRP, 28-joint disease activity by CRP; LDA, low disease activity; MMP-3, matrix metalloproteinase 3; np, number of responders with placebo treatment; nt, number of responders with sarilumab treatment; OPG, osteoprotegerin; RANKL, receptor activator of nuclear factor-κB ligand; sICAM-1, soluble intercellular adhesion molecule 1.
In addition, we explored whether baseline seropositive status influenced response prediction. Inclusion of RF and ACPA as covariates in the predictive model did not significantly impact any of the results (data not shown). Therefore, these covariates were not included in any of the analyses presented.
Significant interactions between baseline biomarkers and treatment were observed for several markers analysed as dichotomous variables (high/low based on median concentrations; figure 3). Patients with higher C1M concentrations were more likely to achieve an ACR50 response after sarilumab 200 mg q2w treatment (OR (95% CI), 7.503 (2.505 to 22.473)) versus placebo (P<0.0001); in patients with low baseline C1M, the OR was no longer significant. Sarilumab-treated patients with either low MMP-3 or high CXCL10 relative to the median concentrations were more likely than placebo-treated patients to achieve an ACR70 response (figure 3). Sarilumab-treated patients with low CXCL13 and low free RANKL were more likely to achieve DAS28-CRP LDA at week 24. Other biomarkers did not consistently predict response to both doses of sarilumab across all endpoints and visits (online supplementary table).
Evaluation of differential combinations of markers associated with myeloid and lymphoid activation for prediction of clinical response
Prior studies evaluating response to TNFi biologicals or anti-IL-6R have examined the relationship between baseline blood or synovial gene signatures to predict adequate or inadequate clinical response. Patients with better ACR50 response to anti-IL-6R compared with TNFi had higher baseline lymphoid synovial gene signatures relative to myeloid signatures,13 which could be reflected by higher baseline CXCL13 and lower sICAM-1 ratio. We therefore examined whether the differential combinations of circulating CXCL13 and sICAM-1 would predict response to sarilumab. Patients with low or high levels of CXCL13 and sICAM-1 relative to the median levels were analysed according to ACR50 and ACR70 response, DAS28-CRP LDA and remission, and CDAI LDA at week 24. The prediction of the combinations of CXCL13 and sICAM-1 was assessed by comparing patients with low, high or different levels of each biomarker (low/high). None of the combinations assessed were predictive of any clinical response to either sarilumab 200 mg q2w or 150 mg q2w (ORs and 95% CIs not shown).
Discussion
Real-world data suggest that patients with RA and an inadequate response or intolerance to TNFi represent a patient population who can be effectively managed after switching to a drug with a novel mechanism of action, including an IL-6R inhibitor.21 Data from the TARGET study demonstrate that sarilumab can effectively reduce disease activity, pain and disability measurements in patients who have failed therapy with a prior TNFi.12 One objective of this biomarker substudy was to evaluate biomarkers associated with synovial inflammation and joint damage to assess the impact of IL-6 inhibition in patients with prior inadequate response or intolerance to TNFi. Another goal of this substudy was to determine if biomarkers associated with RA disease activity can predict which patients will respond to sarilumab after prior inadequate response or intolerance to TNFi.
Sarilumab significantly reduced biomarkers of bone resorption (RANKL) and joint damage (C1M, C3M and MMP-3), as well as a marker of lymphoid RA synovial phenotype (CXCL13), relative to treatment with csDMARD alone. These pharmacodynamic effects were consistent across both doses of sarilumab and with previously published data in MTX-IR patients18 in terms of kinetics and magnitude of changes relative to placebo. In prior studies, patients with RA and an inadequate response to TNFi (TNF-IR), IL-6R signalling blockade with tocilizumab reduced levels of MMP-3 and C1M C-telopeptide 1.22 The magnitude of sarilumab suppression of MMP-3 at week 24 was consistent with the effect of tocilizumab at week 16; earlier time points were not evaluated in our study to assess the kinetics.22 MMP-cleaved epitopes are significantly reduced by week 2 after treatment with sarilumab, suggesting that MMPs other than MMP-3 may be involved in the generation of C1M and C3M epitopes.
There is limited information about RANKL suppression by biologicals in TNF-IR patients. In MTX-IR patients, B cell targeting by rituximab decreased both serum and synovial levels of RANKL by week 16.23 Etanercept alone or in combination with MTX or prednisolone decreased RANKL at 6 months but not at 3 months.24 Sarilumab in combination with csDMARDs significantly suppressed RANKL concentrations by week 12, and this effect was sustained through the end of study at week 24. In prior analyses of MTX-IR patients, changes in RANKL were not observed at week 2, suggesting that the inhibition of bone resorption may temporally follow resolution of inflammation.11 Inhibition of RANKL in patients with RA is associated with decreases in erosion scores, although the current study did not evaluate radiographic damage.25
Although thresholds of minimal clinical improvements in disease values are noted for several RA disease parameters, no such thresholds have been identified for biomarker concentrations in patients with RA. Therefore, we performed an exploratory analysis to determine whether sarilumab treatment can normalise biomarker concentrations to ranges historically observed in healthy, sex-matched controls. One limitation of this analysis is that age-matched controls were not available for direct comparison. Both doses of sarilumab resulted in significant normalisation of biomarkers in more patients compared with placebo.
Beyond demonstrating mechanism of action, biomarkers that are able to predict patient response before initiation of therapy would be very valuable to treat in a manner consistent with treat-to-target guidelines. In this study, univariate analysis identified several biomarkers that individually predicted response to sarilumab. Although the results were not uniformly statistically significant across both doses of sarilumab, there was a consistent trend in both treatment groups. Reasons for the variability among biomarkers in predicting response may be answered by additional analyses of the relationship between drug exposure and efficacy, or inclusion of larger sample sizes to better power the analyses. In addition, the duration of response between weeks 12 and 24 may account for some of the differences observed. The univariate predictors identified in this study will need to be replicated in other larger cohorts to further evaluate clinical utility. Additional analysis combining biomarkers in multivariate analysis or an unbiased profiling approach of circulating proteins may enable a more consistent and robust response prediction at baseline. Additional evaluation of synovial fluid markers as opposed to measurement of circulating markers may provide better prediction of response. Prediction of joint damage is another important aspect to consider in studies that include radiographic or MRI measurements for erosion and joint space narrowing.
Dennis et al examined predictors of response to anti-IL-6R monotherapy and found that patients with high lymphoid activity (measured by CXCL13) at baseline are more likely to respond compared with patients with higher myeloid activity (measured by sICAM-1).13 This monotherapy study in MTX-IR patients also differentially predicted response to TNFi monotherapy, suggesting that the patients who benefit from these two different mechanisms of action are different at baseline. We were unable to extend these findings to patients with prior inadequate response to TNFi. One possible explanation is that prior exposure to TNFi could affect the baseline myeloid and lymphoid markers relative to the levels in MTX-IR patients. To test this, CXCL13 and sICAM-1 were also measured in samples from a substudy of the MOBILITY study in MTX-IR patients.18 Median sICAM-1 and CXCL13 concentrations were 280 ng/mL and 140 pg/mL, respectively, in MTX-IR patients (unpublished observations), which are similar to the levels noted in this study in table 1. Our data suggest that higher lymphoid relative to myeloid activity at baseline did not impact response to sarilumab in TNF-IR patients. Future evaluations of the predictive value of CXCL13 and sICAM-1 in larger studies that include sarilumab monotherapy in MTX-IR patients may be better suited to replicate the initial findings from the ADACTA study.
In summary, sarilumab plus csDMARDs significantly decreased circulating biomarkers of synovial inflammation and bone resorption, including C1M, C3M, CXCL13, MMP-3 and tRANKL levels. Lower levels of sICAM-1 at baseline were predictive of improved DAS28-CRP remission scores and CDAI LDA response to sarilumab.
Acknowledgments
The authors would like to acknowledge the contribution of Xin Zhang, Sanofi Genzyme, for statistical programing; all TARGET investigators and patients; Julie Frisolone, PharmD, Regeneron Pharmaceuticals, Inc, for publication management; and Jennifer Hamilton, PhD, Regeneron Pharmaceuticals, Inc, for critical review of the manuscript. Editorial support was provided under the direction of the authors by MedThink SciCom and funded by Sanofi Genzyme and Regeneron Pharmaceuticals, Inc.
References
Footnotes
Contributors AB, JM and CG contributed to the design of the study; JM and AB contributed to data acquisition; and all authors contributed to data analysis and interpretation. AB, JM, MZ and CG contributed to drafting the manuscript, and all authors were involved in revising it critically for important intellectual content. All authors approved the final version to be published.
Funding This study was sponsored by Sanofi Genzyme and Regeneron Pharmaceuticals, Inc.
Competing interests CG has received consulting fees from Roche, Merck, AbbVie, Pfizer, Bristol-Myers Squibb, Sanofi and AB2 Bio. JM, MZ and CP are employees of Sanofi R&D and may hold stock and/or stock options in the company. YL is an employee of Sanofi Genzyme and may hold stock and/or stock options in the company. NMHG and AB are employees of Regeneron Pharmaceuticals, Inc, and may hold stock and/or stock options in the company.
Patient consent Not required.
Ethics approval The protocol was approved by the appropriate ethics committees/institutional review boards.
Provenance and peer review Not commissioned; externally peer reviewed.
Data sharing statement No additional data are available.