Article Text

Abstract
Objective: To develop a composite score for measurement of disease activity in polymyalgia rheumatica (PMR) and assess its internal and external validity.
Methods: A PMR activity score (AS) was designed and assessed for internal and external validity in two patient cohorts: 57 international patients evaluated primarily for development of the PMR-AS at baseline, weeks 4 and 24; and for validation, 24 Austrian patients assessed at baseline, week 4, and at a mean (SD) point of week 33.6 (24.5). The PMR-AS was calculated as: CRP (mg/dl)+VAS p (0–10)+VAS ph (0–10)+(MST (min)×0.1)+EUL (3–0); Cronbach’s α was calculated. Factor analysis by linear regression was applied, and responses calculated on the basis of the PMR response criteria and the PMR-AS applied. PMR-AS values at different times were compared by paired t tests.
Results: Cronbach’s α for the composite score was 0.91 and 0.88 in the two cohorts. Factor analysis showed that each single item contributed significantly to the total score and the relative weight of each item in both cohorts was equally distributed. Mean PMR-AS at baseline was 27.54 and 28.72, respectively, at week 4, 5.99 and 8.99, and at the final visit 5.35 and 5.92 (NS). PMR-AS values at baseline and at later visits were significantly different (p<0.0001). PMR-AS values <7 indicated low disease activity, 7–17 medium disease activity, and >17 high PMR activity. In a third control cohort the PMR-AS correlated highly with patient’s global assessment, patient satisfaction, and ESR (p<0.001).
Conclusion: The PMR-AS provides an easily applicable and valid tool for monitoring disease activity, and in combination with the PMR response criteria provides a better description of response.
- ACR, American College of Rheumatology
- CRP, C reactive protein
- DAS28, 28 joint disease activity score
- ESR, erythrocyte sedimentation rate
- EUL, elevation of the upper limbs
- MST, morning stiffness
- PMR, polymyalgia rheumatica
- PMR-AS, polymyalgia rheumatica activity score
- RA, rheumatoid arthritis
- SDAI, simplified disease activity index
- VAS p, visual analogue scale for pain
- VAS ph, visual analogue scale for physician’s assessment
- polymyalgia rheumatica
- disease activity assessment
Statistics from Altmetric.com
- ACR, American College of Rheumatology
- CRP, C reactive protein
- DAS28, 28 joint disease activity score
- ESR, erythrocyte sedimentation rate
- EUL, elevation of the upper limbs
- MST, morning stiffness
- PMR, polymyalgia rheumatica
- PMR-AS, polymyalgia rheumatica activity score
- RA, rheumatoid arthritis
- SDAI, simplified disease activity index
- VAS p, visual analogue scale for pain
- VAS ph, visual analogue scale for physician’s assessment
Polymyalgia rheumatica (PMR) is a common rheumatic disorder in the elderly population, often underestimated, affecting from 0.1 to 0.5% of over 50 year olds. However, it may also occur in younger people, but the incidence is lower.1–,3 Diagnosis is based upon a clinical syndrome, consisting of pain and stiffness in the shoulder and pelvic girdle, muscle tenderness of the arms and legs, non-specific somatic complaints, frequently occurring fever, weight loss, and fatigue. The acute phase response measured by erythrocyte sedimentation rate (ESR) and C reactive protein (CRP) is frequently greatly increased.1 However, PMR may also exist with a low ESR and CRP. Whether a low acute phase response indicates lesser severity and better prognosis is not yet confirmed.5,6 Up to now four proposals for diagnostic criteria have been published and recently evaluated for their validity (paper in preparation).7–,11 Monitoring and recording disease activity in daily practice needs to be easy to perform and not time consuming. Moreover, it should provide the physician with enough information to enable decisions to be made about treatment.
We have recently proposed the first response criteria for PMR, reflecting the change of the patient’s situation from baseline.11 These response criteria are based on a core set of five variables, comprising a change in the visual analogue scale for pain (VAS p), which is obligatory, and four other variables—namely, the visual analogue scale for physician’s assessment (VAS ph), the ability to elevate the upper limbs (EUL), morning stiffness (MST), and the acute phase response, expressed by CRP or the ESR (mm/1st h), from which the best performing three are used. The acute phase measurements and MST have been shown to be disease activity measures which are independent of pain. VAS ph was included as the only measure independent of the patient, and EUL to cover functional status, although it was shown to be slightly pain dependent.
Recently, a simplified disease activity index (SDAI) for rheumatoid arthritis (RA) has been described, consisting of five items—namely, the number of swollen and tender joints, patient’s global assessment expressed by a VAS, physician’s global assessment also expressed by a VAS, and CRP (mg/dl), which are simply summed.12 This disease activity score has been proved to correlate with the classical 28 joint disease activity score (DAS28)13 in RA and also reflects the American College of Rheumatology (ACR) response.
Criteria based on percentage changes from baseline may cause difficulties in daily practice, as is known from the ACR response criteria for RA,14 and therefore we considered it useful to develop a simple disease activity index for PMR. Such an index, providing an absolute number to reflect disease activity, would enable comparison of patients and avoid the need for a baseline observation to assess the actual activity of a patient’s disease.
Based on the core set of parameters of the PMR response criteria, on the one hand, and taking the SDAI as a model, on the other, we developed an easily calculated disease activity index for PMR, the PMR-AS.
PATIENTS AND METHODS
The PMR-AS was assessed for internal and external validity in the patient cohorts who were evaluated for the development of the PMR response criteria. Fifty seven of the 76 patients from the international patient cohort included in the evaluation of the PMR response criteria could be followed up for 24 weeks. These patients were chosen for the development of the PMR-AS. As in the PMR response criteria evaluation they were analysed at baseline, week 4, and week 24. To validate the results achieved in the original 57 patients an Austrian patient cohort comprising 24 patients, recruited from the Lower Austrian Centre of Rheumatology, was assessed. This cohort was evaluated at baseline, week 4 and at a mean (SD) point of week 33.6 (24.5). Table 1⇓ shows the demographic and baseline disease activity data.
Demographic data and baseline values, mean (SD), for the measures of the core set of the international and the Austrian patient cohort
In all these patients four existing diagnostic criteria sets were applied, as all these patients took part in the European diagnostic criteria evaluation study. The Bird/Wood (1979) criteria performed best in identifying patients considered to have PMR by experienced investigators from across Europe.
Based on the proposed diagnostic criteria and the exclusion criteria, described previously, PMR was finally diagnosed by an experienced clinician. Drugs other than corticosteroids and non-steroidal anti-inflammatory drugs were not allowed for the treatment of PMR during the observation period.
The development of the core set of parameters of the PMR response criteria has been described in detail previously. As the parameters of the core set of the PMR response criteria had already proved their sensitivity to change during the primary evaluation, they were considered to be part of the disease activity index also. To provide easy applicability given by a simple formula, on the one hand, and taking the SDAI for RA as a model, on the other, we decided to sum the parameters as follows:
CRP (mg/dl)+VAS p (0–10)+VAS ph (0–10)+(MST (min)×0.1)+EUL (3–0)
Thus as can be seen the PMR-AS results from the addition of five items and one simple multiplication, which can be done easily. In contrast with the PMR response criteria the EUL was assessed the other way round (3 = none, 2 = below shoulder girdle, 1 = up to shoulder girdle, 0 = above shoulder girdle). For reasons of weighting MST was multiplied by 0.1.
For validation purposes the PMR-AS was then applied to 53 regular outpatients (36 female, 17 male; mean (SD) age 67.3 (10.7) years), resulting in 64 measurements. In this cohort patients rated their satisfaction from 1 (excellent) to 5 (unbearable); moreover, patient’s global assessment was determined by using a VAS and the ESR (mm/1st h) was measured. The PMR-AS was then correlated with the other parameters to see whether it reflected disease activity and patient satisfaction accurately enough. Patient’s global assessment and the ESR can be regarded as the standard of disease activity monitoring in PMR up to now, and patient satisfaction should be taken into consideration to enable decision about treatment to be made.
Statistical analysis
Internal consistency of the composite score was primarily assessed by calculating Cronbach’s α—a numerical coefficient of reliability. Values >0.7 are considered to be a marker of high reliability.15 The amount contributed by each single item to the composite score was evaluated by calculating correlation coefficients. Regression analysis between the percentage responses calculated on the basis of the PMR response criteria and the PMR-AS was applied. As the PMR-AS was seen to be normally distributed in all patient cohorts investigated, by applying the Kolmogorov-Smirnov accommodation, changes of the PMR-AS were evaluated by paired t tests. Unpaired t tests were used to compare the two patient cohorts. At the different times of evaluation a 95% confidence interval for the PMR-AS was calculated. Moreover, correlation and linear regression analysis was performed between the PMR-AS and ESR, VAS for patient’s global assessment, and patient satisfaction, respectively, in the third patient cohort.
Disease activity was categorised as high, medium, and low by calculating means of the PMR-AS at baseline, in patients with 20% and 50% response, and in patients with 70% and 90% response according to the PMR response criteria, respectively.
RESULTS
No major differences in the demographic data were seen between the two patient cohorts, except that the Austrian cohort contained a higher proportion of men.
Cronbach’s α for the composite score in the international cohort was 0.91, based on an average inter-item correlation of 0.68. For the Austrian patient cohort it was 0.88 (average inter-item correlation 0.60). Values >0.7 can be regarded as markers of high reliability. Factor analysis performed by regression analysis showed that each single item contributes significantly to the total score. Moreover, the relative weight of the single items in both patient cohorts was equally distributed (table 2⇓).
Correlation coefficients between the single items and the total score as well as Cronbach’s α for the PMR-AS in the international and Austrian patient cohorts
PMR-AS values at baseline, week 4, and the final evaluation
Mean (SD) PMR-AS at baseline was 27.54 (12.5) (95% CI ±4.9) in the international cohort and 29.07 (6.5) (95% CI ±3.19) for the Austrian cohort. This difference was not significant. At week 4, PMR-AS was 5.99 (4.73) (95% CI ±1.73) for the international cohort and 8.99 (3.76) (95% CI ±2.27) for the Austrian cohort, respectively, showing no significant difference. Similarly, no significant difference was seen at the final control between the two patient cohorts, where the mean PMR-AS was 5.35 (6.01) (95% CI ±2.17) and 5.92 (2.59) (95% CI ±1.4) in the Austrian group, respectively. When the PMR-AS values at baseline and at the control visits were compared highly significant differences were seen by using paired t tests (p<0.0001). No significant difference of the PMR-AS was seen between week 4 and the final control in the international cohort. In the Austrian cohort, however, the difference reached significance (p<0.01), as had already been found in the PMR response criteria evaluation. Figure 1⇓ shows the individual courses of the PMR-AS.

Single PMR-AS courses in the international and Austrian patients.
Replacing the CRP by the ESR to calculate the PMR-AS, using ESR×0.1 as a marker of the acute phase response, resulted in slightly higher values. Regression analysis showed good correlations between the original PMR-AS and the composite score including the ESR (r = 0.9636, 0.9594, 0.9867). This analysis was performed in the international cohort only. Removal of the acute phase response markers from the calculation of the composite score led to insignificant changes of Cronbach’s α in both patient groups and likewise to high correlations between the original PMR-AS and the four item construct (r = 0.9651, 0.9408, 0.9962 in the international cohort; r = 0.8214 at baseline and r = 0.9700 at the control visits of the Austrian patients).
Patient response assessment
Patient response was compared by correlating the percentage response of patients, as described by the PMR response criteria with the percentage change based on the PMR-AS. In the international cohort an impressive correlation between the response rates, as expressed by 20%, 50%, 70%, and 90% response, respectively, could be demonstrated (r = 0.9058 at week 4 and r = 0.8870 at the final control). In the Austrian cohort at week 4 a good correlation was also seen between the two response rates (r = 0.8789). At the final control (week 33.6) the correlation was shown to be moderate (r = 0.6868).
At week 4 in 24/57 patients in the international cohort and in 4/24 patients in the Austrian cohort differences in the stage of response occurred. At the final control these were, respectively, 20/57 patients and 7/24 patients. In general, the response rate was higher when calculated by the PMR-AS change, as no differences of more than one stage of response were noticed. Figures 2⇓ and 3⇓ show the number of patients of both cohorts achieving 20, 50, 70, and 90% responses at the control visits according to both ways of calculating.
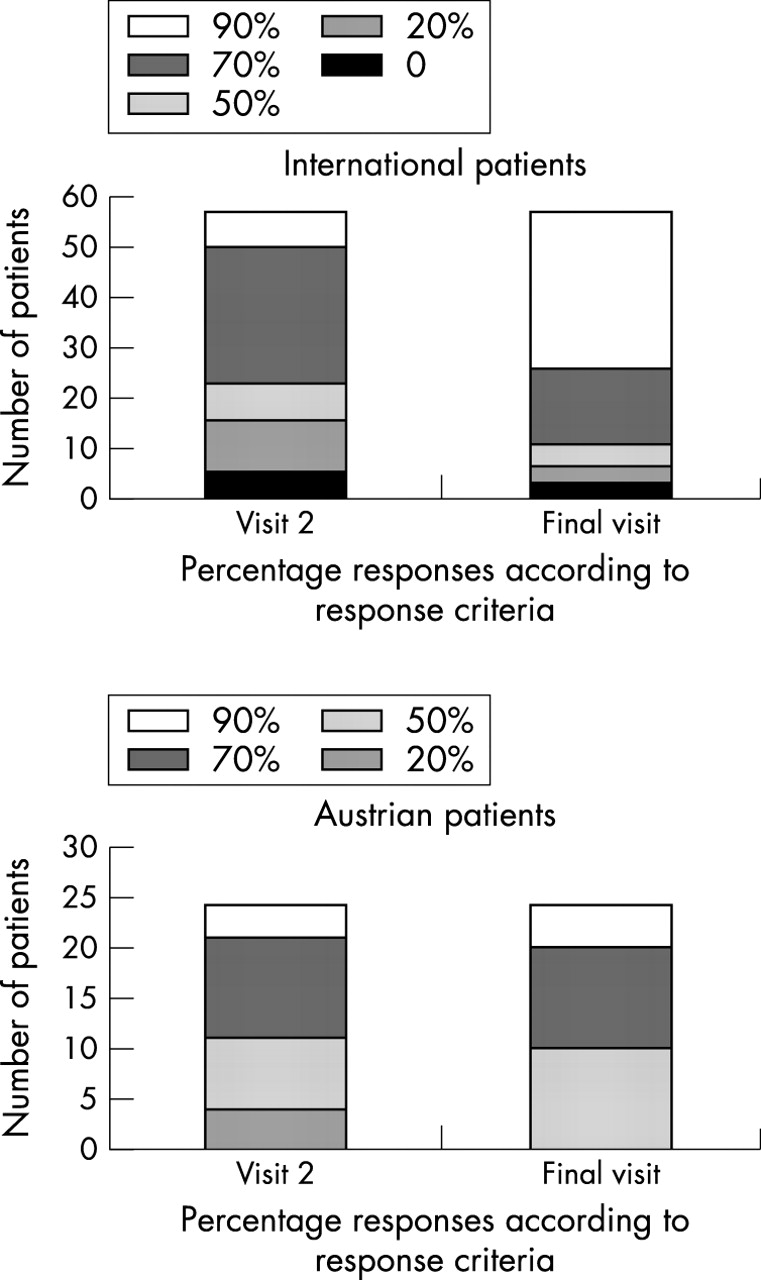
Patient responses to treatment according to the PMR response criteria11 in the international and Austrian cohort.

Patient responses to treatment as calculated by percentage changes of the PMR-AS in the international and Austrian patients.
PMR-AS in daily routine
The PMR-AS was applied cross sectionally in 53 regular outpatients, resulting in 64 determinations between March and July 2003, to evaluate its correlation with the standard of care in patients with PMR—namely, ESR and patient’s global assessment. Moreover, patient satisfaction was recorded. In this cohort PMR-AS values were not normally distributed; the median was 3.7. The median ESR was 15 mm/1st h, patient’s global assessment 19, and patient satisfaction 2. Patient satisfaction, global assessment, and ESR correlated significantly with one another, with the highest correlation for patient satisfaction and global assessment (rs = 0.799; p<0.0001) and the lowest correlation for ESR and patient assessment (rs = 0.376; p<0.002). The PMR-AS was found to be significantly correlated with ESR (rs = 0.477; p<0.001), with patient’s global assessment (rs = 0.749; p<0.0001), and with patient satisfaction (rs = 0.764; p<0.0001) (figs 4A–C)⇓.

Regression analysis between the PMR-AS, patient satisfaction, patient’s global assessment, and ESR in the cohort of regular outpatients.
Disease activity categorising
One other goal of this study was to establish disease activity categories based on the PMR-AS. To this end a primary hypothesis was proposed that patients at baseline had high disease activity and patients with 20 and 50% response according to the PMR response criteria at the following visits were regarded as having medium disease activity. Patients with 70 and 90% responses were assumed to be patients with low disease activity. Consecutively, the mean values of PMR-AS and the 95% confidence intervals were calculated and were found to be as follows: high disease activity 27.89 (95% CI ±3.07); medium disease activity 11.85 (CI ±2.29); low disease activity 3.54 (CI ±0.59); PMR-AS was found to be significantly different between these three groups (p<0.0001).
As given by the means plus two confidence intervals the upper and lower limit for medium disease activity was established, which indeed reflects the 99.9% CI. A PMR-AS between 17 and 7 can be regarded as the range for medium disease activity, >17 for high, and <7 for low disease activity. To prove this assumption disease activity categories of the regular outpatients were determined in the way described—stage 1 resembling high activity and 3 low activity. The median disease stage was 3. The disease activity category was shown to be highly significantly correlated with patient satisfaction (rs = 0.712), patient’s assessment (rs = 0.566), and ESR (rs = 0.492); all (p<0.01).
It follows that PMR-AS values <7 can be regarded as indicating low disease activity, between 7 and 17 medium disease activity can be assumed, whereas PMR-AS values >17 reflect high PMR activity.
DISCUSSION
A primary requirement for the creation of composite indices, in general, is proof of their internal consistency and reliability. The PMR-AS, comprising five items of proven sensitivity to change in PMR, is much higher than 0.7, as indicated by Cronbach’s α, which is regarded as the threshold of high reliability. The reliability not only of the PMR-AS but also of the recently published PMR response criteria should be confirmed in that way. In contrast with the response criteria, the contribution of the single items to the composite score varies to a much smaller extent, as expressed by factor analysis. Even the internal relationship of the weighting of the single items was identical in both patient groups, with the highest weight for VAS ph and VAS p and the lowest for EUL. Therefore, it was decided to retain the acute phase measurements as part of the PMR-AS, although its reliability remains the same when CRP or the ESR is removed. Moreover, because most physicians believe that PMR in which acute phase parameters are not raised is less active, this belief is accommodated more specifically by the five item PMR-AS.17,18
There was some discussion on how to include MST in the score, because counting in minutes would have resulted in a far higher weighting of this symptom and counting in hours in a much smaller one. Removal of MST from the score resulted in smaller values of Cronbach’s α (0.67 in the Austrian cohort), indicating loss of reliability. Thus multiplication by 0.1 was proposed to reconcile the criteria of item weighting, one the one hand, and the requirements of easy calculation, on the other. This also applies to the use of the sedimentation rate as ESR×0.1, instead of CRP values, which does not interfere with validity and sensitivity to change of the PMR-AS.
Currently, measurement of the acute phase response and patient’s global assessment are the standard procedures for monitoring patients with PMR. The PMR-AS was shown to be highly correlated not only with the acute phase response and patient’s global assessment but also with patient satisfaction. Thus the PMR-AS has proved its ability to describe disease activity in the same way as the present standard and also takes patient satisfaction into account.
In various cohorts of patients with RA of the Lower Austrian Centre of Rheumatology, Cronbach’s α for the SDAI and for DAS28, which constitutes the most commonly applied disease activity score in RA, varied from 0.66 to 0.75. Thus the reliability of the PMR-AS can be regarded as considerably higher than that of both the composite scores for RA activity measurement.
As was expected, the PMR-AS proved its sensitivity to change as well as, or even better than, the PMR response criteria, probably owing to the use of absolute numbers rather than percentage changes, as can be seen for the EUL.
Categorising the patient’s response according to the PMR response criteria and with respect to percentage changes of the PMR-AS showed substantial correlations at all times of evaluation. Differences in response categories of more than one stage did not occur. Thus the PMR response criteria may be applied in the future either by calculating them in the way originally described or by assessing changes of the PMR-AS.
Establishing disease activity categories according to the development of disease activity indices is a crucial task. It was felt to be somewhat easier for PMR, as the components of the PMR-AS had already proved their sensitivity to change during the response criteria evaluation, and the rapid and sustained improvement of the disease after initiation of corticosteroids is clearly evident. The primary hypothesis was applied that low, medium, and high disease activity can be assumed for patients showing 70 and 90% response, 20 and 50% response, and for patients at baseline or showing no response, respectively. This hypothesis was proved by the considerable significance of the differences between the groups, on the one hand, and, on the other, by significant correlation between the disease activity category and patient satisfaction, the ESR, and patient global health measured by a VAS in the daily routine. Thus the ranges of low and medium disease activity seem to correctly describe the clinical situation.
However, further investigations are necessary to confirm these disease activity categories, and should also evaluate to what extent fluctuations of the PMR-AS can be regarded as clinically relevant. This should also lead to a better definition of relapses, which occur frequently during the course of the disease.18
Composite disease activity indices should clearly describe the clinical situation and should be easily applied. The PMR-AS undoubtedly meets these demands. The validity of the score, its sensitivity to change, and its comparability with the current standard of monitoring are well confirmed by the results stated above. Moreover, its calculation can be easily performed at the physician’s desk and even in the absence of laboratory values a relevant description of the patient’s actual status can be achieved by calculating the four item score. In addition, scores giving absolute numbers make it possible to compare patients much more easily than using response criteria, for which the baseline situation has to be known, which is often not the case in daily practice. However, it seems to be also appropriate to describe the extent of the treatment response—for example, for comparison and assessment of treatment regimens other than corticosteroids.
Thus, in conclusion, the PMR-AS is an easily applicable and valid tool for disease activity monitoring in patients with PMR. In combination with the PMR response criteria it provides a better description of response, enabling evaluation of new treatments. We expect that better monitoring of disease activity and treatment responses in PMR will improve clinical decision making and, ultimately, patient care.
Acknowledgments
We cordially thank the members of the EULAR Polymyalgia Rheumatica collaborating group: Gideon Nesher, Wolfgang Hueber, Dusan Logar, Carlomaurizio Montecucco, Josef Rovensky, and Moshe Sonnenblick, and Ingrid Andel and Judith Sautner from the Lower Centre for Rheumatology, for their collaboration and support.