Article Text

Abstract
Objectives This study examines the relationship between synovial hypoxia and cellular bioenergetics with synovial inflammation.
Methods Primary rheumatoid arthritis synovial fibroblasts (RASF) were cultured with hypoxia, dimethyloxalylglycine (DMOG) or metabolic intermediates. Mitochondrial respiration, mitochondrial DNA mutations, cell invasion, cytokines, glucose and lactate were quantified using specific functional assays. RASF metabolism was assessed by the XF24-Flux Analyzer. Mitochondrial structural morphology was assessed by transmission electron microscopy (TEM). In vivo synovial tissue oxygen (tpO2 mmHg) was measured in patients with inflammatory arthritis (n=42) at arthroscopy, and markers of glycolysis/oxidative phosphorylation (glyceraldehyde 3-phosphate dehydrogenase (GAPDH), PKM2, GLUT1, ATP) were quantified by immunohistology. A subgroup of patients underwent contiguous MRI and positron emission tomography (PET)/CT imaging. RASF and human dermal microvascular endothelial cells (HMVEC) migration/angiogenesis, transcriptional activation (HIF1α, pSTAT3, Notch1-IC) and cytokines were examined in the presence of glycolytic inhibitor 3-(3-Pyridinyl)-1-(4-pyridinyl)-2-propen-1-one (3PO).
Results DMOG significantly increased mtDNA mutations, mitochondrial membrane potential, mitochondrial mass, reactive oxygen species and glycolytic RASF activity with concomitant attenuation of mitochondrial respiration and ATP activity (all p<0.01). This was coupled with altered mitochondrial morphology. Hypoxia-induced lactate levels (p<0.01), which in turn induced basic fibroblast growth factor (bFGF) secretion and RASF invasiveness (all p<0.05). In vivo glycolytic markers were inversely associated with synovial tpO2 levels <20 mm Hg, in contrast ATP was significantly reduced (all p<0.05). Decrease in GAPDH and GLUT1 was paralleled by an increase in in vivo tpO2 in tumour necrosis factor alpha inhibitor (TNFi) responders. Novel PET/MRI hybrid imaging demonstrated close association between metabolic activity and inflammation. 3PO significantly inhibited RASF invasion/migration, angiogenic tube formation, secretion of proinflammatory mediators (all p<0.05), and activation of HIF1α, pSTAT3 and Notch-1IC under normoxic and hypoxic conditions.
Conclusions Hypoxia alters cellular bioenergetics by inducing mitochondrial dysfunction and promoting a switch to glycolysis, supporting abnormal angiogenesis, cellular invasion and pannus formation.
- Inflammation
- Fibroblasts
- Rheumatoid Arthritis
- TNF-alpha
- Synovitis
This is an Open Access article distributed in accordance with the Creative Commons Attribution Non Commercial (CC BY-NC 4.0) license, which permits others to distribute, remix, adapt, build upon this work non-commercially, and license their derivative works on different terms, provided the original work is properly cited and the use is non-commercial. See: http://creativecommons.org/licenses/by-nc/4.0/
Statistics from Altmetric.com
Introduction
Hypoxia is a fundamental metabolic change common in many inflammatory diseases. The increased proliferation and rapid activation of immune cells requires a switch in cell metabolism from a resting regulatory state to a highly metabolically active state, in order to maintain energy homoeostasis.1 This metabolic shift occurs when oxygen levels are low, limiting the metabolism of pyruvate by the tricarboxylic acid (TCA) cycle in the mitochondria during oxidative phosphorylation. We now know that this metabolic shift occurs in many inflammatory conditions such as rheumatoid arthritis (RA) and colitis, with comorbidities including atherosclerosis, diabetes, psoriasis and obesity.2–4 One of the earliest events in synovial inflammation is new vessel formation (angiogenesis), resulting in a self-perpetuating and persistent infiltration of leucocytes, transforming the synovial membrane (SM) into an aggressive tumour-like ‘pannus’ mediating joint destruction.5–8 The architecture of the microvasculature is highly dysregulated, thus efficiency of oxygen supply to the synovium is poor.5–7 This results in an hypoxic joint microenvironment in vivo, which is associated with increased synovial inflammation and activation of key proinflammatory signalling mediators including HIF1α, nuclear factor kappa (NFκΒ), Notch and pStat.7 ,9–15
Hypoxia represents a potential threat to cell function and survival in inflammation,9–11 ,16–18 with the cellular demand outpacing the vascular supply leading to a switch in mitochondrial respiration in favour of glycolysis. While glycolysis is far less efficient in terms of ATP production compared with the TCA cycle, it produces ATP more rapidly which is required by the highly proliferating cells. This is consistent with studies showing elevated lactate levels with diminished glucose in RA synovial fluids.19–21 Lactic acidosis can alter expression of the p53 tumour suppressor gene, and can inhibit DNA repair thus interfering with apoptotic mechanisms, promoting cell survival.22–24 Increased glyceraldehyde-3-phosphate dehydrogenase, glucose-6-phosphate and lactate dehydrogenase activity has been demonstrated in RA synovium.25 Furthermore, hypoxia induces glucose transporters GLUT1 and GLUT3 in articular chondrocytes,26 and several glycolytic enzymes in cartilage explants.27
We have previously shown increased mitochondrial DNA mutation frequency and mitochondrial dysfunction in the RA joint,28 which is associated with oxidative stress, angiogenesis, proinflammatory cytokines and activation of the NLRP3 inflammasome.29–33 Furthermore, in RA, studies have shown increased nicotinamide adenine dinucleotide phosphate (NADPH) oxidase/Nox2 in circulating leucocytes and synovium,34 demonstrated altered expression of 6-phosphofructo-2-kinase/fructose-2, 6-bisphosphatase 3 (PFKFB3) in naive CD4T cells,35 and shown synovial deficiency of cytochrome C oxidase.32 The ability of synovial cells to adapt their metabolism in response to the inflammatory microenvironment suggests dysregulated bioenergetics may be an important regulator in RA pathogenesis. In this study we demonstrate alterations in mitochondrial function in response to hypoxia, which is paralleled by a shift in cellular bioenergetics to glycolysis and induction of proinflammatory mechanisms in vitro and in vivo.
Methods
Online supplementary file 1 includes descriptions of the following methodologies: patient recruitment, arthroscopy, tissue oxygen (tpO2) measurements, primary cell culture, mitochondrial functional assays, quantification of lactate and glucose, transwell invasion assay, ELISA, positron emission tomography (PET)/MRI hybrid imaging protocol, transmission electron microscopy, immunohistochemistry, western blot, wound repair, angiogenic assays and statistics.
Supplemental material
Mitochondrial random mutation capture assay
To characterise the frequency of random mutations in synovial biopsy samples, we used the mitochondrial random mutation capture assay as described previously.28 This quantitative PCR-based approach enables precise determination of mutation frequencies following exhaustive digestion of all wild type (non-mutant) sequences by the restriction enzyme Taq-I. Mitochondrial DNA was extracted using a previously reported protocol.28 Following extraction, 10 μg of mtDNA was digested with 100 units of Taq αI restriction enzyme (New England Biolabs), 1× bovine serum albumin and a Taq αI–specific digestion buffer (10 mM Tris HCl, 10 mM MgCl2, 100 mM NaCl (pH 8.4)) for 10 h, with 100 units of Taq-αI added to the reaction mixture every hour. PCR amplification was performed in 25 μL reaction mixtures containing 12.5 μL 2×SYBR Green Brilliant Mastermix (Stratagene), 0.1 μL uracil DNA glycosylase (New England Biolabs), 0.7 μL forward and reverse primers (10 pM/μL; DNA oligonucleotide (IDT)) and 6.7 μL H2O. The samples were amplified using a Roche Light Cycler 480, according to the following protocol; 37°C for 10 min, 95°C for 10 min, followed by 45 cycles of 95°C for 15 s and 60°C for 1 min. Samples were kept at 72°C for 7 min and following melting curve analysis, immediately stored at −80°C. The primer sequences used were as follows: for mtDNA copy number 5′-ACAGTTTATGTAGCTTACCTCC-3′ (forward) and 5′-TTGCTGCGTGCTTGATGCTTGT-3′ (reverse); for random mutations 5′-CCTCAACAGTTAAATCAACAAAACTGC-3′ (forward) and 5′-GCGCTTACTTTGTAGCCTTCA-3′ (reverse).
Oxygen consumption rate and extracellular acidification rate-seahorse technology
Oxygen consumption rate (OCR) and extracellular acidification rate (ECAR), reflecting oxidative phosphorylation and glycolysis, respectively, were measured before and after treatment with oligomycin (2 µg/mL, Seahorse Biosciences, UK), trifluorocarbonylcyanide phenylhydrazone (FCCP) (5 μM, Seahorse Biosciences) and antimycin A (2 μM, Seahorse Biosciences) using the Seahorse XF24-analyser (Seahorse Biosciences). Rheumatoid arthritis synovial fibroblasts (RASF) were seeded at 30 000 cells per well in 24-well XF-microplates (Seahorse Biosciences) and allowed to adhere for 24 h. Cells were rinsed with assay medium (unbuffered Dulbecco's Modified Eagle's medium (DMEM) supplemented with 10 mM glucose, pH7.4) before incubation with assay medium for 30 min at 37°C in a non-CO2 incubator. Following incubation cells were stimulated with dimethyloxalylglycine (DMOG), a pan prolyl hydroxylase inhibitor and dimethyl sulfoxide (DMSO) vehicle control for 2 h. DMOG (HIF1α activator), was used in these experiments to mimic the effect of hypoxia as the Seahorse Analyzer cannot be placed in a hypoxic chamber. Four baseline OCR and ECAR measurements were obtained over 28 min before injection of specific metabolic inhibitors. Moreover, to challenge the metabolic capacity of the RASF, three OCR and ECAR measurements were obtained over 15 min following injection with oligomycin, FCCP and antimycin A.
Results
DMOG induces mitochondrial dysfunction in primary RASF in vitro
DMOG significantly increased mtDNA mutation frequency from a mean of 3.5×10⁻⁵ to 6.0×10⁻⁵ (p=0.008) (figure 1A). DMOG significantly induced reactive oxygen species (ROS) production (p=0.001) (figure 1B), which was coupled by a significant increase in mitochondrial membrane potential (MMP) (p=0.03) (figure 1C) and mitochondrial mass (MM) (p=0.03) (figure 1D). In contrast DMOG significantly inhibited intracellular ATP in RASF (p<0.001) (figure 1E).

Dimethyloxalylglycine (DMOG) induces mitochondrial dysfunction and glycolytic metabolism in RASF. (A–J) Box plots representing frequency of mitochondrial DNA mutation (A), reactive oxygen species (ROS) (B), mitochondrial membrane potential (MMP) (C), mitochondrial mass (MM) (D), ATP (E) extracellular acidification rates (ECAR) (F), basal oxygen consumption rates (OCR) (G), ATP synthesis (H), maximal respiration (I) and spare respiratory capacity (J), quantification in response to DMOG (1 mM) or vehicle control (1 mM) in primary RASF (n=7). Boxes represent the 25th to 75th centiles, lines within the boxes represent the median, and lines outside the boxes represent the 10th and 90th centiles. *p<0.05 statistically significant.
DMOG induces changes in energy metabolism in primary RASF in vitro
To further investigate if the increased mitochondrial dysfunction and reduced ATP levels in RASF were due to alterations in energy metabolism, we measured the two major energy pathways, oxidative phosphorylation and glycolysis using the Seahorse XF-Analyzer. DMOG significantly increased baseline glycolysis (ECAR) compared with vehicle control (p<0.001) (figure 1F), in contrast baseline mitochondrial respiration (OCR) was significantly reduced (p<0.001) (figure 1G). The inhibition of OCR was paralleled by a significant reduction in ATP synthesis (p<0.01) (figure 1H), maximal respiration (p<0.001) (figure 1I) and spare respiratory capacity (p<0.001) (figure 1J). Online supplementary figure S1A, B demonstrates representative OCR and ECAR bioenergetic profiles before and after injections of oligomycin, FCCP and antimycin A for RASF in the presence and absence of DMOG.
Supplementary figures
Hypoxia induces lactate secretion in primary RASF in vitro
To examine if this results in an increase in glycolytic metabolites, we exposed RASF to 3% hypoxia and measured glucose and lactate levels. Hypoxia decreased glucose levels (figure 2A), and significantly increased lactate production from RASF (p=0.0025) (figure 2B). Furthermore levels of lactate in synovial fluid were significantly elevated when compared with serum (p<0.05) (see online supplementary figure S1C).

Hypoxia induces lactate, abnormal mitochondrial morphology, invasiveness and secretion of bFGF in RASF in vitro. RASF were cultured under normoxic and 3% hypoxic conditions for 24 h. Box plots represent glucose (A) and lactate (B) levels in RASF cultured supernatants (n=7). Boxes represent the 25th to 75th centiles, lines within the boxes represent the median, and lines outside the boxes represent the 10th and 90th centiles. *p<0.05 statistically significant. (C,D) Representative transmission electron microscopy images of RASF mitochondria under normoxic and 3% hypoxic conditions. Regular shaped mitochondria indicated by black arrows and irregular elongated mitochondria indicated by red arrows. Invasion was assessed using Biocoat Transwell invasion chambers following lactic acid treatment (1 mM) and representative images were taken (E,F). Following 24 h stimulation, invading cells attached to lower membrane were fixed (1% glutaraldehyde) and stained (0.1% crystal violet) (×40). (G) Quantification of RASF invasion (n=7). Quantification of bFGF (H), VEGF (I) and PIGF (J) in RASF supernatants following culture with lactic acid (1 mM) compared with basal (n=8). *p<0.05 statistically significant.
Using transmission electron microscopy we observed regularly oval shaped mitochondrial morphology under normoxic conditions (black arrows) (figure 2C), in contrast to a mixture of irregular and regular shaped mitochondria under hypoxic conditions. RASF exposed to hypoxia showed mitochondria that were less dense and had an elongated shape (red arrows), suggesting alteration in mitochondrial function (figure 2D).
We then cultured RASF with lactic acid for 24 h and showed a significant increase in RASF invasion (p<0.05) (figure 2E–G) and basic fibroblast growth factor (bFGF) secretion (p<0.05) (figure 2H), with no effect observed for vascular endothelial growth factor (VEGF), placental growth factor (PIGF) (figure 2I, J), interleukin (IL) 6, IL-8 and RANTES (Regulated on Activation, Normal T Cell Expressed and Secreted; see online supplementary figure S2A). Pyruvic acid had no effect on IL-6, IL-8 and RANTES (see online supplementary figure S2B), and succinate significantly induced bFGF (p<0.05) and RASF invasion (p<0.05), similar to that of lactic acid (see online supplementary figure S2C).
An increase in glycolytic markers with a decrease in ATP is associated with low synovial oxygen partial pressure (pO2) levels in vivo
To confirm a synovial metabolic shift towards glycolysis in vivo, we examined expression of surrogate markers of glycolysis and ATP in synovial tissue by immunohistology in patients (n=42) whose pO2 levels were quantified. Synovial expression of glyceraldehyde 3-phosphate dehydrogenase (GAPDH) was significantly higher in patients whose tpO2 levels were <20 mm Hg compared with >20 mm Hg (p<0.05) (figure 3). This was in contrast to ATP5B expression which was significantly lower in patients with tpO2<20 mm Hg versus those whose tpO2 levels were >20 mm Hg (p<0.05) (figure 3). Consistent with this finding the glucose transporter GLUT1 and surrogate glycolytic marker PKM2 were also significantly higher in patients with tpO2 levels in vivo <20 mm Hg versus those whose tpO2 levels were >20 mm Hg (all p<0.05) (figure 3). Glycolytic marker expression of GAPDH and PKM2 correlated with increased macroscopic and microscopic vascularity (r=0.42, p=0.042; r=0.45, p=0.046; r=0.35, p=0.046, respectively). Furthermore in vivo pO2 inversely correlated with GAPDH (r=−0.45, p=0.003), GLUT1 (r=−0.44, p=0.006), PKM2 (r=−0.5, p=0.003) and positively with ATP (r=0.4, p=0.03), and synovitis was associated with GLUT1 expression (r=0.4, p=0.048). This data supports our in vitro data and suggests that alterations in mitochondrial function and energy metabolism regulate inflammation in the RA joint.
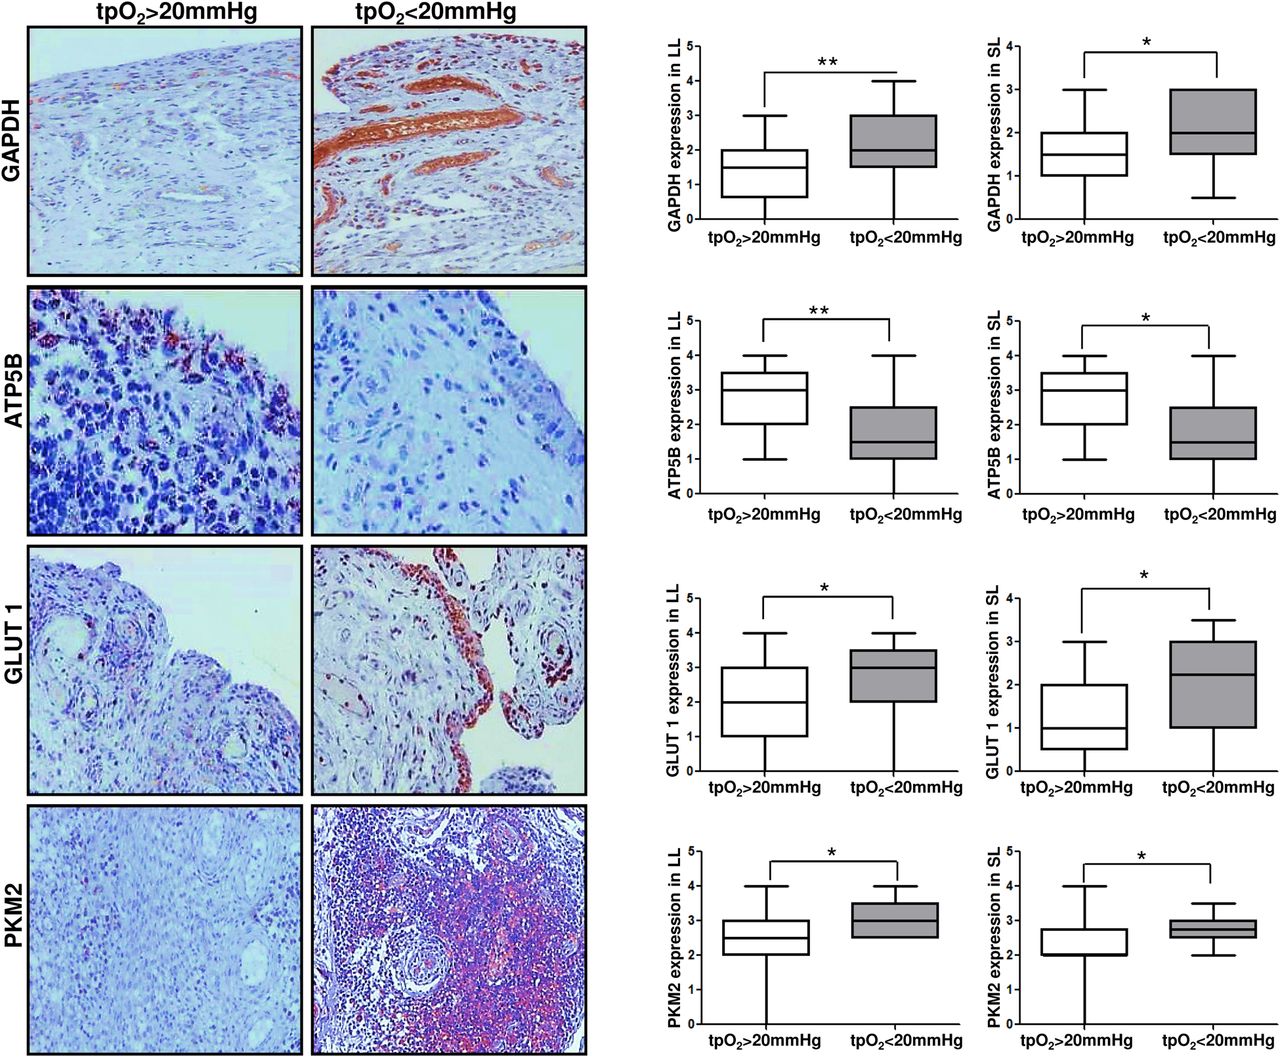
GAPDH, ATP5B, GLUT1 and PKM2 expression in synovial tissue is associated with in vivo synovial pO2 levels. Representative images and semiquantification of immunohistochemical staining for glycolytic and oxidative phosphorylation markers GAPDH, ATP5B, GLUT1 and PKM2 in lining layer (LL) and sublining layer (SL) of synovial tissue. GAPDH, ATP5B, GLUT1 and PKM2 quantification was categorised into patients with in vivo pO2 levels >20 mm Hg versus <20 mm Hg. Quantification was performed using a semiquantitative scoring method (0–4). Boxes represent the 25th to 75th centiles, lines within the boxes represent the median, and lines outside the boxes represent the 10th and 90th centiles. *p<0.05 statistically significant.
A subgroup of patients underwent contiguous PET/CT and MRI (n=4). PET/CT and MRI scans were merged to map metabolic activity to synovial perfusion by accurate anatomical co-location. Figure 4A demonstrates representative images of an axial CT (1), axial PET/CT (2) axial contrast-enhanced MRI (3) and PET/MR merged image (4), where it can clearly be seen that increased inflammation (yellow) is co-localised with metabolic activity (red). Figure 4A, B shows representative hybrid fusion images demonstrating co-localisation of metabolic activity and inflammation and in vivo synovial pO2 levels.
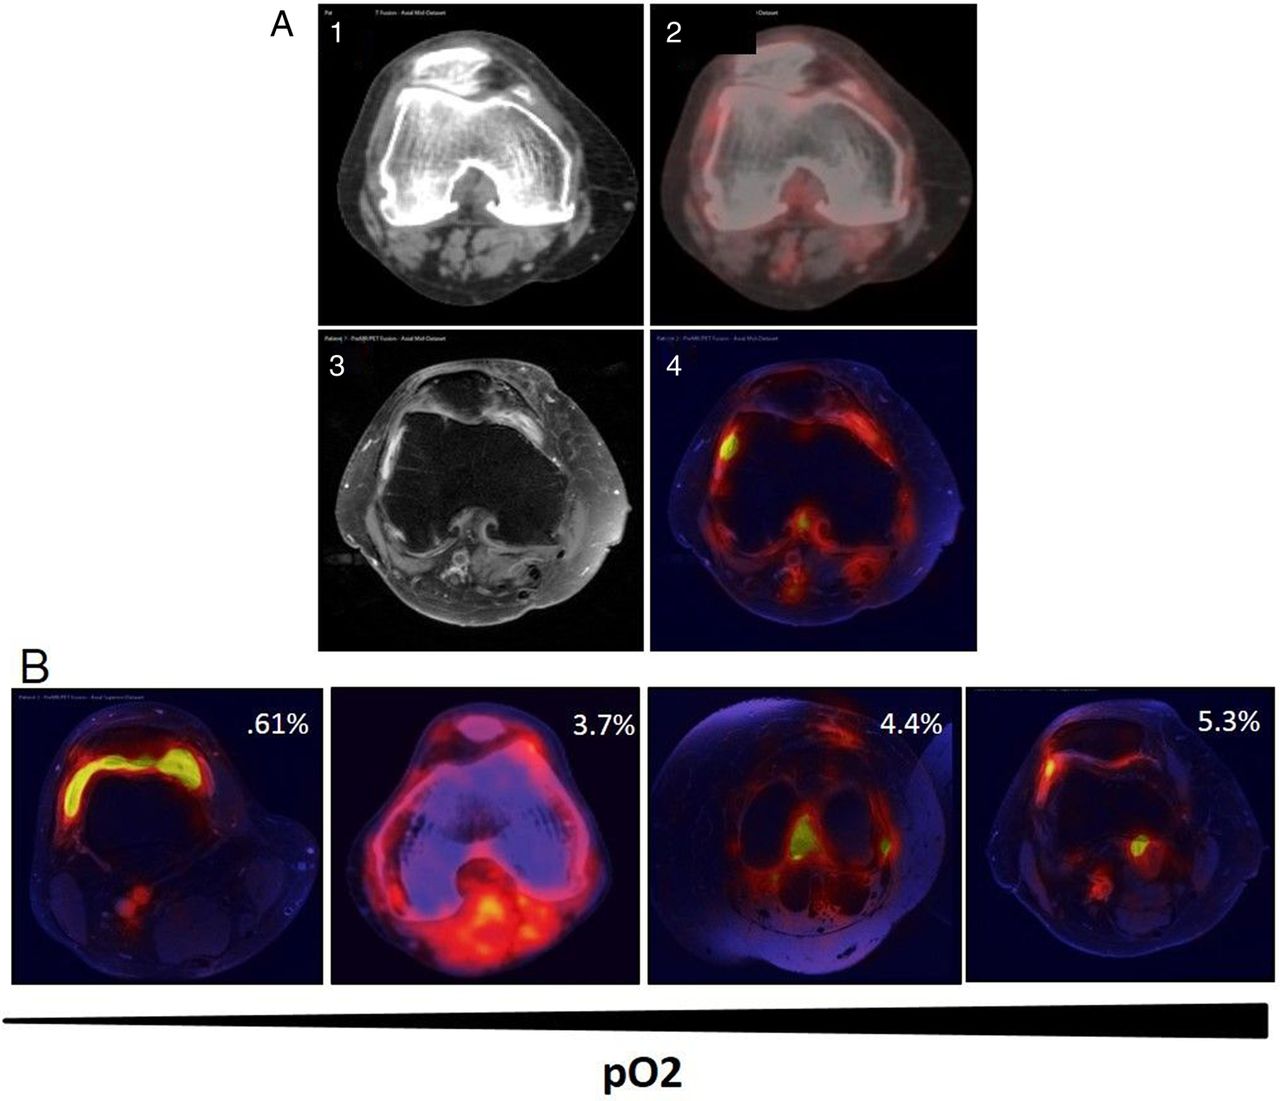
Co-localisation of metabolic activity and inflammation in vivo using hybrid PET/MRI images. Contiguous CT, PET and MRI scans from patients with rheumatoid arthritis were obtained and then fused to create hybrid PET/MRIs to co-localise metabolic activity and inflammation in the joint. (A) Representative images of axial CT slice (1), axial PET/CT (2), axial contrast-enhanced MRI (3) and hybrid PET/MRI fusion (4). (B) Representative images of four patients demonstrating co-localisation of metabolic activity and inflammation and in vivo synovial pO2 levels.
Glycolytic inhibitor 3-(3-Pyridinyl)-1-(4-pyridinyl)-2-propen-1-one (3PO) inhibits proinflammatory mechanisms in the inflamed joint
To elucidate if metabolic reprogramming inhibits proinflammatory mechanisms, we cultured RASF and human dermal microvascular endothelial cells (HMVEC) with glycolytic inhibitor 3PO (figure 5A–E). We demonstrated that 3PO inhibited RASF invasion, and migration, and HMVEC angiogenic tube formation (figure 5A, B, D). Furthermore, 3PO significantly inhibited key proinflammatory mediators IL-6, IL-8, monocyte chemotactic protein 1 (MCP1), RANTES and c-x-c motif chemokine ligand 1 (GRO-α) from RASF and HMVEC (p<0.05) (figure 5C, E). Furthermore, 3PO significantly inhibited hypoxia-induced migration, angiogenesis and secretion of IL-6, IL-8, MCP-1 and RANTES from RASF and HMVEC (all p<0.05) (see online supplementary figure S3). Finally 3PO differentially regulated transcriptional regulation of HIF1α, pSTAT3 and Notch-1IC in RASF and HMVEC under hypoxic conditions. 3PO inhibited HIF1α and Notch-1IC in RASF however in HMVEC 3PO had no effect on HIF1α, but inhibited pSTAT3 and Notch-1IC (figure 5F). Densitometry quantification is shown in online supplementary figure S4.

3PO inhibits proinflammatory mechanisms in RASF and HMVEC cells. RASF (left panel) and HMVEC (right panel) were cultured in the presence of the glycolytic inhibitor 3PO (20 µM). Invasion was assessed using Biocoat Transwell invasion chambers following RASF treatment with 3PO (n=3) and representative images and quantification is shown in (A). Representative images of inhibition of RASF migration following 3PO treatment and quantification of wound repair (n=6) are shown in (B). (C) Quantification of interleukin (IL) 6, IL-8, MCP-1 and RANTES in RASF supernatants following RASF culture with 3PO compared with basal (n=9). Representative images and quantification of HMVEC tube formation in response to 3PO (D). Quantification of IL-6, IL-8, GRO and RANTES in HMVEC supernatants following culture with 3PO compared with basal (n=8) (E). Representative western blots are shown in (F) for HIF1α, pSTAT3, tSTAT3, Notch1 and βactin in both K4IM (left panel) and HMVEC (right panel) following 3PO treatment under hypoxia. *p<0.05 statistically significant.
Tumour necrosis factor alpha inhibitor (TNFi) treatment increases synovial pO2 levels while decreasing expression of GAPDH and GLUT1 in vivo
Nineteen patients underwent synovial tpO2 measurements and clinical assessment of disease activity (Disease Activity Score 28 (DAS28)-CRP) at baseline and 3 months after starting biological therapy. At baseline there was no statistically significant difference in tpO2 levels in patients responding to TNFi versus non-responders. Baseline GAPDH expression in the lining layer was significantly higher in responders versus non-responders (p<0.05). In vivo synovial pO2 levels significantly improved in responder versus non-responder patients (p<0.05) (figure 6A). This was paralleled by a significant decrease in glycolytic enzyme GAPDH and GLUT1 expression in responders only (all p<0.05), with no change observed for non-responders (figure 6B–D). Representative images demonstrating GAPDH and GLUT1 pre/post treatment in responder patients who had achieved remission are shown in figure 6E, F.

Successful TNFi treatment increases synovial pO2 levels while decreasing expression of GAPDH and GLUT1. Improvements in synovial pO2 levels in patients who responded to TNFi treatment after 3 months compared with non-responders (A). (B–F) Representative images and semiquantification of immunohistochemical staining for glycolytic marker GAPDH in the lining layer (LL) and sublining layer (SL) of synovial tissue and GLUT1 in the SL of synovial tissue. GAPDH and GLUT1 quantification was categorised into patients who were either responders or non-responders to treatment. Quantification was performed using a semiquantitative scoring method (0–4). Boxes represent the 25th to 75th centiles, lines within the boxes represent the median, and lines outside the boxes represent the 10th and 90th centiles. *p<0.05 statistically significant.
Discussion
In this study, we demonstrate that hypoxia alters cellular bioenergetics by downregulating mitochondrial respiration and promoting glycolysis in the inflamed joint, which in turn induces synovial invasive mechanisms. In primary RASF, we show that DMOG induced higher mitochondrial DNA mutations, MM, MMP and ROS, altered mitochondrial structural morphology, but inhibited ATP. This change was paralleled by an increase in the rate of glycolysis with concomitant attenuation of mitochondrial respiration. Furthermore, we show that hypoxia increased RASF lactate levels, which in turn further induced RASF invasion and bFGF secretion. Increased glycolysis in vitro, was mirrored in vivo, with synovial expression of GAPDH, PKM2 and GLUT1 significantly higher in patients with tpO2 levels in vivo <20 mm Hg, in contrast to ATP which was significantly lower, effects of which were reversed in TNFi responders. Finally glycolytic inhibitor 3PO significantly inhibited RASF invasion/migration, angiogenesis, secretion of proinflammatory mediators and transcriptional activation of HIF1α, pSTAT3 and Notch-1IC.
In this study, we used the mitochondrial random mutation capture (RMC) assay which analyses mitochondrial mutagenesis at single base pair resolution and detects one mutation among 10 million wild type bases.36 We demonstrate that DMOG induces random mitochondrial point mutations, paralleled by increases in ROS production, MMP and MM in RASF. The mitochondrial genome is highly susceptible to oxidative damage, and implicated in disease progression and response to therapy in inflammatory arthritis.37 This is consistent with studies demonstrating increased DNA damage, mtDNA mutation frequency and depolarised mitochondria in RA synovial tissue and peripheral blood mononuclear cells.7 ,28 ,30 ,38 In vivo synovial tpO2 levels inversely correlate with mitochondrial mtDNA mutations, 4-hydroxy-2-nonenal (4HNE), 8-oxodG and NADPH oxidase,7 ,28 ,30 ,32 ,37 and deficiency of cytochrome C.37 Interestingly the effect of DMOG in this study differs from that observed previously using an immortalised healthy synovial fibroblast cell line, where we demonstrated DMOG had no effect on mitochondria function under normoxic conditions.32 The difference may suggest that the RASF are more primed and this is an intrinsic effect due to the transformed nature of RASF compared with that of an immortalised cell line. The limited effect under hypoxic conditions is not surprising as the prolyl hydroxylase enzymes are already inhibited, therefore the addition of DMOG would probably not have any further effects. Increased clonal mtDNA mutation frequency in the MT-ND1 gene for mitochondrially encoded nicotinamide adenine dinucleotide (NADH)-dehydrogenase-1 has been detected in RASF, with potential mutation sites in the major histocompatibility complex (MHC) epitope in patients with RA, but not OA.31 TNFR1 mutant mouse fibroblasts show evidence of altered mitochondrial function, with increased oxidative capacity, ROS generation and proinflammatory cytokines.31 Mitochondria-derived ROS increases NFκB activation through induction of TNF-α cytotoxicity, with subsequent induction of mitochondrial NADPH oxidase.39 ,40 This is consistent with studies describing inflammatogenic features of oxidatively damaged mtDNA, with increased NFκB activity, TNFα production and induced arthritis in animal models.28 ,41
We demonstrate a significant change in energy metabolism within the joint, with decreased intracellular ATP, increased lactate production and an increase in glycolysis with simultaneous attenuation of mitochondrial respiration. This is supported by studies showing increased glycolytic metabolites in RA synovial fluid.19–21 Hypoxia and glycolytic metabolites are known to induce many transcriptional factors, such as HIF1α and NFκB which induce angiogenic growth factors, inflammatory cytokines and extracellular membrane components which in turn enhance further glycolytic activity.10–16 ,29 ,38 An increase in the metabolic state towards glycolysis has been shown in proinflammatory cells that are resident in the inflamed joint such as TH17 cells,42 macrophages and dendritic cells (DC).43
In this study we also demonstrate that lactic acid induced RASF invasion and increased secretion of bFGF, with no effect observed for other growth factors and cytokines. While the exact mechanisms involved are unclear, previous studies have shown that lactic acid can induce angiogenic tube formation via NFκB activation, through the monocarboxylate transporter MCT1,44 has the ability to stabilise HIF1α in macrophages,45 and can act as a signalling molecule to promote cancer cell migration and survival.46 Furthermore bFGF itself can further induce dysfunctional angiogenesis, a characteristic feature of the inflamed synovium,6–9 can increase cellular invasion,47 induce MMP13 in chondrocytes through PI3K/Akt/ERK1/2 pathways48 and can activate RhoGTPase proteins, which are pivotally involved promoting cell migration.49 Finally, succinate also induced bFGF and invasion, similar to that of lactic acid. The effect of succinate is consistent with other studies showing a marked increase in succinate in lipopolysaccharide (LPS)-activated macrophages,29 which in turn inhibits prolyl hydroxylases, resulting in HIF1α stabilisation, with subsequent induction of proinflammatory mechanisms. Together this data suggests that the shift to glycolysis may be an attempt by synovial cells to produce more ATP rapidly, and can further induce invasive mechanisms.
Our in vitro data is supported by our in vivo data, in which we demonstrate decreased ATP5B in the SM of patients with tpO2 levels <20 mm Hg compared with those >20 mm Hg. In parallel, we demonstrated increased expression GAPDH, PKM2 and GLUT1 in low versus high synovial pO2 levels, confirming a glycolytic shift in this hostile environment. This is supported by studies demonstrating lower glucose levels and intracellular ATP in naive CD4 T cells from patients with RA attributed to a deficiency in induction of PFKFB3, a key glycolytic enzyme.35 Furthermore it is consistent with a recent study, demonstrating that PKM2 induces HIF1α and IL-1β in macrophages.50 Rescuing mitochondrial defects using antioxidants such as superoxide dismutase (SOD) and N-acetylcysteine (NAC) inhibits the oxidative stress, resulting in inhibition of proinflammatory cytokines, NFκB transcriptional activation and apoptosis.32 ,51 ,52 Several anti-inflammatory drugs such as methotrexate can activate 5' AMP-activated protein kinase (AMPK)53 a key regulator of energy metabolism and glucose homoeostasis. Deactivation of AMPK has been shown to increase mitochondrial dysfunction, whereas activation results in a decrease in activation of NFκB, HIF1α and TNFα production.54 ,55
To examine if metabolic reprogramming can inhibit proinflammatory mechanisms, cells were treated with 3PO, which is a cell-permeable dipyridinyl-propenone compound that selectively blocks PFK-2 (6-phosphofructo-2-kinase) activity of PFKFB3 isozyme over PFK-1 (6-phosphofructo-1-kinase). 3PO rapidly decreases fructose-2,6-bisphosphate, 2-deoxyglucose uptake and lactate secretion and inhibits cell proliferation and growth. In this study 3PO inhibited RASF invasion/migration, angiogenesis and proinflammatory cytokines under normoxic and hypoxic conditions. Previous studies examining 3PO showed that PFKFB3 is required for angiogenesis, vessel branching, cell migration and the formation of filopodia/lamellipodia through cytoskeletal rearrangement,56–58 however this is the first study to demonstrate the effects of 3PO on proinflammatory mechanisms in RASF. Furthermore we showed that 3PO differentially inhibited HIF1α, pSTAT3 and Notch-1IC, which have been demonstrated both in vitro and in vivo to be key transcriptional factors involved in mediating hypoxia-induced inflammation in RA.14 ,15 Hypoxia is known to potentiate NFκΒ, Jak-STAT, Notch-1IC signalling via HIF1α activation and prolyl hydroxylase domain (PHD) suppression, an effect that results in a positive feedback loop on HIF1α activation.13–16 ,59–61 Furthermore we have shown in the RA joint a functional link between HIF1α, STAT3 and Notch-1 signalling in the regulation of proinflammatory mechanisms,14 ,15 thus demonstrating complex transcriptional crosstalk within the inflamed joint. Therefore one could hypothesise that reprogramming metabolism with 3PO, could result in reduced accumulation of metabolic intermediates, an increase in oxygen levels, inhibition of transcriptional activation with subsequent resolution of inflammation.
In summary, we have shown that hypoxia alters cellular bioenergetics by downregulating mitochondrial respiration, promoting a switch to glycolysis in the inflamed joint. This may enable synovial cells to generate sufficient ATP to support enhanced synovial proliferation and pannus formation an effect that can be reversed through metabolic reprogramming.
Acknowledgments
The authors thank Dr Walsh and Dr Harty for patient recruitment.
References
Footnotes
Handling editor Tore K Kvien
MB and MC are joint first authors.
Twitter Follow Mary Canavan at @mary_canavan
Contributors MB, MC, TMcG, WG, JM, SC, LG, TS, CTN, UF, JJP, UF conducted experiments, analysis of data and manuscript preparation. UF, DJV, MB, MC, JOS participated in the data analysis and interpretation and manuscript preparation. UF, DJV, MB, MC and JOS participated in the study design. UF and DJV supervised the research. DJV and CTN recruited all patients, performed the arthroscopies, measured the in vivo pO2 levels and provided all clinical information. JR created MRI/PET hybrid images and designed the imaging programme. DJV, UF, CTN and JR interpreted MRI and PET image data. All authors read and approved the final manuscript.
Funding This work was supported by the Health Research Board of Ireland, the Programme for Research in Third Level Institutions (PRTLI), Ireland and the EU-IMI programme ‘BeThe Cure’ (grant number 4379-2422-R13798).
Competing interests None declared.
Ethics approval St. Vincent's Healthcare Group Medical Research and Ethics Committee.
Provenance and peer review Not commissioned; externally peer reviewed.