Article Text

Abstract
Objectives: To evaluate the effect of orally administered methotrexate (MTX) on the density of CC chemokine receptor 2 (CCR2) and CXC chemokine receptor 3 (CXCR3) on circulating monocytes, and the coexpression of CXCR3 and CCR2 on CD4 T lymphocytes in patients with active chronic rheumatoid arthritis.
Methods: All 34 patients with rheumatoid arthritis fulfilled the 1987 American Rheumatism Association criteria and were followed for 16 weeks after starting MTX. Peripheral blood mononuclear cells were analysed for CCR2 and CXCR3 density by three-colour flow cytometry before initiation of MTX and at week 12.
Results: 22 (65%) patients were non-responders, 12 (35%) patients responded to MTX by American College of Rheumatology (ACR)20% criteria, and 8 (24%) of these patients responded by ACR50%. In patients with active rheumatoid arthritis before starting MTX, CCR2 density on circulating monocytes, CD4+ CXCR3+ and CD4+ CXCR3− T lymphocytes was increased compared with controls. During 12 weeks of MTX treatment, the CCR2 density on monocytes decreased significantly in the ACR50% group but not in the ACR20% and non-responder groups. The increased CCR2 density on CD4+ CXCR3+ and CD4+ CXCR3− T lymphocytes was unaffected by the reduction in disease activity measured in relation to MTX treatment. The percentage of both monocytes and CD4+ CXCR3+ and CD4+ CXCR3− T lymphocytes among the peripheral circulating mononuclear cells did not change during MTX treatment.
Conclusions: Active chronic rheumatoid arthritis is characterised by enhanced CCR2 density on circulating monocytes and CD4+ CXCR3+ and CD4+ CXCR3− T lymphocytes. During MTX treatment, a decrease in CCR2 density on monocytes in the ACR50% responder group was associated with decreased disease activity. The increased CCR2 density on CD4+ CXCR3+ and CD4+ CXCR3− T lymphocytes was uninfluenced by MTX and disease activity.
- ACR, American College of Rheumatology
- CCR2, CC chemokine receptor 2
- CXCR3, CXC chemokine receptor 3
- DMARD, disease-modifying anti-rheumatic drug
- IgM-RF, rheumatoid factor
- MCP1, monocyte chemoattractant protein 1
- MTX, methotrexate
- MWR, Mann–Whitney rank sum test
- WSR, Wilcoxon’s signed rank test
Statistics from Altmetric.com
- ACR, American College of Rheumatology
- CCR2, CC chemokine receptor 2
- CXCR3, CXC chemokine receptor 3
- DMARD, disease-modifying anti-rheumatic drug
- IgM-RF, rheumatoid factor
- MCP1, monocyte chemoattractant protein 1
- MTX, methotrexate
- MWR, Mann–Whitney rank sum test
- WSR, Wilcoxon’s signed rank test
In active chronic rheumatoid arthritis, CC chemokine receptor 2 (CCR2) and CXC chemokine receptor 3 (CXCR3), as well as their ligands, have been localised to the inflamed joint and to circulating immune-competent cells.1,2,3,4,5,6,7,8,9,10,11,12,13
In pharmacological studies, a CCR2 antagonist (monocyte chemoattractant protein 1 (MCP1; CCL2[9–76]) limits development of synovitis in adjuvant-induced arthritis in the MRL-lpr mouse.14 In a collagen-induced arthritis model, another group showed that blockade of CCR2 reduced clinical signs of inflammation as well as erosions during the first 15 days, but from day 21 to 36 aggravated clinical signs of inflammation were observed.15
CCR2 has also been postulated to have a protective role in rheumatoid arthritis, as collagen-induced arthritis in CCR2-null mice develops into erosive inflammatory joint disease.16 In addition, neutralising anti-MCP1 antibodies in a rodent arthritis model reduce inflammation.17
In a recent human placebo-controlled study, the effect of neutralising anti-MCP1 antibodies was evaluated without a convincing clinical effect on inflammation; data on this have been published so far only as an abstract.18 Recently, CCR2 and CXCR3 have been described as potential inducers of angiogenesis in vitro and in vivo.2,19–,21
Several studies have shown that CXCR3 is expressed on the Th1 subset of CD4 T lymphocytes and that CCR2 is expressed in both Th1 and Th2 subsets.15,22–,30
In the mouse, neutralising anti-CXCR3 antibodies inhibit the recruitment of Th1 cells to the inflammatory site.31 Recently, it has been shown that CD4 T lymphocytes infiltrating the rheumatoid synovium are CXCR3 positive, indicating that CXCR3 is important for the recruitment of CD4 T lymphocytes to the joint.32 So far, these animal studies have described the CCR2 system as both pro-inflammatory and anti-inflammatory, whereas CXCR3 is considered to be pro-inflammatory.
It is well known that treatment with methotrexate (MTX) in rheumatoid arthritis decreases the level of chemokines and cytokines, reduces circulating levels of rheumatoid factor (IgM-RF), modulates several enzymes, and inhibits cell proliferation, macrophage activity and neoangiogenesis.10,33–,43
It is still not known how densities of CCR2 and CXCR3 on monocytes are influenced by MTX or other anti-inflammatory treatments. In rheumatoid arthritis, coexpression of CCR2 and CXCR3 on CD4 T lymphocytes has so far not been described.
The purpose of this study was to examine the densities of CCR2 and CXCR3 on both circulating monocytes and CD4 T lymphocytes, and to evaluate the effect of MTX treatment in patients with active chronic rheumatoid arthritis.
PATIENTS AND METHODS
Patients, assessment of disease activity and dose escalation
All included patients fulfilled the American Rheumatism Association criteria of 1987 for rheumatoid arthritis.44 The 37 patients with rheumatoid arthritis included 27 women and 10 men, with an age range of 30–77 years, and median and mean ages of 54 years each. IgM-RF positivity was seen in 28 (76%) patients; 34 patients had erosive disease. Disease duration varied from 0.25 to 45 years, with a median of 11.5 years.
Before MTX treatment was started, the patients had a 4-week period of washout if they had previously received other disease-modifying anti-rheumatic drugs (DMARDs). Previous treatments were as follows: 12 patients had not previously received any DMARD, 17 had received one DMARD, 4 had received two DMARDs and another 4 had been treated with ⩾3 DMARDs (MTX, salazopyrin, myocrisin, penicillamin, auranofin and hydroxychlorokin). Disease activity was assessed by the swollen joint count (the European League Against Rheumatism 28 joint count and ankles and the 10 metatarsophalangeal joints, adding up to a maximum of 40) and the tender joint count (the European League Against Rheumatism 28 joint and hips, ankles and the 10 metatarsophalangeal joints, adding up to a maximum of 42),45 global assessment of disease activity by the doctor on a 5-point verbal rating scale, and global assessment of disease activity by the patient, scored by a numerical rating scale (0–10). All patients completed the Stanford Health Assessment Questionnaire46 for functional activity and pain assessment scored on a numerical rating scale (0–10). Dose adjustment of MTX was based on disease activity and adverse events, aiming at remission.
The same doctor was responsible for the assessment of disease activity at weeks 0 and 16 in all patients. This assessment and the decision concerning MTX dose adjustment were taken blinded to patient results. The doctor responsible for MTX dose adjustment was allowed to add low-dose prednisone while awaiting response to MTX. Table 1⇓ lists the parameters used to assess disease activity.
Disease activity parameters of the patients, according to American College of Rheumatology response
We observed no difference in the MTX or prednisone dose between the ACR50% and ACR20% responders and the non-responders. The mean (range) MTX dose values at weeks 0 and 16 were 7.7 (5–10) and 9.3 (5–15) mg in the MTX non-responder group, 7.5 (7.5–7.5) and 6.9 (5–7.5) mg in the MTX ACR20% responder group and 7.5 (5–10) and 8.9 (5–10) mg in the MTX ACR50% responder group, respectively. The mean (range) prednisone dose values at weeks 0 and 16 were 5.2 (0–15) and 5.1 (0–20) mg in the MTX non-responder group, 1.9 (0–7.5) and 1.9 (0–7.5) mg in the ACR20% response group and 5 (0–15) and 4.6 (0–20) mg in the ACR50% response group, respectively.
Response to MTX was evaluated according to the ACR criteria for improvement in rheumatoid arthritis.47,48 According to this definition, 12 patients responded to MTX by ACR20% and eight of these patients by ACR50%; 22 patients were non-responders 16 weeks after onset of treatment.
Three of the 37 patients were excluded from the study after a few weeks: of these, a 55-year-old man and a 30-year-old woman developed serositis and fulfilled the criteria for systemic lupus erythematosus before week 16, and a 50-year-old man developed cutaneous psoriasis and pericarditis. Data from these three patients are not included in the evaluations.
Flow cytometry was also performed in 9 healthy people, 4 men and 5 women (median age 41 years, mean age 42.3 years and range 33–61 years).
The patients with rheumatoid arthritis were recruited at the Department of Rheumatology, Århus University Hospital, Århus C, Denmark, from March 1996 to December 1999. The study was performed according to the principles of the Declaration of Helsinki. The national and local ethics committees approved the protocol. All patients gave written informed consent.
cell separation
The peripheral blood mononuclear cells were isolated from heparinised venous blood immediately after sampling from patients and controls. The cells were isolated by density gradient centrifugation using Histopaque 1077 (Sigma, Providence, Rhode Island, USA). The peripheral blood mononuclear cells were collected from the interface. They were washed three times by centrifugation at 400 g for 15 min in RPMI 1640 medium without l-glutamine (Pharmacia, Monsanto, Sweden), supplemented with penicillin (10 000 U/l) and streptomycin (10 000 μg/l; Sigma), counted, frozen slowly according to a standard freezing procedure and stored at −140°C.49
Flow cytometry
A FACScan flow cytometer (Becton-Dickinson, Mountain View, California, USA) was used for flow cytometric assessment of phenotypical markers and acquiring usually 10 000 events, live gating for side scatter low, CD45 bright events. Three-colour fluorescence was detected using the logarithm of amplification and live compensation for spectral overlap. Debris was excluded by back gating to CD45 cells in forward versus side scatter plots. Listmode gating of CD14, CD3 or CD4 was applied for subsets of cells together with specific analysis of CCR2 and CXCR3 density. Positively stained cells were defined by subtraction of non-specific immunoglobulin (Ig)G signals.
Flow cytometry of cells collected at weeks 0 and 12 was performed for each patient in one session of thawing, incubation and fixation of the cells, reducing day-to-day variation in the analysis for individual patients.
The staining protocol was a three-colour design using fluorochrome-conjugated monoclonal mouse antibodies (table 2⇓). The protocol included incubation for 30 min at 4°C at concentrations recommended by the manufacturers (Becton-Dickinson and R&D Systems, Abingdon, UK), followed by fixation in 0.1 M paraformaldehyde phosphate-buffered saline, pH 7.4. Monoclonal antibodies were all purchased from Becton-Dickinson or R&D Systems. Avidin–fluorescein isothiocyanate was purchased from R&D Systems.
Flow cytometry staining protocol
Routine procedures
C reactive protein, haemoglobin, leucocyte total and differential count (Coulter counter), thrombocyte count, alanine aminotransferase, alkaline phosphatase and creatinin were routinely measured every 4 weeks, initially every 2 weeks for 2 months. The measurements were carried out at the Department of Biochemical Chemistry, Århus University Hospital, Århus C, Denmark. IgM-RF was measured at the Department of Clinical Immunology, Århus University Hospital, according to routine procedures described previously.38
Statistics
The Mann–Whitney rank sum test (MWR) and t test, Wilcoxon’s signed rank test (WSR) and paired t test were used to compare two groups of data: either MTX responders with MTX non-responders, or data at baseline (week 0) with data at week 12. The non-parametric tests were used when normality failed. When comparing percentages of subtypes of mononuclear cells, non-parametric tests were used. Linear regression analyses were used to assess the correlation between parameters in the assessment of flow cytometric reproducibility and disease activity parameters. Significance was defined at the 5% level.
RESULTS
Cell viability before flow cytometry
Viability was assessed by toluidine blue staining after thawing and before incubation with antibodies for flow cytometry. The staining showed a median (range) of 66% (32–89%) viable cells before MTX treatment and 70% (35–96%) viable cells after 12 weeks of treatment.
Reproducibility of the flow cytometric data
Reproducibility was evaluated by plotting the percentage of CD45+ CD3+ CD14− cells as ordinate against separately determined (CD3+ frequency of all acquired cells) peridinin (CD45 frequency of all cells) as coordinate (fig 1A⇓). Linear regression analyses were used to assess the correlation between these (r = 0.62, p<0.001). The percentage of CD3+ CD4+ cells as ordinate was plotted against separately determined (CD4+ frequency of all acquired cells) peridinin (CD3+ frequency of all cells) as coordinate, and linear regression analyses were used to assess the correlation between them (r = 0.41, p<0.001).

Initial scatter gating strategy (CD3− CD14+ cells) exemplified in one patient by a dot plot of CC chemokine receptor 2 (CCR2) density at weeks 0 (red) and 12 (blue). The negative control is green. PE, phycoerythin; PerCP, peridinin–chlorophyll protein; SSC, side scatter plot.
The percentage of CD45+ CD14+ CD3− cells was plotted as the ordinate against separately determined (CD14+ frequency of all acquired cells) peridinin (CD45+ frequency of all cells), and linear regression analysis was used to assess the significant correlation between them (r = 0.61, p<0.001). To evaluate whether the signal from anti-CCR2–phycoerythrin in CD45 CD14 cells fluctuated with the background IgG–phycoerythrin signal in the same subset, linear regression was performed with the anti-CCR2–phycoerythrin median signal as ordinate and the IgG–phycoerythrin signal as coordinate; we observed no significant linear relationship (r = 0.01 p = 0.91). The percentage of CD14 cells was plotted as the ordinate against the percentage of the CD4dim cells, and linear regression analysis was used to assess the significant correlation between them (r = 0.65, p<0.001). The CD14 CCR2−phycoerythrin median signal was plotted as the ordinate against the CD4dim CCR2–phycoerythrin median signal, and linear regression analysis was used to assess the significant correlation between them (r = 0.78, p<0.001).
These significant correlations illustrate different aspects of reproducibility in the flow cytometric evaluation. Further aspects of reproducibility of the flow cytometric evaluation have been determined recently. Briefly, we found coefficients of variation between 6.9% and 9.9% in repetitive assessments of the percentage of CD3− CD14+ cells, CD3+ CD14− cells and CD3+ CD4+ cells.
Evaluating the CCR2 density on the CD14+ subset of peripheral mononuclear cells (monocytes)
The initial scatter gating strategy (CD3− CD14+ cells, referred to as monocytes) is exemplified in one patient by a dot plot of CCR2 density at weeks 0 and 12 (fig 1⇑).
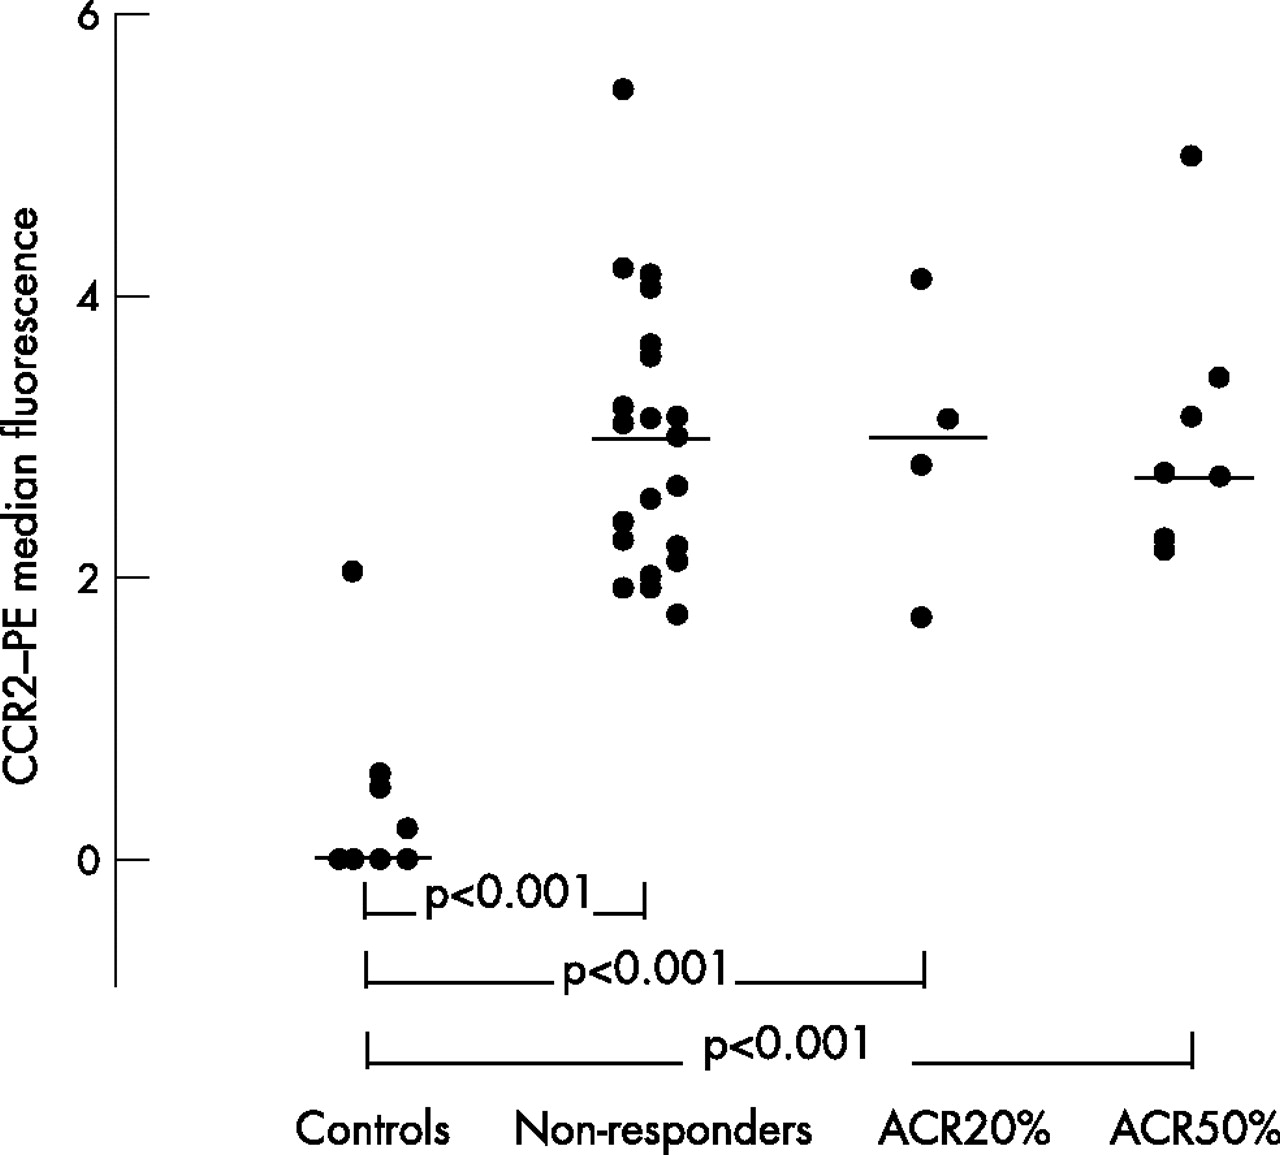
The CCR2 density on monocytes (median values) in the ACR non-responders (n = 22) and ACR50% responders (n = 8) compared with controls was significantly raised (MWR in both cases, p<0.001). CCR2 density on monocytes in the ACR20% only responder group (n = 4) was not significantly raised compared with controls (t test, p = 0.19; fig 2⇓).

In the American College of Rheumatology (ACR)50% and the non-responder groups of patients with rheumatoid arthritis, increased density of CC chemokine receptor 2 (CCR2) is seen on monocytes at week 0 (p<0.001). The expression in the ACR50% responder group was increased compared with the non-responders and decreased significantly as a result of treatment with methotrexate (p = 0.019). Median values marked by horizontal lines. PE, phycoerythin.
In the ACR50% responder group, the CCR2 density on monocytes decreased during 12 weeks of MTX treatment (p = 0.019). The CCR2 density on monocytes in the ACR non-responders and in the ACR20% only responders did not decrease significantly after 12 weeks compared with that before treatment (WSR, p = 0.08; and paired t test, p = 0.65; table 3⇓).
Fluorescence density of CC chemokine receptor 2 and CXC chemokine receptor 3 evaluated by flow cytometry
Comparing the CCR2 density on monocytes (median values) between the ACR non-responders and the ACR20% only or ACR50% responders, we found increased density in the ACR50% responders (MWR, p = 0.03) but not in the ACR20% only responders (MWR, p = 0.46). Comparing the percentage of CCR2+ monocytes at week 0 with that at week 12 in the three groups of patients (paired t test, p = 0.29–0.56), we found that the percentage of CCR2+ monocytes did not change as an effect of treatment. Summarising the results regarding CCR2 density on monocytes, we found increased density of CCR2 in both the 22 ACR non-responders and the 8 ACR50% responders but not in the 4 ACR20% only responders compared with the healthy controls. CCR2 density on monocytes was down regulated during MTX treatment in the ACR50% responders. The ACR50% responders exhibited an increased density of CCR2 before MTX treatment compared with the ACR non-responders. The percentage of CCR2+ monocytes among the circulating mononuclear cells did not change after onset of MTX treatment.
Evaluating the CXCR3 density on the CD4+dim subset of peripheral mononuclear cells (monocytes)
On comparing the CXCR3 density on monocytes (median values) in healthy controls and the ACR non-responders, and in the ACR20% only responders and ACR50% responders before starting MTX treatment, no difference was found (MWR p values between 0.58 and 0.88).
The CXCR3 density on monocytes in the three groups of patients did not change (WSR and paired t test p values between 0.49 and 0.83) during MTX treatment.
We found no significant difference on comparing the CXCR3 density on monocytes (median values) between the ACR non-responders and the ACR20% only responders and the ACR50% responders before starting MTX treatment (MWR p = 0.49 and p = 0.29; table 3A–C⇑).
The percentage of CXCR3+ monocytes did not change as an effect of treatment comparing the percentage at week 0 with that at week 12 in the three groups of patients (paired t test p values between 0.49 and 0.56).
Summarising the results regarding CXCR3 density on monocytes, we did not find increased density compared with that in controls, and we could not differentiate the responders and non-responders on the basis of CXCR3 density. The percentage of CXCR3+ monocytes also did not change as an effect of treatment.
Evaluating the CCR2 and CXCR3 density on the CD4 subset of peripheral mononuclear cells
Comparing the anti-CCR2–phycoerythrin median signal of CD4+ CXCR3+ and CD4+ CXCR3− cells in the three groups at weeks 0 and 12, we found significantly higher levels of CCR2 density in the CD4+ CXCR3+ subset of cells compared with that in the CD4+ CXCR3− subset (all cases, p<0.001, t test; table 2⇑). In controls, comparing anti-CCR2–phycoerythrin median signals in the same cellular subsets, we found no significant difference (in 5/9 controls, we could not detect any CCR2 signal on the CD4+ CXCR3+ subset; in all 9 controls we could not detect any CCR2 signal on the CD4+ CXCR3− subset; MWR, p = 0.11).
The anti-CCR2–phycoerythrin median signal in the CD4+ CXCR3+ and CD4+ CXCR3− subsets was significantly higher in the three groups of patients compared with the controls (all cases, t test, p<0.001). We observed no change in the anti-CCR2 staining density as an effect of treatment on the CD4+ CXCR3+ and the CD4+ CXCR3− cells in the three groups of patients (WSR and paired t test, p = 0.46–0.84; table 3⇑).
We observed no difference in CCR2 expression on the CD4+ CXCR3− and CD4+ CXCR3+ subsets on comparing the ACR non-responders with the ACR20% only responders and the ACR50% responders (t test, p = 0.78–0.93).
The percentage of CD4+ CXCR3+ and CD4+ CXCR3− T lymphocytes did not decrease after the onset of MTX treatment in the three groups of patients (paired t test, p = 0.36–0.41). In summary, CCR2 density on CD4+ CXCR3+ and CD4+ CXCR3− T lymphocytes was unaffected by MTX treatment.
In both MTX responders and non-responders, we found increased staining intensity by anti-CCR2–phycoerythrin on CD4+ CXCR3+ T lymphocytes compared with CD4+ CXCR3− cells at weeks 0 and 12. This CCR2 density was further increased compared with controls in all three groups of patients. The percentage of CD4+ CXCR3+ and CD4+ CXCR3− T lymphocytes did not decrease after the onset of MTX treatment.
DISCUSSION
In patients with active chronic rheumatoid arthritis, MTX treatment caused a decline in the increased CCR2 density on monocytes in the ACR50% responder group (table 2⇑). In MTX non-responders and the ACR20% only responders, we did not observe this decline, although the non-responders had increased CCR2 density (table 3⇑, fig 2⇑). Interestingly, CCR2 density on monocytes in the ACR50% responders was markedly raised compared with the non-responders before MTX was initiated. This shows that CCR2 expression on monocytes potentially indicates MTX response in chronic active rheumatoid arthritis; we report the first observation of this phenomenon in humans.
A central role for CCR2 and its ligand MCP1 has been shown in animal models, and recently CCR2 has been localised within the synovium of chronic rheumatoid arthritis.13,15–17,50,51
In a recent study on patients with lupus flares, Amoura et al52 found no major difference in CCR2 density on monocytes compared with controls. However, rheumatoid arthritis and lupus are pathogenetically different autoimmune diseases. This difference between rheumatoid arthritis and lupus further indicates that our observation regarding increased CCR2 density on monocytes in patients with rheumatoid arthritis could be important in understanding disease pathogenesis.
The ability of MTX to reduce the CCR2 density on circulating monocytes in patients with rheumatoid arthritis adds to our understanding of MTX pharmacodynamics. We consider the reduction in CCR2 density on monocytes with 75% reduction during 12 weeks of treatment to be clinically relevant.
We observed no difference between the three groups of patients regarding age, sex, IgM-RF positivity, disease activity at onset of treatment and cell viability. Still, although statistically significant, our observation is based on only 34 patients with rheumatoid arthritis.
The reduction in CCR2 density on monocytes is further consolidated, considering the low coefficients of variation in the flow cytometric evaluation. To eliminate day-to-day variation in the flow cytometric analysis, we decided to perform the flow cytometry for each patient on the same day, necessitating a freeze–thaw cycle. This further eliminates the problem of potential fading of the fluorochromes used, as data from cells before and after MTX treatment were compared on the same day.
The CXCR3 density on monocytes was uninfluenced by MTX treatment and disease activity, and was not increased compared with that in controls. We have shown that, as expected, the CD4dim fraction of the mononuclear cells correlates with the CD3− CD14+ fraction of mononuclear cells. Further, these two subsets of mononuclear cells have the same staining intensity when comparing the CCR2–phycoerythrin intensities. In the evaluation of CXCR3 density on monocytes, we used the CD4dim density as a monocyte/macrophage marker, as CD4 is expressed on virtually all cells of the monocyte/macrophage lineage, although with less intensity than in CD4 T lymphocytes.53,54
It is well established that CD4 T lymphocytes can be divided into two subsets by their ability to produce and secrete specific cytokines, T helper (Th)1 (producing interferon γ) and Th2 (producing interleukins 4 and 5), and both subsets are involved in cell-mediated autoimmunity in patients with rheumatoid arthritis.25–,28 The patterns of chemokine receptor expression by Th1 and Th2 subsets of CD4 T lymphocytes have not been uniform in several reports, although CXCR3 seems to relate to the pro-inflammatory Th1 subset.22–24,30,55
In all the three groups of patients with rheumatoid arthritis (non-responders, and ACR20% and ACR50% responders), we found a higher density of CCR2 on CD4+ CXCR3+ cells than on CD4+ CXCR3− cells at initiation of treatment and at week 12 (table 3⇑, figs 3⇓ and 4⇓). This density was further raised compared with that in controls.
All three groups of patients showed increased intensity of the anti-CC chemokine receptor 2 (CCR2)–phycoerythrin (PE) signal on CD4+ CXCR3+ T lymphocytes compared with CD4+ CXCR3− cells at weeks 0 and 12 (p<0.001). This CCR2 density was further increased compared with controls in all three groups of patients (p<0.001). Median values are marked by horizontal lines.

All three groups of patients showed decreased intensity of the anti-CC chemokine receptor 2 (CCR2)–phycoerythrin (PE) signal on CD4+ CXCR3− T lymphocytes compared with CD4+ CXCR3+ cells at weeks 0 and 12. However, this CCR2 density was still increased compared with controls in all three groups of patients. Median values are marked by horizontal lines.
The presence of CCR2 on both Th1 and Th2 subsets of CD4 T lymphocytes has been described recently; both subsets responded to MCP1 by chemotaxis in vitro.24,29,56
Our observation that CCR2 density on CD4+ CXCR3+ T lymphocytes is markedly higher than that on the CD4+ CXCR3− cells indicates that the migration of the Th1 subset of CD4 T lymphocytes to the inflamed joint is facilitated by both CCR2 and CXCR3 ligands in the synovial fluid.8,12 This is further strengthened by the observation that CD4 T lymphocytes in the inflamed synovium of patients with rheumatoid arthritis are CXCR3+.32 Blocking CXCR3 with neutralising antibodies reduces Th1 lymphocyte migration to inflammatory sites in the mouse.31
We have previously described that MCP1, the ligand of CCR2, is correlated with swollen joint counts in patients with severe active rheumatoid arthritis,8 and this is in good agreement with our present observation that CCR2 is up regulated on both monocytes, CD4+ CXCR3+ and CD4+ CXCR3− T cells in patients with chronic rheumatoid arthritis.
In animal models, MCP1 was injected into joints or its effect was blocked by neutralising antibodies or CCR2 antagonists, and the results suggest a role for CCR2 in the development of arthritis.14,57,58 However, one study suggested that CCR2 may be preventive in the development of rheumatoid arthritis.16
Whether CCR2 has a pro-inflammatory role has been questioned in recent studies.15,16 In one model, the CCR2-knockout mouse surprisingly developed a clinically more severe and erosive arthritis than the control wild type.16 In the other model, the collagen-induced arthritis in mice, antibodies towards CCR2 were injected early or at the time of the collagen booster, resulting in either suppression of inflammation or exacerbation.15 These somewhat contradictory results should be interpreted cautiously. One explanation could be that CCR2+ T cells in established disease possess a beneficial regulatory potential.
Our observation of initially raised CCR2 density on monocytes in the ACR50% responder group is associated with response to MTX treatment. This strengthens our hypothesis that the MCP1/CCR2 system is pathogenically interesting in patients with chronic rheumatoid arthritis.
Acknowledgments
We thank Lis Lund, Peter Jøhnk and Inger Bjerregaard for skilled laboratory assistance.
REFERENCES
Footnotes
Published Online First 11 August 2006
Funding: This study was supported by the Danish Rheumatism Association, the Institute of Clinical Experimental Research, Århus University, the Frølund Nielsen Foundation, the Foersom Foundation and the Yde Foundation.
Competing interests: None declared.