Article Text

Abstract
Objective To determine whether anticitrullinated protein antibodies (ACPA) exhibit specific changes in Fc glycosylation prior to the onset of arthritis.
Methods Serum samples of patients with ACPA-positive arthralgia (n=183) were collected at baseline and at various time points of follow-up. 105 patients developed arthritis after a median of 12 months (IQR 6–24) and were classified as having either rheumatoid arthritis (RA, n=48) or undifferentiated arthritis (UA, n=57) based on the 1987 American College of Rheumatology (ACR) criteria. ACPA and total serum IgG were isolated by affinity purification and cleaved by trypsin. ACPA-IgG1 Fc-glycopeptides were subsequently analysed by nano-liquid chromatography mass spectrometry and compared to those of total IgG1.
Results At baseline, ACPA-IgG1 and total IgG1 from arthralgia patients displayed similar Fc glycosylation patterns. By contrast, at the onset of arthritis, ACPA exhibited a decrease in galactose residues in RA patients, but not in UA patients. This decrease occurred around 3 months prior to diagnosis and was paralleled by an increase in systemic inflammation (erythrocyte sedimentation rate). Galactosylation of total IgG1 was also decreased in RA, but this did not precede the onset of arthritis. Interestingly, we additionally noted a higher degree of ACPA-IgG1 Fc core fucosylation at baseline as compared with total IgG1, which further increased prior to diagnosis.
Conclusions ACPA display significant changes in Fc galactosylation and fucosylation prior to the onset of RA. These changes towards a more pro-inflammatory phenotype could be involved in driving the disease process.
- Rheumatoid Arthritis
- Autoantibodies
- Inflammation
- Ant-CCP
Statistics from Altmetric.com
Introduction
Rheumatoid arthritis (RA) is an inflammatory disease characterised by chronic synovitis and erosive destruction of articular cartilage and bone. A subgroup of patients harbours antibodies targeting self-antigens. Among those, anticitrullinated protein antibodies (ACPA) exhibit remarkably high specificity for the disease and show a well-established association with a severe, erosive phenotype. Accumulating evidence suggests that ACPA could be involved in the disease process by enhancing inflammation and by specifically contributing to joint destruction through the activation of Fc-receptor positive cells including osteoclasts.1–5 Although the underlying mechanisms of this potential ACPA pathogenicity are incompletely understood, it is intriguing that ACPA can be present in asymptomatic individuals and in patients with joint pain (arthralgia) years before the onset of arthritis.6–9 In this early period, ACPA do not cause apparent pathology, indicating that, at a certain moment predisease, ACPA could acquire pathologic effector functions.10 This hypothesis of a quantitative and/or qualitative change of the citrulline-specific immune response is supported by an increase in ACPA levels, a spread in epitope recognition and isotype-usage as well as progressive avidity maturation before the onset of arthritis.11–14 Factors determining antibody effector functions could also be modified at this stage, eventually rendering ACPA pathogenic.
Early studies have shown that RA is associated with alterations in the glycosylation of serum IgG.15 ,16 Two N-linked, biantennary, complex-type carbohydrate structures are attached to the Fc part of IgG, each located at a conserved position (Asn297) in the constant region of the heavy chains. These Fc-linked N-glycans are often core-fucosylated and vary mainly in the number of galactose (Gal) residues, with the most prevalent glycoforms carrying no (G0), one (G1) or two galactose residues (G2). Additionally, a small proportion of the glycans may carry terminal sialic acid and/or bisecting N-acetylglucosamine (GlcNAc) residues. The two Fc-linked carbohydrates are interposed between the heavy chains and are crucial for the three-dimensional structure and biological activity of the antibody.17 ,18 Removal of the Fc glycans diminishes IgG Fc-mediated biological activity due to failure of the non-glycosylated molecule to bind to Fcγ-receptors (FcγR).19 ,20 Likewise, lack of core fucose and presence of bisecting GlcNAc residues both enhance IgG-mediated antibody-dependent cellular cytotoxicity (ADCC) due to a strong increase in affinity of the Fc-tail for FcγRIIIa.21–23 Additionally, Fc-linked glycans modulate activation of the complement cascade.24 ,25 Finally, more recent work demonstrated that terminal sialic acid and galactose residues can confer anti-inflammatory properties to IgG by modulating its interaction with the lectins DC-SIGN and Dectin-1.26–28
In RA, a lack of total IgG Fc galactosylation correlates strongly with disease activity and severity, and reverses to normal levels upon effective treatment.29–34 Despite these associations, it has been difficult to determine how and to what extent IgG Fc glycosylation changes contribute to inflammation in RA, rather than being a non-specific biomarker. In a mouse model, adoptive transfer of enzymatically agalactosylated serum containing anti-collagen type II-IgG molecules from arthritic mice can cause arthritis of enhanced severity in the recipients.35 Also, removal of sialic acid from pooled human serum IgG abolishes its anti-inflammatory effects when infused into mice.28 These findings show that changes in IgG Fc glycosylation can indeed modulate inflammation in vivo, but data so far available are insufficient evidence to conclude on the pathogenic relevance of IgG Fc glycosylation in human RA.
More detailed information on this question could be obtained from studying events very early in the process of disease development. Currently, however, little information is available on changes of IgG Fc glycosylation in RA patients before disease onset, and no data have been put forward on autoantibody-specific glycan profiles predisease. Based on these considerations, the pathogenic relevance of ACPA and our previous observation of ACPA-specific Fc glycosylation patterns in RA,36 we set out to study if (1) ACPA acquire specific Fc glycosylation patterns before the onset of arthritis, (2) if such qualitative changes predisease could predict disease development, and (3) if changes in ACPA Fc glycosylation occur prior to, after or simultaneously with systemic inflammation. Indeed, Fc glycosylation changes prior to detectable systemic inflammation and disease onset would support a model in which ACPA acquire pro-inflammatory properties driving the pathways that eventually result in arthritis.
Patients and methods
Patients and controls
Serum samples (n=302) were obtained from ACPA-positive patients with arthralgia (n=183) with a median ACPA serum titre of 419.0 U/mL (IQR 131.0–1216.0). For detailed patient characteristics see table 1. Patients with arthralgia were followed over time, with serum samples and clinical parameters being collected at intervals up to the development of clinically overt arthritis (defined as the presence of one or more swollen joints), as previously described.8 From the arthralgia patients included at baseline, n=105 had developed arthritis within a median of 12 months (IQR 6–24) at the time the present study was undertaken. Patients with arthritis were classified as having either RA (n=48) or undifferentiated arthritis (UA) (n=57) based on the 1987 American College of Rheumatology (ACR) criteria.37 All other patients were considered to have persistent arthralgia. Control samples (n=38) were obtained from healthy individuals age-matched and sex-matched to those arthralgia patients who developed arthritis with a time-interval of at least 13 months between baseline and arthritis onset. All patients and controls gave informed consent for participation in the study.
Baseline characteristics of the study population
Isolation of IgG and ACPA-IgG from human serum
Human polyclonal IgG molecules were isolated from 2 µL of serum by affinity chromatography.38 ACPA were purified by antigen affinity chromatography from 25 µL of serum using a modification of a pre-established protocol.36 ,39 Each serum sample was incubated for 1 h at 37°C on eight consecutive CCP2-coated ELISA wells (Immunoscan RA Mark 2, Eurodiagnostica) to obtain sufficient ACPA-IgG molecules. Following incubation with serum, each well was washed twice with phosphate buffered saline (PBS) and once with 25 mM ammonium bicarbonate. ACPA were then eluted using 50 µL of 100 mM formic acid (pro analysi for mass spectrometry; Merck). All eight ACPA eluates were pooled, dried in a vacuum centrifuge and subjected to tryptic digest by adding 200 ng trypsin (sequencing grade, Promega) in 40 µL ammonium bicarbonate buffer, followed by overnight incubation at 37°C.
IgG glycopeptide profiling
Trypsinised IgG (250 nL) and ACPA (5 µL) molecules were separated and analysed on an Ultimate 3000 HPLC system (Dionex Corporation, Sunnyvale, California, USA) coupled to a quadrupole-TOF-mass spectrometry (MS) mass spectrometer (micrOTOF-Q, Bruker Daltonics, Bremen, Germany) as previously described.40 Briefly, tryptic glycopeptides were extracted by a C18 solid phase extraction trap column (Dionex Acclaim PepMap100) and separated on a Ascentis Express C18 nano liquid chromatography (LC) column (Supelco, Bellefonte, USA) as described.40 The HPLC was coupled to the MS by a sheath-flow electrospray ionization (ESI) interface. Quality of mass spectra was evaluated based on intensities of total IgG1 glycoforms. Following quality control based on signal-to-noise ratio of signal intensities of glycopeptide ions and verification of ACPA status, samples from 11 patients were excluded from the analysis. This did not change the overall composition of the study population (table 1). In total, 87.2% of samples remained for further analysis. The degree of galactosylation (G), sialylation (S), fucosylation (F) and the frequency of bisecting N-acetylglucosamine (GlcNAc, N) residues of IgG1 were calculated as described.40 Briefly, the following formulas were used: galactosylation=(G1F+G1FN+G1FS+G1FNS+G1+G1N+G1S)*0.5+G2F+G2FN+G2FS+G2FNS+G2+G2N+G2S; fucosylation=G0F+G1F+G2F+G0FN+G1FN+G2FN plus;G1FS+G2FS; sialylation=G1FS+G2FS+G1FNS+G2FNS+G1S+G2S; bisecting GlcNAc residues=G0FN+G1FN+G2FN+G1FNS+G2FNS+G0N+G1N+G2N.
Statistical analysis
Data analysis was performed using IBM SPSS Statistics V.20.0 and Graph Pad Prism V.5.01 software packages. Differences in relative abundances of glycoforms obtained were evaluated for statistical significance using the non-parametric Kruskal–Wallis test followed by Dunn's posthoc test to adjust for errors introduced by multiple testing. In case of comparison of only two groups, the Mann–Whitney test was used. This is indicated where appropriate.
Results
ACPA-specific Fc galactosylation profiles at baseline
We first analysed Fc galactosylation of ACPA-IgG1 and total serum IgG1 in patients with arthralgia at baseline, that is, the moment of the patient's first presentation to the rheumatologist (figure 1A). To this end, we used a semi high-throughput procedure for antibody isolation followed by Fc N-glycopeptide profiling as outlined in figure 1B. Of note, this technique is not confounded by other glycans that might be linked to the IgG molecule, such as Fab-linked glycans. We report data on IgG1 Fc-glycopeptides in this study, as most patients harbour ACPA of the IgG1 subclass.41 ,42 Also, ACPA-IgG1 and total IgG1 showed much higher signal intensities of glycopeptide ions as compared to IgG2 and IgG4, suggesting predominant presence of the IgG1 isotype for ACPA and total IgG in our purified samples (data not shown).

(A) Schematic depiction of the anticitrullinated protein antibodies (ACPA) positive arthralgia cohort used in the study; UA, undifferentiated arthritis, RA, rheumatoid arthritis. (B) Representative mass spectrum of ACPA IgG1 Fc glycopeptides isolated from an arthralgia patient; pep, peptide moiety; m/z, mass/charge.
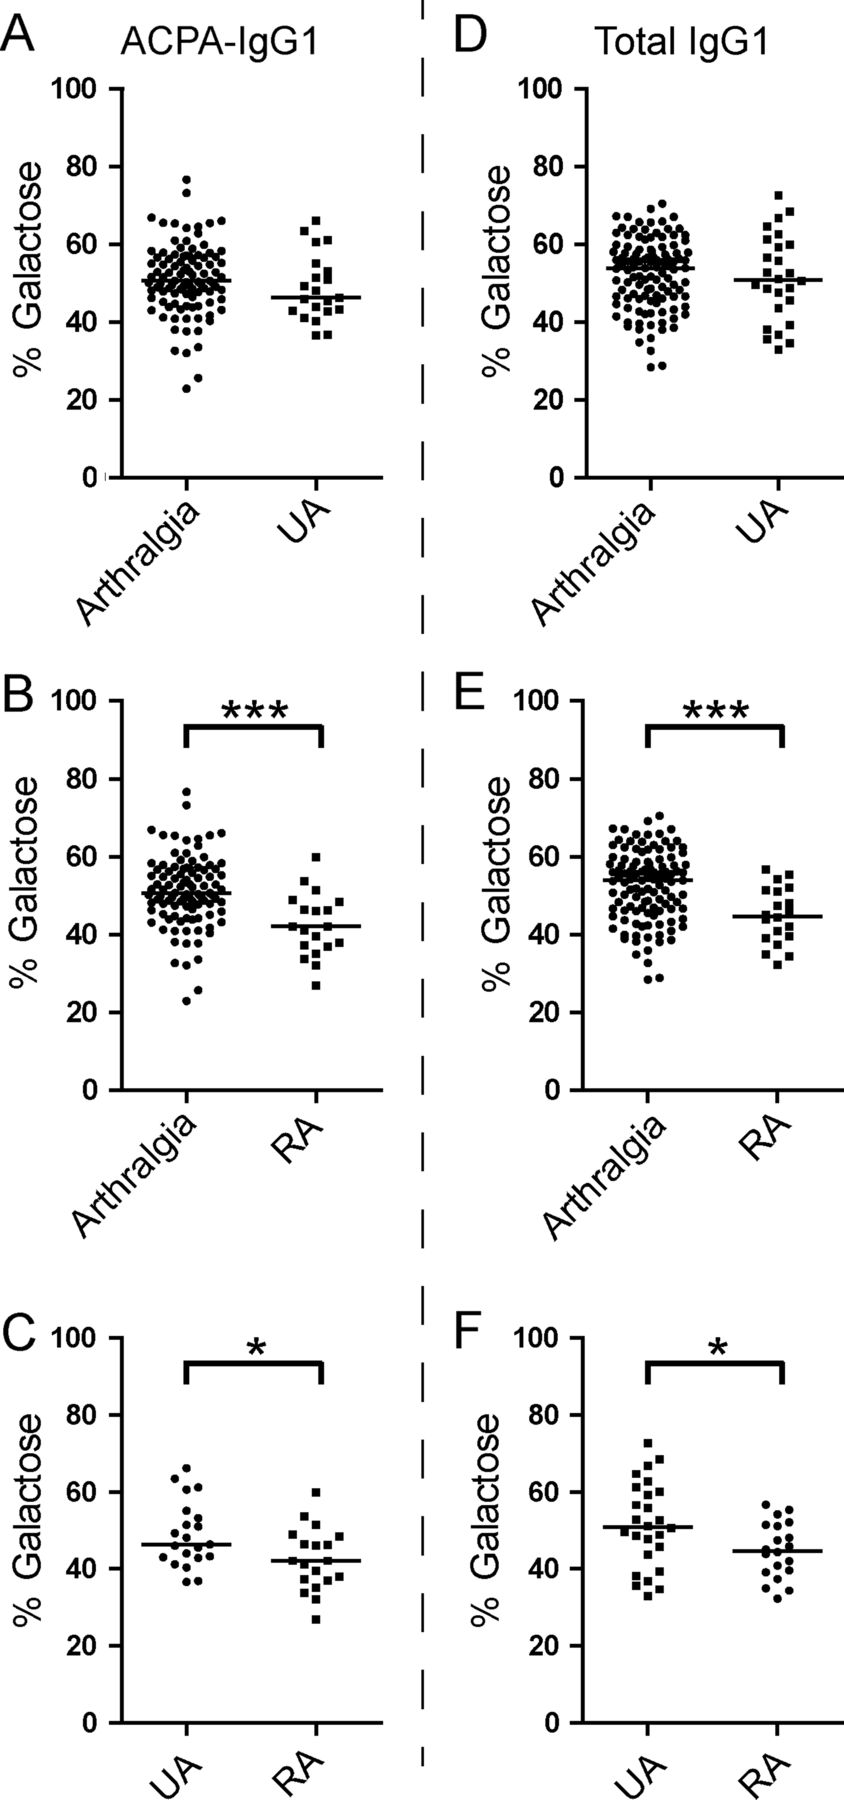
At baseline, ACPA-IgG1 and total IgG1 exhibited a similar degree of Fc galactosylation (figure 2A). No difference in ACPA-IgG1 and total IgG1 Fc galactosylation was found between arthralgia patients who would later develop arthritis (figure 2B), nor was a baseline difference detected between patients developing UA or RA (figure 2C). Furthermore, no significant differences were found at baseline between these groups with regard to the frequency of sialylated glycoforms or glycoforms carrying bisecting GlcNAc residues (data not shown). The Fc-galactosylation profile of total IgG1 was comparable with that of age-matched and sex-matched healthy controls (data not shown). Taken together, ACPA-IgG1 and total IgG1 isolated from arthralgia patients showed a comparable Fc glycosylation profile at baseline, irrespective of future disease development.

Fc galactosylation levels between ACPA-IgG1 and total IgG1 at baseline. (A) At baseline, similar Fc galactosylation levels were observed for total IgG1 and ACPA-IgG1 isolated from serum of arthralgia patients (median 53.9% (IQR 46.1–58.7) for total IgG1 and 50.6% (IQR 45.9–56.8) for ACPA-IgG1). Similarly, no significant differences were found for ACPA-IgG1 or total IgG1 Fc galactosylation between (B) patients presenting with persistent arthralgia and those who will develop arthritis (persistent arthralgia: median 54.3% (IQR 46.1–58.5) for total IgG1 and 51.6% (IQR 45.4–56.8) for ACPA-IgG1; future arthritis patients: 53.4% (IQR 46.3–59.0) for total IgG1 and 50.2% (IQR 47.4–56.9) for ACPA-IgG1), or between (C) patients who will be affected by undifferentiated arthritis (UA) and those who will present with rheumatoid arthritis (RA) (future UA: median 53.7% (IQR 45.2–57.3) for total IgG1 and 51.3% (IQR 48.5–57.3) for ACPA-IgG1; future RA: 49.7% (IQR 60.9–46.6) for total IgG1 and 49.2% (IQR 40.9–55.5) for ACPA-IgG1). Statistical analysis was performed using the non-parametric Mann–Whitney test for (A) and the non-parametric Kruskal–Wallis test followed by Dunn's posthoc test for (B and C).
ACPA-specific Fc galactosylation profiles at the onset of arthritis
Given the unaltered Fc galactosylation profiles at baseline, we next analysed whether the development of arthritis would be reflected by changes in Fc galactosylation on either ACPA-IgG1 or total serum IgG1. Of interest, patients presenting with symptoms classifying as RA, but not patients with UA, showed a significant reduction of ACPA-IgG1 Fc galactose residues when compared to baseline levels of arthralgia patients (figure 3A–C). This hypogalactosylation was also observed for total IgG1 (Figure 3D–F). Of note, we also observed a small but significant decrease of ACPA Fc-linked sialic acid content in RA patients as compared to arthralgia samples (see online supplementary figure S1B).

ACPA-IgG1 and total serum IgG1 Fc galactosylation profiles discriminate between rheumatoid arthritis (RA) and undifferentiated arthritis (UA) patients at the onset of arthritis. At the onset of arthritis, patients presenting with RA (B), but not those with UA (A), show a decrease of ACPA-IgG1 Fc galactosylation level compared to arthralgia patients at baseline (arthralgia at baseline: median 50.6% (IQR 45.9–56.8); UA at diagnosis: 46.3% (IQR 42.9–54.1); RA at diagnosis: 42.1% (IQR 36.9–48.4)). (C) Accordingly, a significantly lower percentage of ACPA-IgG1 Fc galactosylation is observed in RA patients as compared to UA patients. (D, E, F) A similar change was observed in the level of total IgG1 Fc galactosylation (arthralgia at baseline: median 53.9% (IQR 46.1–58.7); UA at diagnosis: 50.8% (IQR 42.6–60.3); RA at diagnosis: 44.7% (IQR 39.2–51.3)). Statistical differences were evaluated using the non-parametric Mann–Whitney test; * and *** represent a p value <0.05 or a p value <0.0005, respectively.
Changes in ACPA Fc galactosylation precede disease onset in patients with RA
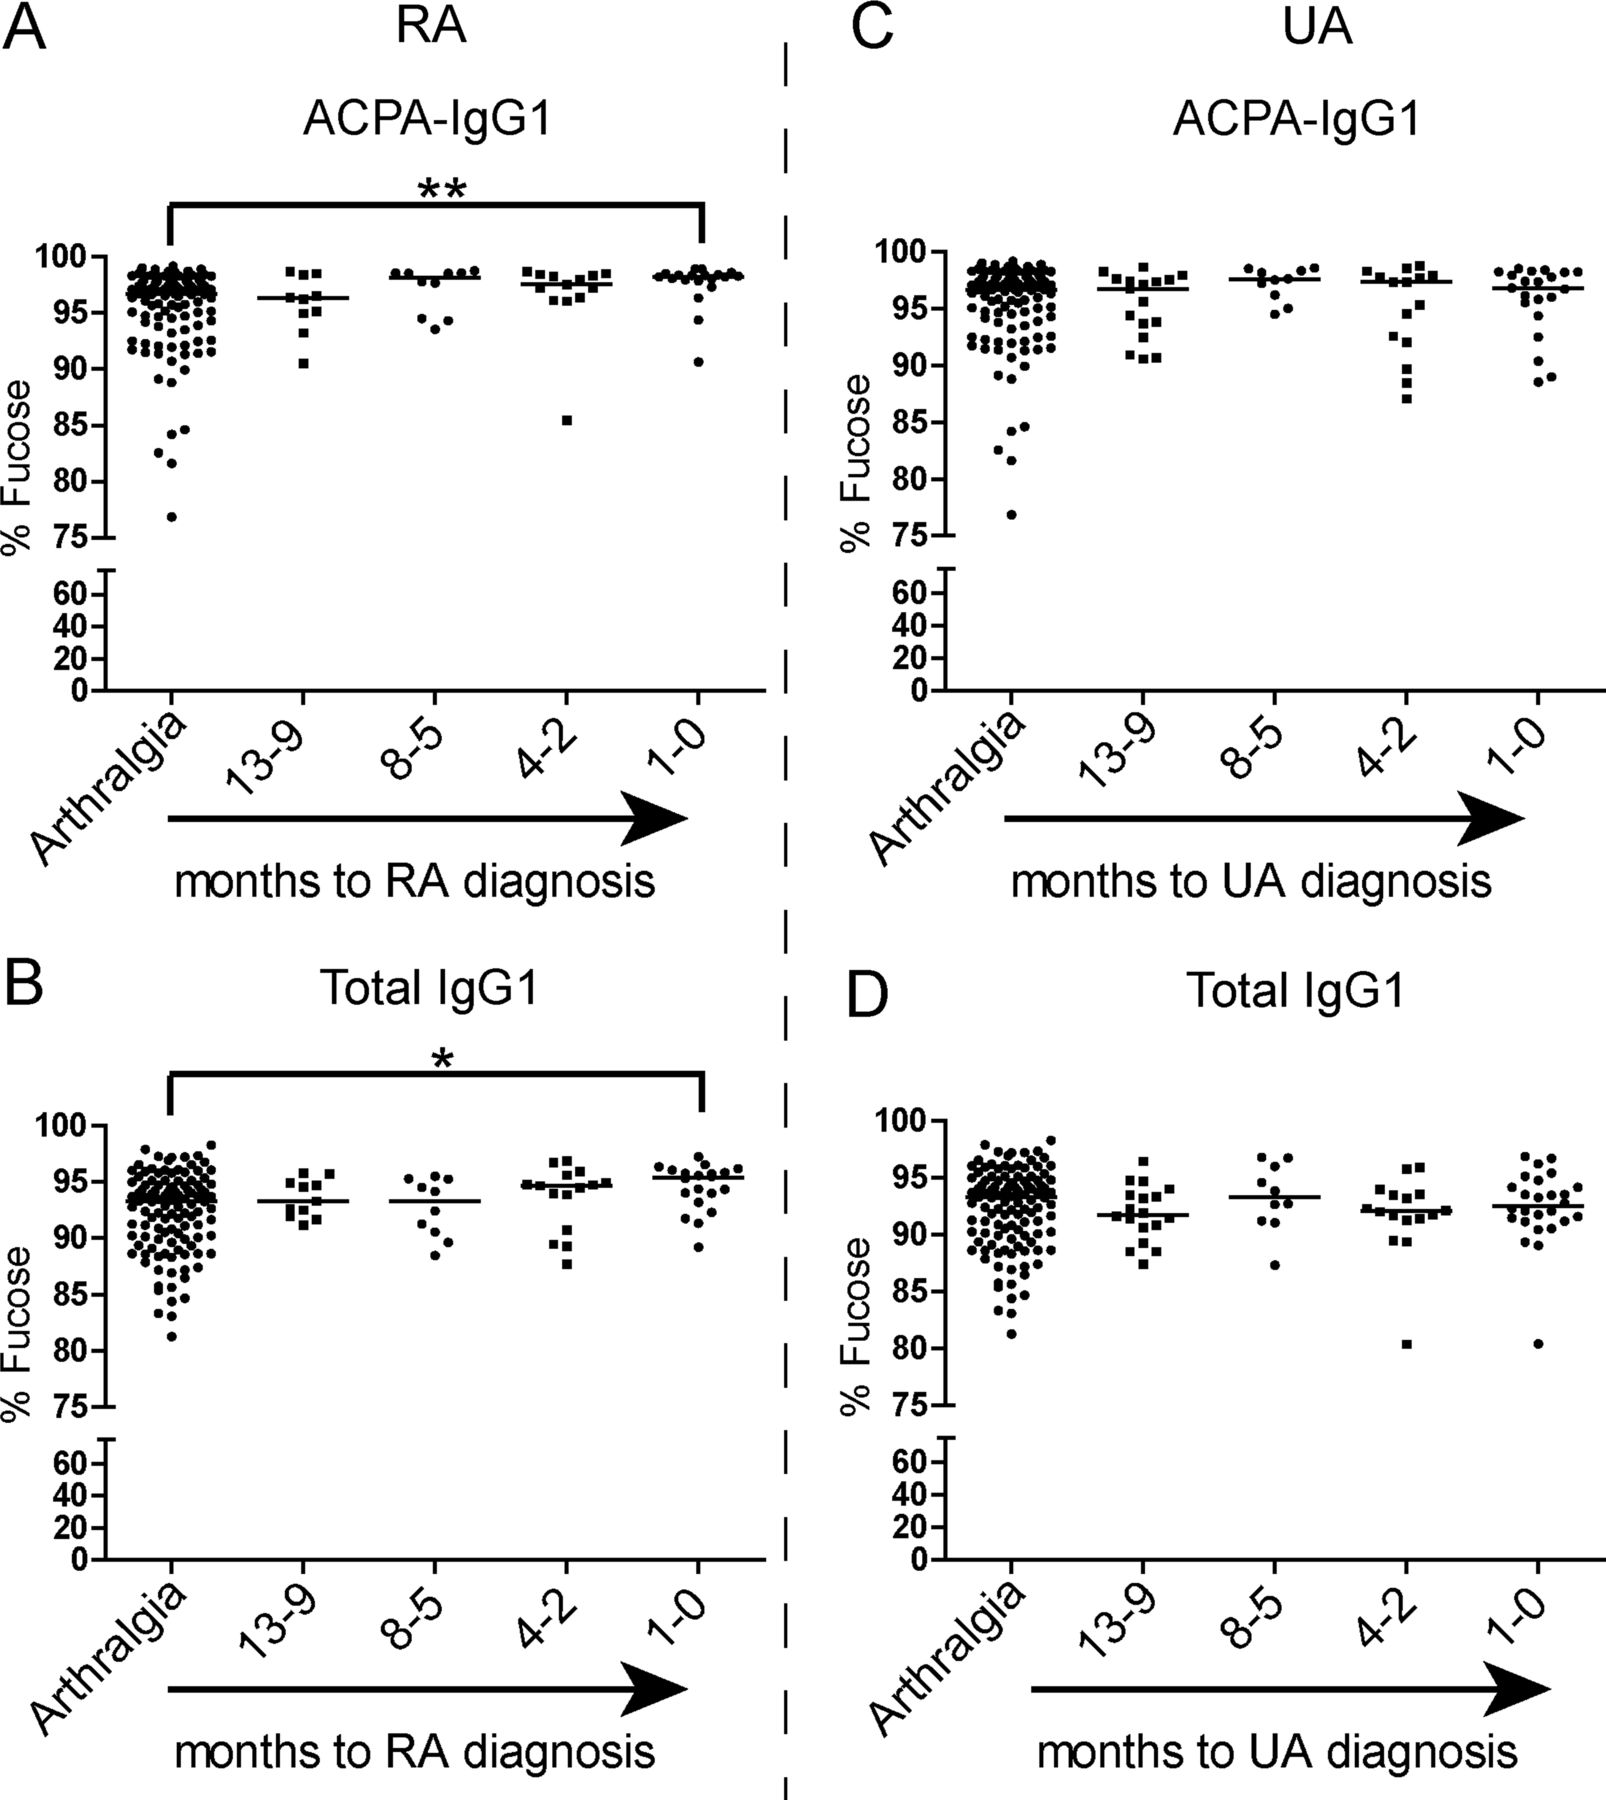
Based on these findings, we aimed to determine whether the observed alterations in IgG1 Fc glycosylation precede the onset of arthritis. To this end, samples obtained up to 1 year (−13 to −9 months) prior to the onset of arthritis were analysed. One year prearthritis, Fc galactosylation of ACPA-IgG1 did not differ from baseline levels (figure 4A). However, patients who were classified as RA at the onset of arthritis showed a significant decrease of ACPA-IgG1 Fc galactosylation at around 3 months (−4 to −2 months) prior to diagnosis (figure 4A). This predisease change of galactosylation was not noted for total IgG1 molecules, as a significant degree of hypogalactosylation could only be detected at the time of diagnosis (figure 4B). Patients presenting with UA, on the other hand, did not show significant alterations in ACPA-IgG1 and total IgG1 Fc galactosylation levels, neither predisease nor at the onset of arthritis (figure 4D,E). Importantly, no significant age difference was observed in the groups used for this analysis, excluding age as a confounder in the effects observed (data not shown). Taken together, these data indicate a reduction of galactose residues on ACPA-IgG1 shortly before disease onset in patients presenting with arthritis classifiable as RA.

Changes in anticitrullinated protein antibodies (ACPA) Fc galactosylation precede the onset of rheumatoid arthritis (RA) and are paralleled by an increase in systemic inflammation. (A) ACPA-IgG1 Fc-specific galactosylation levels decrease predisease and become significantly different approximately 3 months (−4 to −2) before the diagnosis of RA in comparison with arthralgia patients >13 months before diagnosis (arthralgia at baseline: median 50.6% (IQR 45.9–56.8); −4 to −2 months pre-RA: 47.0% (IQR 40.4–49.7); RA at diagnosis: 42.1% (IQR 36.9–48.4)). (B) For total IgG1, a significant decrease of Fc galactosylation content, albeit less pronounced, can only be observed at disease onset (arthralgia at baseline: median 53.9% (IQR 46.1–58.7); RA at diagnosis: 44.7% (IQR 39.2–51.3)). (C) An increase in systemic inflammation, measured by erythrocyte sedimentation rate (ESR), is observed in parallel to the decrease of ACPA-IgG1 Fc galactosylation levels before the diagnosis of RA (arthralgia at baseline: median 15.0 mm/h (IQR 7.0–25.0); RA at diagnosis: 25.0 mm/h (IQR 18.8–32.5)). Patients who will develop undifferentiated arthritis (UA) show no significant variation over time in the percentage of (D) ACPA-IgG1 Fc galactosylation (arthralgia at baseline: 50.6% (IQR 45.9–56.8); UA at diagnosis: 46.3% (IQR 42.9–54.1)) and (E) total IgG1 Fc galactosylation levels (arthralgia at baseline: median 53.9% (IQR 46.1–58.7); UA at diagnosis: 50.8% (IQR 42.6–60.3)) nor in (F) the ESR (arthralgia at baseline: 15.0 mm/h (IQR 7.0–25.0); UA at diagnosis: 17.0 mm/h (IQR 8.0–27.0)). The non-parametric Kruskal–Wallis test followed by Dunn's posthoc test was *, ** and *** represent p values <0.05, <0.005 and <0.0005, respectively.
Fc galactosylation changes parallel increased systemic inflammation
We previously reported a correlation between ACPA Fc galactosylation levels and systemic inflammation.36 As we now observed specific ACPA Fc galactosylation changes in the RA, but not in the UA group, we hypothesised that the RA group would show increased signs of inflammation. Indeed, an increase in erythrocyte sedimentation rate (ESR) was noted in the RA group, which paralleled the observed alterations in Fc galactosylation (figure 4C). Again, no such increase was observed in patients presenting with UA at the onset of arthritis (figure 4F), indicating a close correlation between changes in Fc galactosylation and the degree of systemic inflammation.
ACPA-specific fucosylation patterns predisease
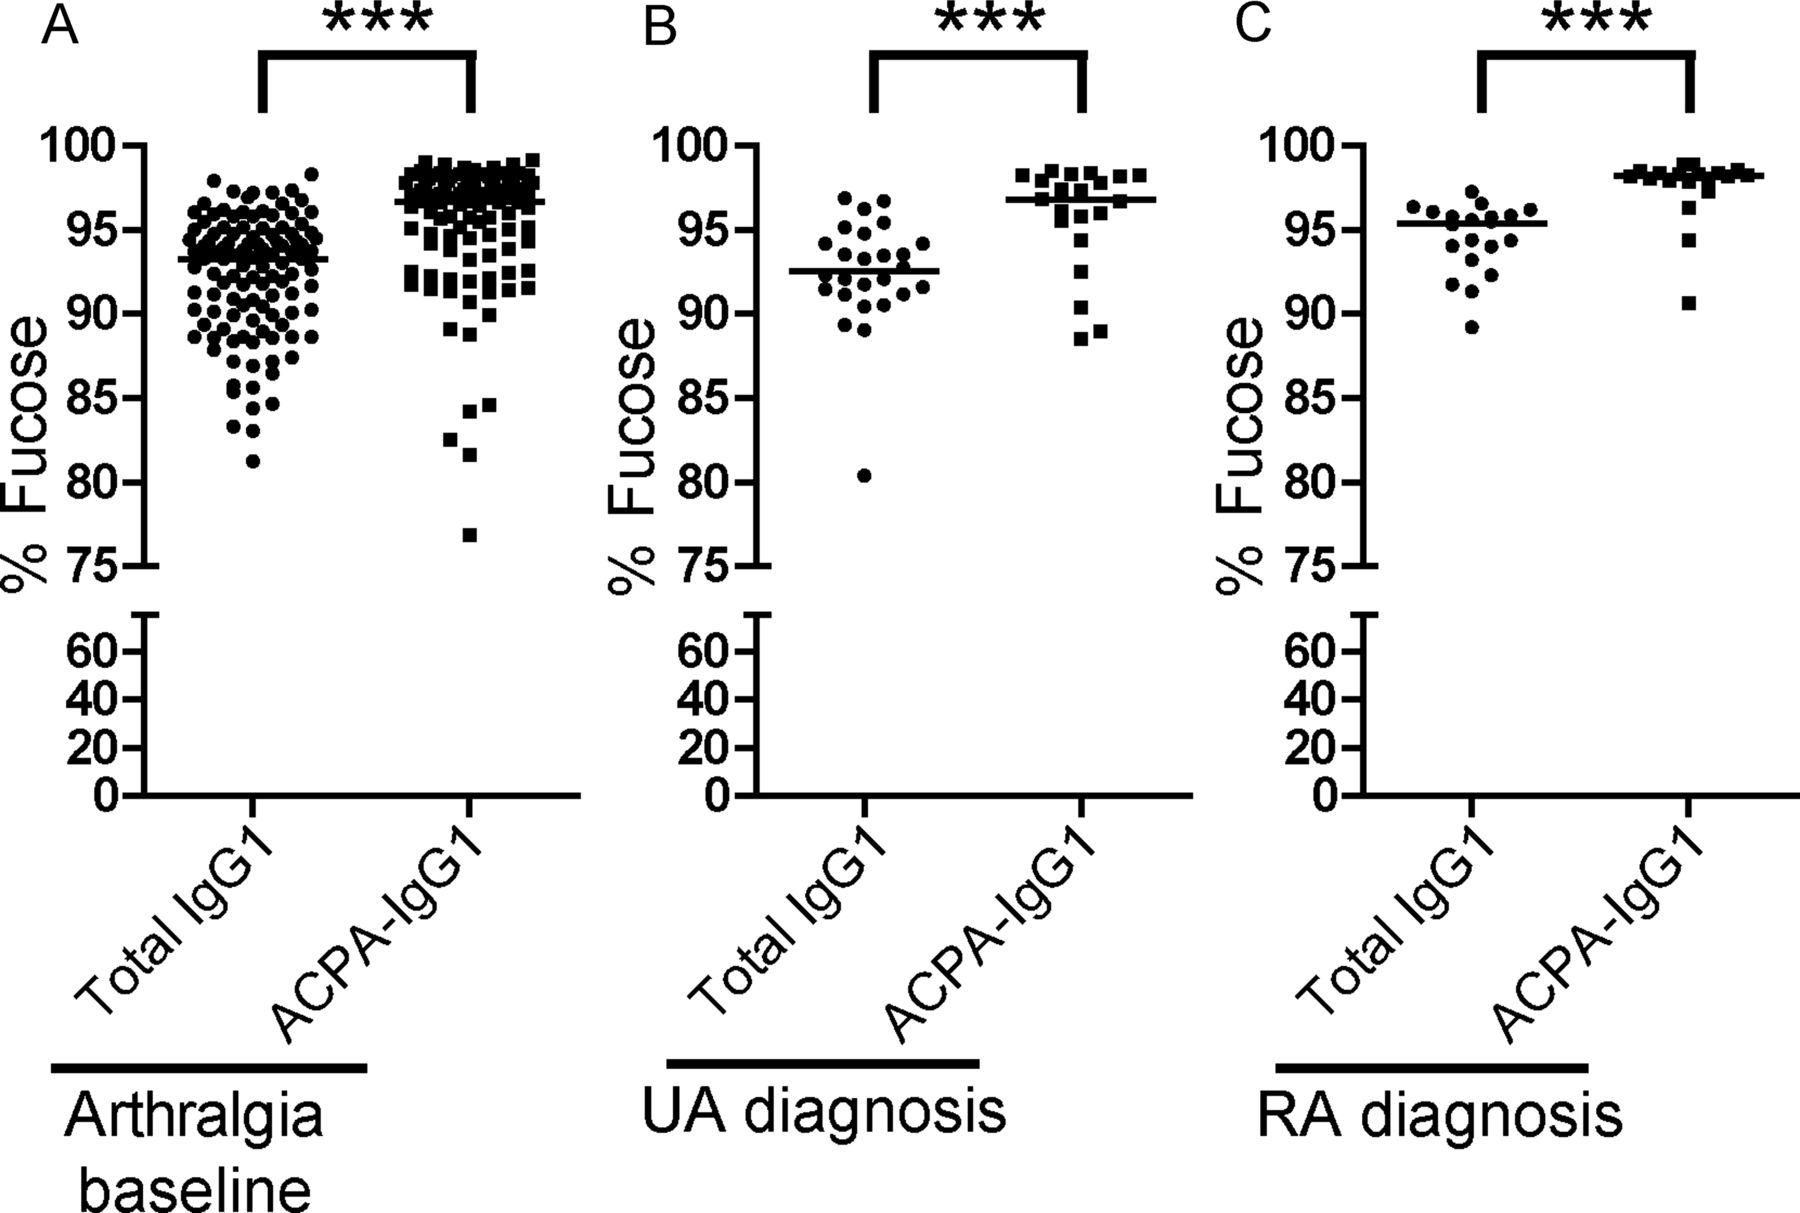
Next to galactosylation and sialylation, the extent to which an antibody is core-fucosylated strongly influences its biological activity. While serum IgG1 generally displays a relatively high degree of fucosylation (>92%), reduced fucosylation (∼42%) has been found on antithrombocyte antibodies in immune thrombocytopenic purpura.43 Functionally, absence of core fucose residues leads to increased affinity of the Fc tail for binding to FcγRIIIa, thereby enhancing ADCC.21 ,22 A high degree of core fucosylation, on the other hand, decreases affinity for FcγRIIIa and FcγRIIB, thereby putatively allowing IgG molecules to bind to FcγRI.22 ,44 Given these functional consequences of core fucosylation, we extended our analysis to Fc-linked core fucose residues on ACPA-IgG1. Of interest, ACPA displayed a significantly higher degree of core fucosylation than total IgG1, both at baseline (arthralgia) and at the diagnosis of arthritis (Figure 5A–C). The degree of core fucosylation further increased in ACPA of RA patients towards the onset of arthritis (figure 6A), a phenomenon that we observed to a lesser degree also for total serum IgG1 (figure 6B). Again, no significant increase was observed for ACPA-IgG1 of patients presenting with UA (figure 6C,D).

ACPA-specific fucosylation patterns at baseline and at the diagnosis of arthritis. ACPA-IgG1 present a significantly higher level of core fucosylation in (A) arthralgia patients at baseline and (B) in undifferentiated arthritis (UA) and (C) rheumatoid arthritis (RA) patients at diagnosis as compared to total serum IgG1 (arthralgia at baseline: median 93.3% (IQR 89.9–94.8) for total IgG1 vs 96.6% (IQR 93.8–97.8) for ACPA-IgG1; UA at diagnosis: 92.5% (IQR 91.2–94.3) for total IgG1 vs 96.8% (IQR 94.9–98.2) for ACPA-IgG1; RA at diagnosis: 95.4% (IQR 93.4–96.0) for total IgG1 vs 98.2% (IQR 97.8–98.4) for ACPA−IgG1). Statistical differences were evaluated using the non-parametric Mann–Whitney test. *** represents p value <0.0005.
Changes of ACPA-IgG1 and total IgG1 core fucosylation precede the diagnosis of rheumatoid arthritis (RA). (A) Although already high at baseline, the percentage of core fucosylation slightly increases in ACPA-IgG1 before RA onset in comparison with that of arthralgia patients at baseline (arthralgia at baseline: median 96.6% (IQR 93.8–97.8); RA at diagnosis: 98.2% (IQR 97.8–98.4)). (B) These changes were also observed for total IgG1, albeit less pronounced (arthralgia at baseline: median 93.3% (IQR 89.9–94.8); RA at diagnosis: 95.4% (IQR 93.4–96.0)). No significant variation in (C) ACPA-IgG1 and (D) total IgG1 core fucosylation levels was observed in patients who develop undifferentiated arthritis (UA) as compared to arthralgia patients at baseline (arthralgia at baseline: median 96.6% (IQR 93.8–97.8) for ACPA-IgG1 and 93.3% (IQR 89.9–94.8) for total IgG1; UA at diagnosis: 96.8% (IQR 94.9–98.2) for ACPA-IgG1 and 92.5% (IQR 91.2–94.3) for total IgG1). The non-parametric Kruskal–Wallis test followed by Dunn's posthoc test was used, * and ** represent p values <0.05 and p values <0.005, respectively.
Discussion
Next to well-established clinical associations, accumulating experimental evidence points to a pathogenic role of ACPA in RA pathogenesis.1–5 However, ACPA can be present in serum for many years in subjects that do not show clinical or serologic signs of inflammation.6 ,7 ,8 ,10 These observations indicate that a yet unknown trigger could induce a quantitative and/or qualitative change in the ACPA response prior to disease onset. Here, we hypothesised that such a change could be related to ACPA-IgG Fc glycosylation based on the observation that the monosaccharide composition of Fc glycans can strongly influence the inflammatory activity of IgG.45 ,46 Indeed, employing a robust technique of IgG Fc-specific glycopeptide profiling, we found a decrease of galactosylation and an increase of core fucosylation of serum ACPA-IgG1 shortly before the onset of RA. Based on published data, these features are thought to enhance the overall proinflammatory effector functions of IgG molecules.22 ,45 ,46
So far, reports on Fc glycosylation changes of total serum IgG in individuals prior to the development of RA have been limited and conflicting. Comparison of IgG glycosylation in patients with early onset synovitis who developed RA, or other inflammatory joint diseases within 2 years, revealed an elevated level of agalactosylated IgG (G0 glycoforms) in patients with future RA.47 Another study suggested a significant increase of IgG G0 glycoforms in patients with RA around 3.5 years before the onset of disease.48 By contrast, others reported no significant differences in IgG galactosylation levels between recent onset RA patients and healthy donors.31 Of note, these studies analysed total IgG and not specific autoantibodies and applied different analytical techniques which, in part, do not differentiate between IgG subclasses or Fc-linked and Fab-linked glycans. Additional differences might originate from the cohorts studied and the definitions used for patient classification. Our present study, albeit limited by comparatively low patient numbers, indicates that ACPA-IgG1 Fc glycosylation changes occur only within months before the onset of arthritis. Nonetheless, these changes were detected several months before comparable changes could be observed for total IgG1.
The Fc glycosylation changes described were only observed in patients presenting with disease symptoms classifiable as RA according to the 1987 ACR criteria, but not in patients with 1987-UA.37 As stated in the discussion of the ‘ACR/EULAR 2010-criteria’ manuscript, use of the 1987 criteria is advised for pathogenetic studies.49 By focussing on these criteria, we had the possibility to choose defined subgroups of patients that differ in the degree of their inflammatory phenotype. UA patients represent the less inflammatory subgroup (lower number of swollen joints, less systemic inflammation (ESR)), even though, mainly due to the presence of ACPA, the vast majority of these patients would classify as RA following the 2010 ACR/EULAR criteria.49 Separating the groups in 1987-UA and 1987-RA allowed us to show that Fc glycosylation changes on ACPA-IgG1 indeed occur prior to RA onset. Although not useful for diagnostic purposes, this observation could be informative with respect to pathogenetically relevant inflammatory processes pre-RA.
In this context, our data underline the close correlation between systemic inflammation and ACPA-IgG1 Fc glycosylation. In fact, an increase in systemic inflammation directly paralleled the decrease of ACPA Fc-linked galactose residues (figure 4C). Based on this observation, it is not possible to determine whether ACPA glycosylation changes are cause or consequence of inflammation. However, it is intriguing to note that the decrease in ACPA Fc galactosylation preceded that of total serum IgG. This could be due to differences in compartments in which the respective antibodies are produced. It is possible that agalactosylated ACPA in serum originate mainly from synovial tissue or other sites of preclinical inflammation.50 Supporting this view, we have previously found a high degree of IgG1-G0 glycoforms specifically on ACPA in synovial fluid, but not on total IgG1.36 Together with the potential presence of subclinical inflammation in synovium prior to the onset of clinically overt arthritis, leakage of synovial ACPA to the serum compartment could explain the findings observed. Additionally, it would emphasise the role of the B-cell microenvironment for Fc glycosylation, in line with our previous finding that various extracellular factors can modulate Fc glycosylation patterns in vitro.51
Finally, next to changes in Fc-linked galactosylation, we observed that ACPA-IgG1 display a higher frequency of core fucose residues compared with total serum IgG1. This feature was already detectable at baseline, underlining the notion of B cell-specific regulation of Fc-linked glycan profiles. The high degree of core fucosylation further increased towards the onset of arthritis at a time-course comparable to the loss of galactose residues. Again, this observation was only found in patients with RA. The biological relevance of this finding is yet unclear but indicates a reduced affinity of ACPA for FcγRIIIa and FcγRIIb, but not for other activating FcyR, such as the high-affinity FcγRI.21 ,22 ,44 Putatively, such reduced affinity for FcγRIIIa and FcγRIIb could increase availability of ACPA for binding to FcγRI, thereby favouring immune activating effects.
Taken together, the present study shows that ACPA-IgG1 molecules acquire changes in Fc glycosylation shortly before the onset of arthritis. These changes could be involved in driving the inflammatory disease process, although the underlying mechanisms remain yet to be defined.
Acknowledgments
We thank Carolien Koeleman for excellent technical support.
References
Supplementary materials
Supplementary Data
This web only file has been produced by the BMJ Publishing Group from an electronic file supplied by the author(s) and has not been edited for content.
Files in this Data Supplement:
- Data supplement 1 - Online figure
Footnotes
Handling editor Tore K Kvien
Contributors YR acquired data, analysed, interpreted data, drafted and revised the paper. EE and MHS acquired data, analysed and revised the draft paper. LAT, LvdS and DS collected cohort samples and revised the draft paper. AMD and TWJH revised the draft paper. MW designed experiments and revised the draft paper. REMT and HUS designed experiments, interpreted data, drafted and revised the paper.
Funding This work was supported by grants from the Dutch Arthritis Foundation (NR 10-1-204), the European Union (Seventh Framework Programme integrated project Masterswitch, grant number: 223404, and HighGlycan, grant number: 278535) and the IMI EU funded project BeTheCure (contract no 115142-2). REMT is recipient of a NWO-ZonMW VICI grant. MHJS is supported by Hoffmann La Roche. LAvdS and DvS were supported by the Dutch Arthritis Association (No. 8-1-306). LT is supported by a NWO-ZonMW Vidi grant and by a fellowship from Janssen Biologics.
Competing interests None.
Ethics approval This study was approved by the local ethics committee, and all participants gave informed consent.
Provenance and peer review Not commissioned; externally peer reviewed.