Article Text

Abstract
Objective To investigate if erythrocyte-methotrexate-polyglutamate (MTX-PG) concentrations in patients with rheumatoid arthritis (RA) are associated with disease activity or adverse events.
Methods We used a longitudinal study design with two cohorts. The derivation cohort included 102 and the validation cohort included 285 patients with RA on MTX. We measured erythrocyte-MTX-PG with 1–5 glutamate residues at 3 months, 6 months and 9 months after MTX start with a liquid chromatography (LC)-mass spectrometry (MS)/MS assay. Outcomes were disease activity score in 28 joints (DAS28) and adverse events. Longitudinal associations of MTX-PG concentrations after 3 months, 6 months and 9 months with DAS28 were tested with a linear mixed model adjusted for age, gender, baseline DAS28, MTX dose and comedication.
Results In the derivation cohort, mean DAS28 decreased from 4.26 (SE=0.14) at baseline to 2.72 (SE=0.13) after 9 months. Thirty per cent of patients in the derivation cohort experienced more than three adverse events after 3 months, which decreased to 18% after 9 months. In the validation cohort, DAS28 and adverse events were comparable with the derivation cohort. In the derivation cohort, MTX-PG1 (ß=−0.005), MTX-PG2 (ß=−0.022), MTX-PG3 (β=−0.007) and total MTX-PG (ß=−0.004) were associated (p<0.05) with lower DAS28 over 9 months. In the validation cohort, MTX-PG2 (ß=−0.015), MTX-PG3 (ß=−0.010), MTX-PG4 (ß=−0.008) and total MTX-PG (ß=−0.003) were associated with lower DAS28 over 9 months. None of the MTX-PGs was associated with adverse events.
Conclusions In this first longitudinal study, we showed that an increase in erythrocyte-MTX-PG concentration was associated with a decreased DAS28 over 9 months in two cohorts, and is therefore a potential tool for therapeutic drug monitoring of MTX in RA.
- DMARDs (synthetic)
- Rheumatoid Arthritis
- Pharmacokinetics
Statistics from Altmetric.com
Introduction
Methotrexate (MTX) is the cornerstone disease-modifying antirheumatic drug (DMARD) in the treatment of patients with rheumatoid arthritis (RA). However, significant numbers of patients fail to achieve adequate suppression of disease activity or experience adverse events causing refusal of dose increase or treatment continuation.1 In those who are non-responsive, increasing MTX dose can be an alternative. Dosage of MTX, required to suppress disease activity, varies between patients and is unpredictable. Until now, the decision to increase dosage is dependent on assessment of disease activity, accepted upper limit of drug dosing and occurrence of adverse events.2 If patients fail to respond to MTX, even after dosage increase, or develop severe adverse events within 3–6 months, additional treatment with biologicals is instituted.3 Therapeutic drug monitoring (TDM) of intracellular MTX concentrations in erythrocytes may help in identifying refractory patients with non-response and high concentration, and patients with a difficulty in accumulating MTX or non-compliance who may benefit from a dose increase or treatment of compliance issues.
Plasma-MTX is eliminated from plasma within 24 h4 and is unrelated to response5 and therefore, is not a reliable tool for TDM.6 MTX is transported intracellularly and retained within cells long after it has been eliminated from plasma.5 Circulating MTX contains one glutamate moiety (MTX-polyglutamate1 (MTX-PG1)). Once inside cells, up to four additional glutamates (PG2-PG5) are added to retain intracellular MTX, which in turn increases its affinity for target enzymes in one-carbon metabolism, thus promoting MTX's anti-inflammatory effects. Higher MTX dose leads to higher intracellular erythrocyte-MTX-PG concentrations.7 ,8 Summarising, erythrocyte-MTX-PGs could have a promising role as biomarkers of patients’ response to MTX and in turn could be potentially used as a TDM tool.
Erythrocyte-MTX-PGs have been related to response in several studies in adult RA.4 ,9–12 In addition, we showed in an accompanying paper that in juvenile idiopathic arthritis (JIA) long-chain erythrocyte-MTX-PGs were associated with lower disease activity at 3 months and during 1 year of MTX treatment.13 However, there have been reports with contrasting results in RA and in JIA.2 ,14 ,15 Most of these studies used cross-sectional analyses2 ,9 ,10 ,14 ,15 in which patients were in different stages of MTX-treatment varying from 3 months to >10 years. Disadvantages of cross-sectional analysis are that you cannot distinguish between those treated for weeks or years and that you cannot make causal inference.16 Additionally, comparison between patients is complicated because MTX is stopped in obstinate non-responders and because MTX-PG accumulation is a function of time.5
The aim of this prospective, longitudinal study was to investigate if intracellular erythrocyte-MTX-PG concentrations are related to disease activity or adverse events in patients with RA on MTX and thus if MTX-PGs could be a tool for TDM.
Patients and methods
Study design and patients
The derivation cohort was the ‘MTX in Rotterdam’ cohort (MTX-R). The MTX in Rotterdam is a longitudinal prospective cohort of patients who started MTX between January 2006 and March 2011 at the Rheumatology Department, Erasmus University Medical Center, Rotterdam, Netherlands. The validation cohort was the ‘Treatment in Rotterdam Early Arthritis Cohort’. The Treatment in Rotterdam Early Arthritis Cohort is a clinical multicentre, stratified single-blinded trial (ISRCTN26791028), as described earlier.17 ,18 The medical ethics committee from the Erasmus University Medical Center, Rotterdam approved both studies and patients gave written informed consent before inclusion.
Derivation cohort patients were included if diagnosed with RA by the physician. Validation cohort patients were included in if they fulfilled the 2010 American College of Rheumatology/European League Against Rheumatism (EULAR) criteria for RA.19 Patients on biologicals at baseline were excluded.
In the derivation cohort, clinicians chose MTX dosage and comedication for every visit. In the validation cohort, MTX starting dose was set at 25 mg/week (reached after 3 weeks). If patients had disease activity score in 28 joints (DAS28) <2.6 for two consecutive visits MTX dose was decreased by 2.5 mg/month until discontinuation. Patients were randomised to treatment with or without sulfasalazine, hydroxychloroquine and glucocorticoids. Patients in both cohorts received folic acid (10 mg/week) during MTX treatment. In both cohorts, patients were assessed at baseline, and after 3 months, 6 months and 9 months.
Biochemical parameters
One additional EDTA blood sample tube was obtained from patients during every study visit besides routine EDTA and serum samples for erythrocyte sedimentation rate, C reactive protein, alanine aminotransferase, rheumatoid factor, anticyclic citrullinated peptide antibody, leukocytes, thrombocytes and haemoglobin. The additional EDTA tube was immediately put on ice after collection, centrifuged for 10 min at 1700 g at 4°C. Plasma and cell-pellet aliquots were stored at −80°C. MTX-PGs were analysed from the cell-pellet aliquots with a liquid chromatography-electrospray ionisation-tandem mass spectrometry-based assay using stable-isotope-labelled internal standards, as described recently by us.20 Concentrations of MTX-PGs were reported in nmol/L packed erythrocytes.
Disease activity and adverse events
Disease activity outcome was the DAS28.21 Adverse event outcome was categorised into: one or more (versus none) and three or more (versus two or less). Adverse events included gastrointestinal complaints, malaise, psychological complaints, hepatotoxicity, bone marrow depression and other complaints. Gastrointestinal complaints involved diarrhoea, vomiting, sickness and abdominal pain. Malaise involved fatigue, dizziness, headache, sleeplessness and not feeling well. Psychological complaints involved depression and personality changes. Other complaints involved dyspnoea, alopecia, infection, mucositis, epistaxis, skin related complaints and others. Gastrointestinal complaints, malaise, psychological complaints and other complaints were assessed with a questionnaire every visit and scored by a researcher. Hepatotoxicity was defined as alanine aminotransferase, three times upper level of normal. Bone marrow depression was defined as leucocytes <3.0×10⁹/L or thrombocytes <100×109/L.
Statistical analyses
Comparisons of patient characteristics between derivation and validation cohorts were made by Student's t test, χ2 test, Mann-Whitney U test or Friedman's two-way analysis of variance by ranks as appropriate. Correlations were tested with Spearman's correlation-test. Multiple linear regression analyses were used for cross-sectional analyses of MTX-PG concentrations measured at 3 months, 6 months and 9 months with continuous outcomes (DAS28) at corresponding visits. Multivariate logistic regression analyses were used for dichotomous outcomes (adverse events). Longitudinal analyses of association of MTX-PG concentrations, measured at 3 months, 6 months and 9 months, with DAS28 at corresponding study visits were performed with a linear mixed model for continuous outcomes. All analyses were corrected for potential confounders: age, gender, baseline DAS28, MTX dose and use of other DMARDs, non-steroidal anti-inflammatory drugs (NSAIDs), glucocorticoids and biologicals. Confounders were added as covariates to regression analyses. Comedication and MTX dose observed 3 months prior to the visit were added as covariates.
Finally, for those MTX-PGs that had significant association with DAS28, cut-off concentrations for moderate/good-response versus non-response according to EULAR response criteria22 were determined in the derivation cohort using receiver operating characteristic curves. Cut-off concentrations were chosen to have optimal sensitivity and specificity. EULAR response criteria allow only patients with baseline DAS28≥3.3. For these cut-off concentrations diagnostic parameters: sensitivity, specificity, positive predictive value and negative predictive value were subsequently determined. Statistics were performed with SPSS Statistics V.20.0.0.1 (SPSS, Chicago, Illinois, USA).
Results
Patients and MTX-PG concentrations
At baseline, 102 patients were included in the derivation cohort and 285 patients were included in the validation cohort (figure 1). MTX-PGs in the derivation cohort were measured in 79 patients after 3 months of treatment, 67 patients after 6 months and 59 patients after 9 months. In the validation cohort, MTX-PGs were measured in 228 patients after 3 months, 183 patients after 6 months and 177 patients after 9 months.

Flow chart of patient follow-up for both cohorts. *Reasons for dropout were: patient refusal, adverse events, communication problems, no compliance, lost to follow-up, and MTX stopped; **Reasons for time point skipped were: there was insufficient material available for determinations of MTX-PG concentrations, and patients did not show up. ACR, American College of Rheumatology; MTX-PG, methotrexate-polyglutamate; RA, rheumatoid arthritis; tREACH, Treatment in Rotterdam Early Arthritis Cohort.
Disease activity at MTX start was lower in the derivation cohort compared with the validation cohort (table 1). MTX dose was higher in the validation cohort (25 mg/week) compared with the derivation cohort (15 mg/week). Patients in the derivation cohort used more NSAIDs, less steroids and more parenteral MTX than patients in the validation cohort. Table 2 shows medians and ranges of erythrocyte MTX-PG concentrations at 3 months, 6 months and 9 months in both cohorts. Online supplementary table S1 shows dosing adjustments. In both cohorts constant concentration was achieved for MTX-PG1 and MTX-PG2 after 3 months. However in the derivation and validation cohort, MTX-PG3 (p<0.001, p<0.001), MTX-PG4 (p<0.001, p=0.009), MTX-PG5 (p<0.001, p=0.003) and total MTX-PG (p=0.024, p<0.001) had higher concentrations after 6 months compared with 3 months. The concentrations at 6 months and 9 months were the same for all MTX-PGs in both cohorts.
Baseline characteristics per cohort
Erythrocyte-MTX-PG concentrations, median (minimum-maximum), in nmol/L packed erythrocytes over time in both cohorts
Online supplementary table S2a,b shows the correlations between all MTX-PGs at 3 months. After 3 months, MTX-PG3 (40 nmol/L vs 48 nmol/L; p=0.001), MTX-PG4 (8 nmol/L vs 19 nmol/L; p<0.001) and MTX-PG5 (1 nmol/L vs 5 nmol/L; p<0.001) concentrations were lower in the derivation cohort compared with the validation cohort. After 6 months, MTX-PG5 (3 nmol/L vs 4 nmol/L; p=0.003) concentrations were lower in the derivation cohort. After 9 months there were no differences in MTX-PG concentrations between cohorts.
Disease activity
In the derivation cohort, mean DAS28 decreased from 4.26 (SE=0.14) at baseline to 2.92 (SE=0.13) after 3 months (p<0.001), to 2.83 (SE=0.15) after 6 months and to 2.72 (SE=0.13) after 9 months. In the validation cohort, mean DAS28 decreased from 4.95 (SE=0.07) at baseline to 3.12 (SE=0.07) after 3 months (p<0.001), to 2.93 (SE=0.08) after 6 months and to 2.66 (SE=0.08) after 9 months. Online supplementary table S3 shows numbers of patients switching between moderate/good response and non-response.
Table 3 shows results of cross-sectional analyses for associations between each MTX-PG measured after 3 months, 6 months or 9 months for both cohorts with DAS28 determined at the corresponding study visit. In the derivation cohort after 3 months, higher MTX-PG1 (β=−0.006; SE=0.002), MTX-PG2 (β=−0.021; SE=0.008), MTX-PG3 (β=−0.016; SE=0.006), MTX-PG4 (β=−0.021; SE=0.010) and total MTX-PG (β=−0.006; SE=0.002) were associated with lower DAS28. After 9 months MTX-PG2 (β=−0.019; SE=0.009) and MTX-PG5 (β=0.037; SE=0.016) were associated with DAS28. In the validation cohort, after 6 months, MTX-PG2 (β=−0.015; SE=0.007), MTX-PG3 (β=−0.011; SE=0.003) and after 9 months, MTX-PG2, (β=−0.012; SE=0.006), MTX-PG3 (β=−0.007; SE=0.003) and total MTX-PG (β=−0.002; SE=0.001) were associated with lower DAS28.
Cross-sectional and longitudinal analysis of MTX-PG concentrations in nmol/L packed erythrocytes and DAS28
In the derivation cohort, longitudinal analyses showed that MTX-PG1 (β=−0.005, SE=0.002), MTX-PG2 (β=−0.022, SE=0.005), MTX-PG3 (β=−0.007; SE=0.003) and total MTX-PG (β=−0.004, SE=0.001) were associated with lower DAS28 over the first 9 months. In the validation cohort, MTX-PG2 (β=−0.015, SE=0.003), MTX-PG3 (β=−0.010, SE=0.002), MTX-PG4 (β=−0.008; SE=0.002) and total MTX-PG (β=−0.003, SE=0.001) were longitudinally associated with lower DAS28. For an increase in 1 nmol/L MTX-PG2 there is a decrease of 0.02 in DAS28. For an increase in 1 nmol/L MTX-PG3 there is a decrease of 0.01 in DAS28. For an increase in 1 nmol/L total MTX-PG there is a decrease of 0.003 in DAS28.
Adverse events
In the derivation cohort after 3 months 20% of the patients (n=16) presented with no adverse events, 42% (n=33) gastrointestinal complaints, 49% (n=39) malaise, 13% (n=10) psychological complaints, 2% (n=2) hepatotoxicity, 2% (n=2) bone marrow depression, 26% (n=21) other adverse events and 30% (n=24) three or more adverse events. After 9 months 15% (n=9) presented with no adverse events, 31% (n=18) gastrointestinal complaints, 23% (n=14) malaise, 4% (n=2) psychological complaints, 4% (n=2) hepatotoxicity, 1% (n=1) bone marrow depression, 28% (n=17) other adverse events and 18% (n=11) three or more adverse events. In the validation cohort, percentages of patients with adverse events were comparable with the derivation cohort. After 3 months 31% (n=71) experienced three or more adverse events, which decreased to 15% (n=27) after 9 months.
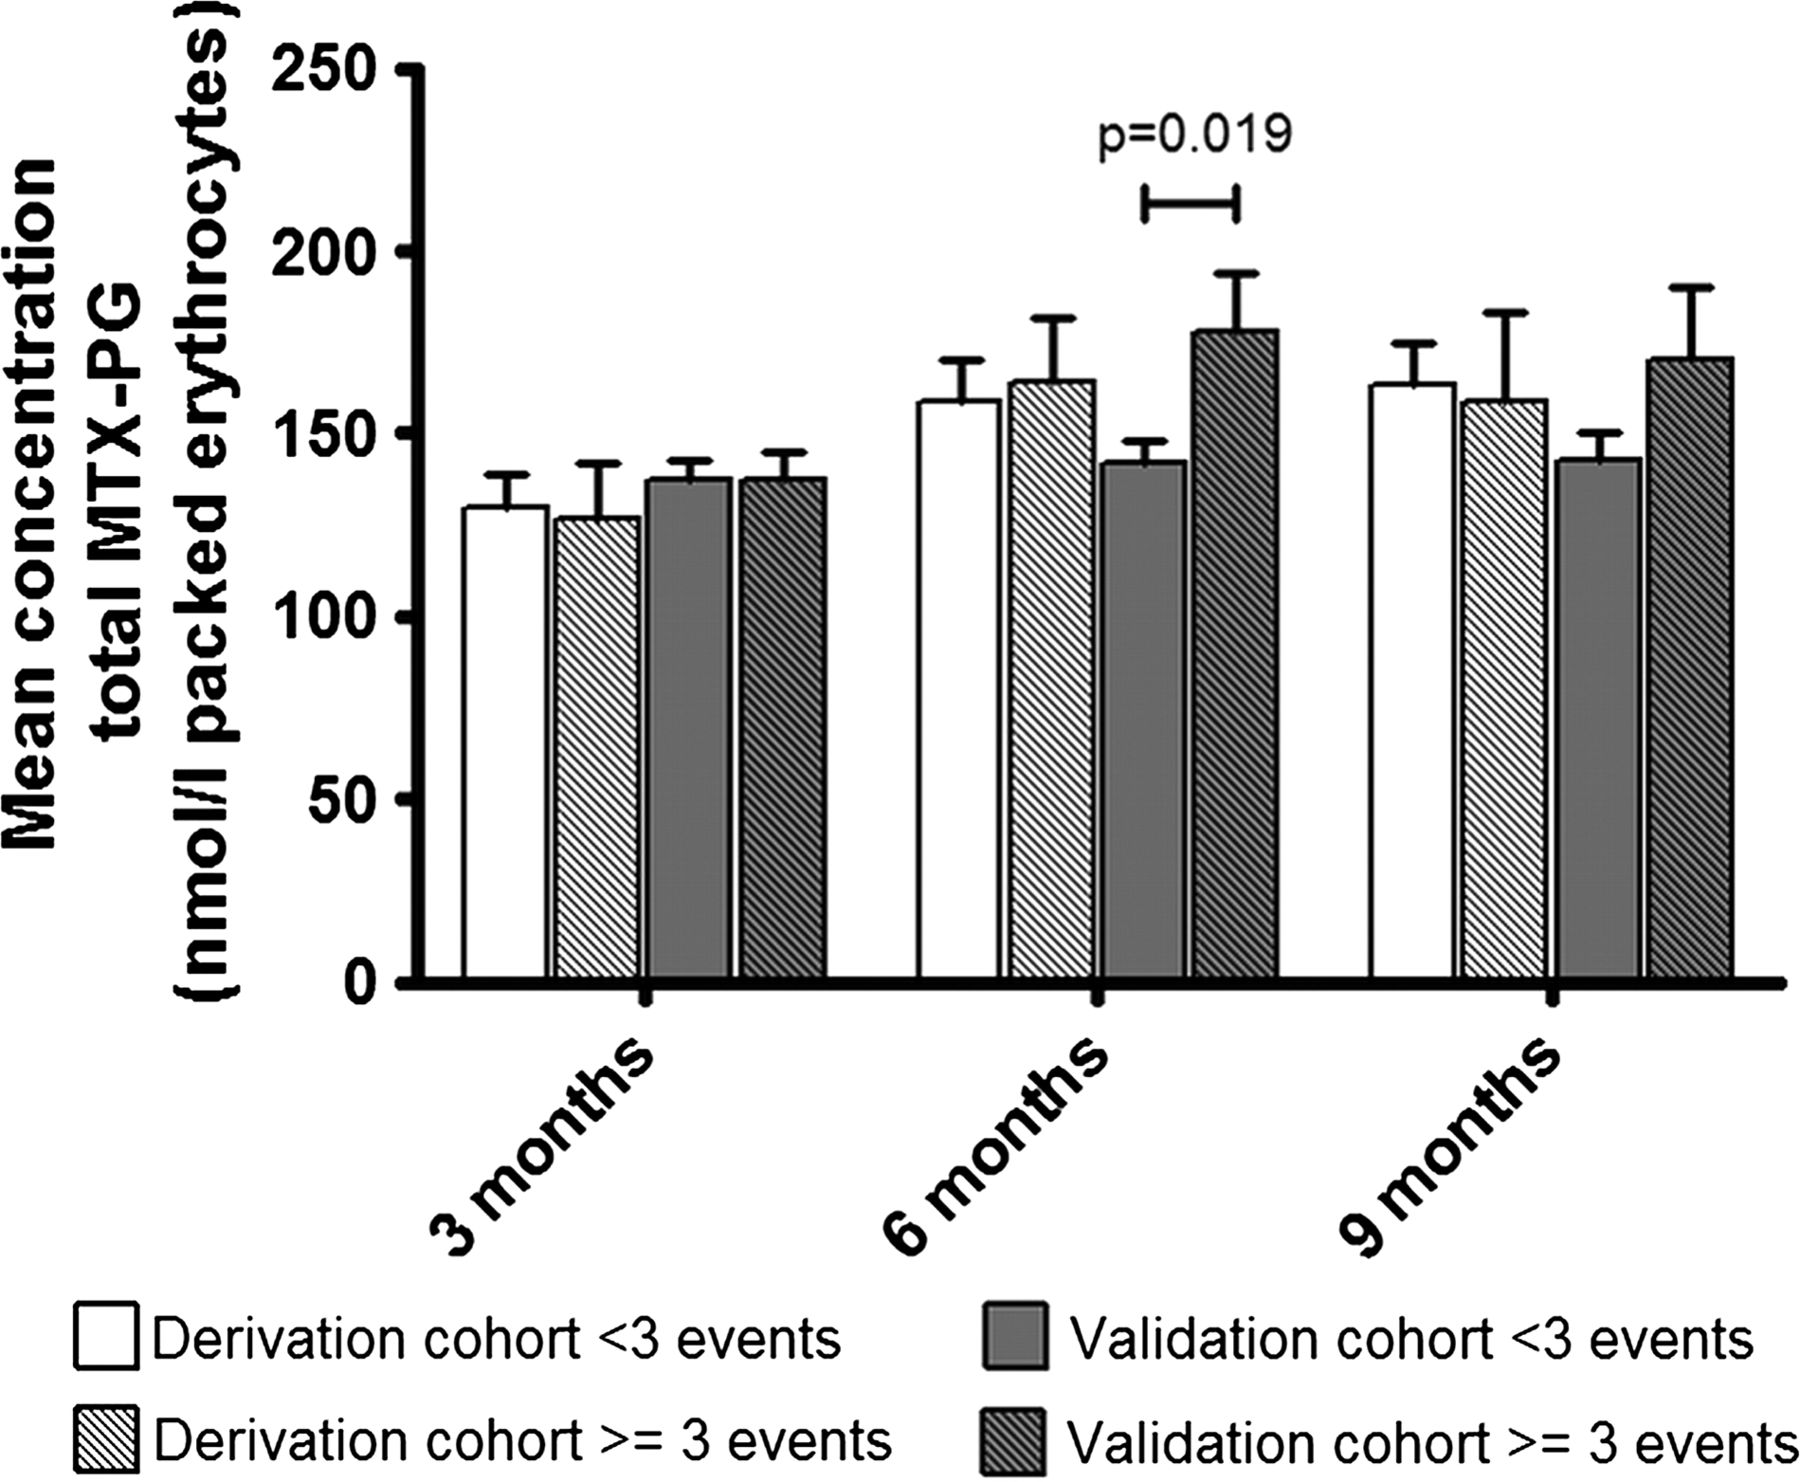
Figure 2 shows the concentrations of total MTX-PGs after 3 months, 6 months and 9 months in both cohorts, stratified for patients with three or more adverse events and patients with two or fewer adverse events. Patients with >3 adverse events had higher MTX-PG concentrations than patients with ≤two adverse events after 6 months in the validation cohort (142 nmol/L vs 178 nmol/L, p=0.019). In the derivation cohort after 3 months, total MTX-PG was not associated with no adverse events (OR=1.00; 95% CI 0.99 to 1.01), gastrointestinal complaints (OR=1.00; 95% CI 0.99 to 1.00), malaise (OR=1.01; 95% CI 1.00 to 1.01), psychological complaints (OR=1.00; 95% CI 0.98 to 1.01), hepatotoxicity (OR=0.92; 95% CI 0.80 to 1.05), bone marrow depression (OR=0.96; 95% CI 0.86 to 1.07), other adverse events (OR=1.00; 95% CI 0.99 to 1.01) and three or more adverse events (OR=1.00; 95% CI 0.99 to 1.01). Same results were obtained for cross-sectional analyses after 6 months and 9 months and for all individual MTX-PGs. In the validation cohort, all results from the cross-sectional analyses were comparable with the derivation cohort. Thus, no significant associations were found in this study between any of the MTX-PGs and adverse events.
Mean concentration of total erythrocyte-MTX-PG in both cohorts for patients with <three adverse events and patients with ≥three adverse events after 3 months, 6 months and 9 months. MTX-PG, methotrexate-polyglutamate.
Cut-off concentrations
MTX-PG2, MTX-PG3, MTX-PG4 and total MTX-PG were longitudinally associated with lower DAS28 during 9 months’ treatment. Therefore, cut-off concentrations for EULAR moderate/good response and their diagnostic parameters were determined. Table 4 shows that cut-off concentrations of ≥22 nmol/L for MTX-PG2 and ≥74 nmol/L for total MTX-PG could discriminate well between patients with moderate/good versus non-response.
Cut-off values in nmol/L packed erythrocytes, sensitivity and specificity of erythrocyte-MTX-PGs to predict EULAR moderate/good response at 3 months
Discussion
We investigated in this first longitudinal study whether erythrocyte-MTX-PG concentrations at 3 months, 6 months and 9 months after MTX start were associated with disease activity and adverse events in two RA cohorts. In both cohorts, an increase in MTX-PG concentrations is associated with a decrease in DAS28 during the first 9 months. Associations were strongest for MTX-PG2 and MTX-PG3. Cut-off concentrations (total MTX-PG ≥74 nmol/L) could be used to identify patients with moderate/good response to MTX treatment. In this study, we did not find an association between MTX-PG concentrations and adverse events. Besides our results from the present study in adult RA, we also show in an accompanying paper that MTX-PG3, MTX-PG4, MTX-PG5 and total MTX-PG concentrations are related to lower disease activity in JIA.13
MTX-PG concentrations in erythrocytes have been associated with response to MTX in patients with arthritis before.4 ,9–12 A study showed that erythrocyte MTX-PGs in responders and partial responders were significantly higher than in non-responders.9 Others showed that lower MTX-PG levels were associated with higher disease activity and lower decrease in DAS2810 and that patients with less decrease in DAS28 had lower MTX-PG levels.11 Others showed that erythrocyte MTX levels were significantly higher in patients responding to MTX therapy than in patients classified as non-responders.4 MTX-PG2 was found to have positive correlation with improvement in DAS28 over the first 16 weeks.12 Contrary to all these studies, MTX-PG4, MTX-PG5, MTX-PG3–5 and total MTX-PG were found higher in patients with high disease activity.2 These results were based on cross-sectional analyses with independent t tests, non-parametric Mann-Whitney U-tests and χ2 tests for patients divided into non-responders (DAS28>3.2) and responders (DAS28≤3.2). Furthermore, Stamp et al2 analysed patients who received MTX for a period of 3 months to 19 years (median 3 years). In the present study, however, disease activity was determined in patients starting MTX treatment using a continuous outcome variable (DAS28), which provided more power. Also, this enabled us to perform analyses with linear multivariate models so that we could adjust for a variety of possible confounders. Moreover in our cross-sectional approach all patients used MTX for the same length of time and the cross-sectional approach was repeated at three study visits. We also performed longitudinal analyses to determine the association of MTX-PGs with disease activity during the entire 9-month follow-up. Taken together, the cross-sectional analyses in a heterogeneous population may have caused discrepant results compared with the present study.
In line with other studies,2 ,9 ,13 ,23 we did not find any association between MTX-PG concentrations and adverse events. However, relationships between MTX-adverse events and higher concentrations of MTX-PG4 and MTX-PG5 have been reported.24 Also, in JIA an association between elevated liver function tests and gastrointestinal adverse events and high MTX-PG3–5 concentrations has been found.14 In our cohorts, all patients were treated with folic acid. This treatment has been proven to reduce MTX adverse events in patients with RA.25 This could have diluted the relationship between MTX-PG concentrations and adverse events.
As others have shown before,7 ,8 also in our cohorts MTX dose seems to have an effect on individual MTX-PGs. The higher MTX dose in the validation cohort caused higher MTX-PG3, MTX-PG4 and MTX-PG5 concentrations after 3 months (p≤0.001). After 9 months there were no differences in MTX-PG concentrations between cohorts. This may be explained because 28% of patients in the derivation cohort used 25 mg MTX/week after 9 months. Also, the longer MTX use could have caused higher MTX-PG concentrations.5
Maximum dose for MTX in RA is 25 mg/week. Performing TDM is most important in patients with lower MTX dose shortly after MTX start. We therefore determined cut-off values for MTX-PGs for achieving EULAR moderate/good-response in the derivation cohort at 3 months. Patients with total MTX-PG concentration <74 nmol/L after 3 months MTX may need dose increase to achieve lower disease activity. In the derivation cohort, 11 (14%) and in the validation cohort 35 (15%) patients achieved total MTX-PG concentrations ≥74 nmol/L after 3 months and were non-responders. This group of patients probably has no benefit from MTX despite an adequate total MTX-PG concentration and may need additional medication.
There are some inconsistencies between the cohorts in the associations of each PG with disease activity (table 3). This could be a dose effect since higher dose in the validation cohort drives the formation of longer MTX-PGs. This is visible in our study because MTX-PG3, MTX-PG4 and MTX-PG5 have higher concentrations after 3 months in the validation cohort. Based on our study, MTX-PG2 and MTX-PG3 would be the best candidates for TDM or prediction of clinical response. MTX-PG2 was slightly superior to MTX-PG3 in terms of the effect size (βs table 3) and diagnostic test accuracy (table 4). On the other hand, MTX-PG3 is more abundant and therefore, can be measured with more (analytical) precision (SEs table 3). Additionally, due to the kinetics of MTX-PG accumulation, the variability in the accumulation half-life of MTX-PG2 is larger than that of MTX-PG35 making MTX-PG3 a more suitable predictor to measure. However, from a clinical point of view, it would be even better to predict response and to optimise MTX dose much earlier than 3 months. To this aim, MTX-PG2 would be a better candidate because of its much shorter accumulation half-time than MTX-PG35 (see also table 2). Future prospective studies should investigate the predictive power of MTX-PGs measured much earlier after the start of MTX treatment. In the accompanying study, long-chain MTX-PGs were especially associated with lower disease activity in JIA.13
The hypothesis in this study was based on MTX working mechanism and therefore MTX monotherapy would have been ideal. However, more than half of patients in this study received other DMARDs, NSAIDs and corticosteroids besides MTX. These drugs also have an impact on disease activity and can cause similar adverse events. Therefore, all analyses were corrected for comedication. Corrected results were not significantly different from uncorrected results. This was not a pharmacokinetic study. However, we compared MTX-PG concentrations between 3 months, 6 months and 9 months. MTX-PG1 and MTX-PG2 achieved a constant concentration after 3 months and MTX-PG3, MTX-PG4, MTX-PG5 and total MTX-PG achieved constant concentration after 6 months. Dervieux et al7 reported steady-state after 7 weeks for MTX-PG1–5. Others5 showed that median times to reach steady state were 6.2 weeks, 10.6 weeks, 41.2 weeks, 149.0 weeks and 139.8 weeks, respectively, for MTX-PG1, MTX-PG2, MTX-PG3, MTX-PG4 and MTX-PG5. For MTX-PG4 and MTX-PG5 in our study it took less time (6 months) to reach constant concentration. Differences after 6 months may be too small to pick up with simple statistics. There were many differences in baseline characteristics of both cohorts. But, in the way we collected the data methodologically, both cohorts are almost identical. Having longitudinal data of MTX-PGs for three visits in first 9 months of MTX treatment in two different cohorts is unique. We find similar relationships between MTX-PGs and DAS28 in both cohorts, despite these differences between cohorts; this supports the conclusion that erythrocyte-MTX-PG levels are related to clinical response.
In conclusion, higher erythrocyte MTX-PG concentrations were associated with lower DAS28 during 9 months’ MTX treatment in patients with RA in two independent cohorts. MTX-PGs were not associated with adverse events. Erythrocyte MTX-PG concentrations are a potential tool for TDM of MTX therapy in patients with RA.
Acknowledgments
The authors thank all patients who are enrolled in the Treatment in Rotterdam Early Arthritis Cohort (tREACH) and the MTX in Rotterdam (MTX-R) cohort. Without their active cooperation, this study would not be possible. The tREACH comprises the following rheumatology centres: Erasmus University Medical Center, Rotterdam; Sint Franciscus Gasthuis, Rotterdam; Maasstad Ziekenhuis, Rotterdam; Vlietland Ziekenhuis, Schiedam; Admiraal de Ruyter Ziekenhuis, Goes and Vlissingen; Zorgsaam Ziekenhuis, Terneuzen; Albert Schweitzer Ziekenhuis, Dordrecht. The authors thank the following people from all centres, in alphabetical order, for their contribution in the tREACH and MTX-R cohort: Aartsen R, Alfenaar C, Alves C, Arendse R, Baak-Dijkstra M, Bal-overzier J, Basoski N, Beer S, Bonte F, Brouwer R, Buijs H, Buijs N, Colin E, Dolhain R, Fleming C, Fodili F, Gorp van J, Griffioen P, Grillet B, Hamelink B, Han K, Heil S, Hove van L, M, Jager de M, Joziasse S, krijger P, Krugten van M, Leeuwen van C, Luime J, Nijs J, Schilleman W, Schrauwen S, Sutter T, Verbree W, Voordt van der A, Vroed de M, Waart de M, Walter M, Wintjes H, Zelst van B, Zwang L. The authors wish to acknowledge P Westers for valuable assistance with the statistical analyses.
References
Supplementary materials
Supplementary Data
This web only file has been produced by the BMJ Publishing Group from an electronic file supplied by the author(s) and has not been edited for content.
Files in this Data Supplement:
- Data supplement 1 - Online table
Footnotes
Handling editor Tore K Kvien
JMWH and RdJ contributed equally.
Correction notice This article has been corrected since it was published Online First. The second author's surname has been corrected.
Contributors All authors fulfil the BMJ criteria of authorship and there is no one else who fulfils the criteria but has not been included as an author.
Funding tREACH: Unrestricted grant from Pfizer bv. (0881-102217). RdJ: Dutch Arthritis Association (06-02-402 and 09-1-402).
Competing interests None.
Ethics approval Medical ethics committee of Erasmus University Medical Center, Rotterdam, Netherlands.
Provenance and peer review Not commissioned; externally peer reviewed.
Linked Articles
- Clinical and epidemiological research