Article Text

Abstract
Objective To determine a concentration–effect curve of adalimumab in rheumatoid arthritis (RA) patients taking into account the effect of methotrexate (MTX) on concentration and effect and to identify a therapeutic range for adalimumab concentrations.
Methods In a prospective observational cohort study, 221 consecutive patients with RA were treated with 40 mg adalimumab subcutaneously every other week. The relationship between adalimumab trough level and clinical efficacy after 28 weeks of follow-up was determined in a concentration–effect curve. A receiver–operator characteristics (ROC) curve established a therapeutic cut-off concentration. The effect of MTX on adalimumab trough levels was shown by dividing patients that are and are not concomitantly using MTX in the concentration–effect curve and a concentration table.
Results Clinical efficacy improved with increasing adalimumab concentration and reached a maximum (mean disease activity score in 28 joints improvement of 2) with levels between 5–8 μg/mL. Levels exceeding 8 μg/mL were illustrated to have no additional beneficial effect on disease activity. The ROC curve showed an area under the curve of 0.695 (95% CI 0.626 to 0.764) for European League Against Rheumatism response and adalimumab levels: good responders versus non-responders and moderate responders. A cut-off of 5 μg/mL had a sensitivity of 91% and a specificity of 43%. Adalimumab levels are influenced by concomitant MTX use: patients on adalimumab monotherapy had a median adalimumab level of 4.1 μg/mL (IQR 1.3–7.7), whereas patients concomitantly taking MTX had a median level of 7.4 μg/mL (IQR 5.3–10.6, p<0.001).
Conclusions Adalimumab trough levels in a range of 5–8 μg/mL are sufficient to reach adequate clinical response. These levels are influenced substantially by concomitant MTX use.
- Pharmacokinetics
- Rheumatoid Arthritis
- Anti-TNF
Statistics from Altmetric.com
Introduction
Tumour necrosis factor (TNF) inhibitors have become an important part of healthcare worldwide for inflammatory diseases such as rheumatoid arthritis (RA), spondyloarthritis (SpA), psoriasis (Ps) and inflammatory bowel diseases. Although billions of dollars are being spent on these agents for patients worldwide and ‘raised the bar’ for goals of therapy for RA,1 ,2 detailed information about pharmacokinetics and pharmacodynamics is minimal. Studies undertaken to investigate these characteristics for adalimumab3–8 mainly focused on finding one single dose that is safe and effective for all patients even though there is a wide variation in pharmacokinetics between biological-treated patients.9
We previously observed that good responders had significantly higher serum concentrations than non-responders and moderate responders,9 and that concentrations reach a median steady state concentration within 28 weeks of treatment.10 The adalimumab level reached in serum depends on different factors such as absorption rate after subcutaneous injection, distribution throughout the body and clearance of the drug. These factors are influenced by physical differences between patients such as gender, age and disease state.11 ,12
Furthermore, pharmacokinetics is profoundly influenced by immunogenicity. The production of antidrug antibodies (ADAb) leads to neutralisation of the drug and the formation of drug–ADAb immune complexes that alter the clearance rate of the drug. In 94% of the patients who produce ADAb, these antibodies can be detected within the first 28 weeks of treatment,10 ,13 and over 98% of antiadalimumab antibodies inhibit the binding of adalimumab to TNF.14 Consequently, the administered dose will be partly or completely inactivated. Therefore, patients producing higher amounts of ADAb will have lower or no measurable concentrations of functional adalimumab (ie, adalimumab that can still bind to TNF).14–16 Immunogenicity of adalimumab in RA patients has been described to be associated with lower adalimumab concentration and a lower likelihood of minimal disease activity or clinical remission.17 ,18
Concomitant use of immunomodulators could diminish the formation of ADAb via a suppressive effect on the immune system, and in case of adalimumab, methotrexate (MTX) was confirmed to have an effect in reducing immunogenicity in a dose-dependent manner19 and could thereby result in higher adalimumab levels and enhanced therapy.
Although ADAb are closely linked with adalimumab concentration, with an antigen binding test they can only routinely be measured when adalimumab concentrations are low or are not detectable since this assay is susceptible for drug interference. Therefore, we focus on the adalimumab trough concentration as a parameter and not ADAb to monitor clinical response.15
This paper is divided into three parts. The first part reports the relationship between serum trough concentrations and clinical effect in RA patients who used adalimumab 40 mg sc every other week for 28 weeks, with or without concomitant use of MTX, providing a concentration–effect curve. The second part establishes a cut-off concentration of adalimumab between European League Against Rheumatism (EULAR) good versus non-responders and moderate responders. The last part elaborates on the effect of MTX on clinical response and adalimumab trough levels.
Patients and methods
Patients
For this study, data were obtained from a prospective observational cohort study consisting of 272 consecutive RA patients treated with either concomitant medication, including MTX and prednisone, or adalimumab monotherapy 40 mg every other week (Abbvie, Illinois, USA) at the Department of Rheumatology, Jan van Breemen Research Institute | Reade, Amsterdam, the Netherlands, as described previously.10 Some of these patients were also reported in previous papers.9 ,20–22
Patients were excluded from this study when the dosing scheme was not 40 mg sc every other week (n=36). An additional 15 patients were excluded due to lacking samples for repeated measurement of adalimumab concentrations with the newly validated protocol, as described below. Therefore, 221 patients remained for analysis. To analyse clinical response in patients up to 28 weeks of treatment, we used last observation carried forward for patients who discontinued treatment prematurely. The study was approved by the medical ethics committees of the Slotervaart Hospital and the Jan van Breemen Research Institute | Reade, Amsterdam, the Netherlands. All patients gave written informed consent.
Clinical response
Disease activity was assessed at baseline and after 28 weeks of therapy using the disease activity score in 28 joints (DAS28).23 Treatment response was defined according to the EULAR response criteria.24
Measurement of adalimumab concentrations
Serum samples were collected just before next injection after 28 weeks of treatment.10 ,15 To measure drug levels accurately, the previous reported ELISA was automated using a Tecan Freedom EVO platform13 and validated for measurements in serum and heparin plasma according to the Q2 (R1) guideline and Food and Drug Administration (FDA) guidelines.25 ,26 This validation showed a lower limit of quantification (LLOQ) of 10 ng/mL. Accuracy (expressed as % of theoretical value) and precision (expressed as % coefficient of variation) were determined using adalimumab spikes of 10 ng/mL, 4 μg/mL and 20 μg/mL, and were found to be 92–109% and <7%, respectively. Accuracy was not influenced by the presence of MTX or prednisolone. To confirm assay specificity, non-spiked sera from healthy donors (n=9) and biological-naïve RA patients (n=64, including rheumatoid factor-positive samples) were tested, which all rendered signals below the LLOQ of the assay. Furthermore, spikes using certolizumab pegol (50 μg/mL), infliximab (250 μg/mL), etanercept (2.4 μg/mL) and golimumab (3.1 μg/mL) did not render detectable signals.
Concentration–effect curve
To establish a concentration–effect curve at 28 weeks of treatment, all 221 patients were sorted from low to high adalimumab concentration with correlating ΔDAS28. These data were then stratified in 11 groups of 20 patients (last group 21 patients) giving a mean trough level and a mean ΔDAS28, which lowers the intervariability between patients.
To investigate the influence of MTX on adalimumab trough levels, patients were divided into a group concomitantly using MTX and the group of patients not using MTX. Because groups were smaller, they were stratified by groups of 10 patients instead of 20, with mean trough level and a mean ΔDAS28.
Statistical analysis
Baseline demographics
For differences in baseline demographic and clinical variables between response groups, independent samples t test, Mann–Whitney U test or χ2 test were used as appropriate. The threshold for significance was set at p<0.05. To analyse clinical response in patients up to 28 weeks of treatment, we used last observation carried forward for patients who discontinued treatment prematurely.
Receiver–operator characteristics analysis
Receiver–operator characteristics (ROC) analysis was used to obtain a representative cut-off value for adalimumab trough levels between good responders versus non-responders or moderate responders. To obtain this distinct value, a trade-off was made between sensitivity and specificity: when choosing a cut-off concentration that is too low, many patients would be wrongfully kept on treatment, in which the patient would be treated with an expensive drug that is not blocking inflammation. Choosing a cut-off concentration that is too high will wrongfully rank many good responders in a non-responder group. Patients were divided into a group of non-responders and moderate responders and a group of good responders according to the EULAR response criteria.
Logistic regression
For differences in adalimumab concentration between patients with and without MTX use and low-dose, intermediate-dose and high-dose use, logistic regression analysis was implemented.
The statistical software package (SPSS Inc, Chicago, Illinois, USA) V.15.0 and Graph Pad Prism 5 for windows were used to perform statistical analysis.
Results
Of the 221 patients enrolled in this study, 193 (87.3%) completed follow-up. The median follow-up period was 28 weeks (IQR 28–28). Patient characteristics are shown in table 1. There were statistically significant differences between patient’s sex (p=0.04), erythrocyte sedimentation rate (p<0.001), DAS28 (p=0.007), previous use of biologicals (p<0.001), concurrent MTX use (p<0.001) and MTX dose (p=0.001) for patients that did or did not achieve good EULAR response.
Baseline characteristics
Concentration–effect curve
In figure 1, the relationship between adalimumab trough levels and clinical response is shown. All 221 patients were sorted from low to high adalimumab concentration, with each dot representing the mean concentration and correlating ΔDAS28 per 20 patients (the last dot is 21 patients) with SDs showing intervariability between patients. There were 18 patients with no detectable adalimumab concentration, of which 89% could be ascribed to ADAb formation. To reach a DAS28 improvement of 1.2 or higher, concentrations around 3 μg/mL appear to be already sufficient. Serum levels up to 8 μg/mL show a positive association with ΔDAS28. However, it appears that levels above 8 μg/mL did not give further improvement of clinical efficacy.

Concentration–effect curve. (A) Each point represents the mean (with SD) of 20 data points of 221 trough level concentrations measured at 28 weeks of treatment stratified in ascending order with correlating ΔDAS28 mean (with SD). (B) Concentration–effect curve for adalimumab patients using concomitant methotrexate (MTX) divided into groups of 10 patients each. (C) Same curve for adalimumab patients not using MTX. DAS28, disease activity score in 28 joints.
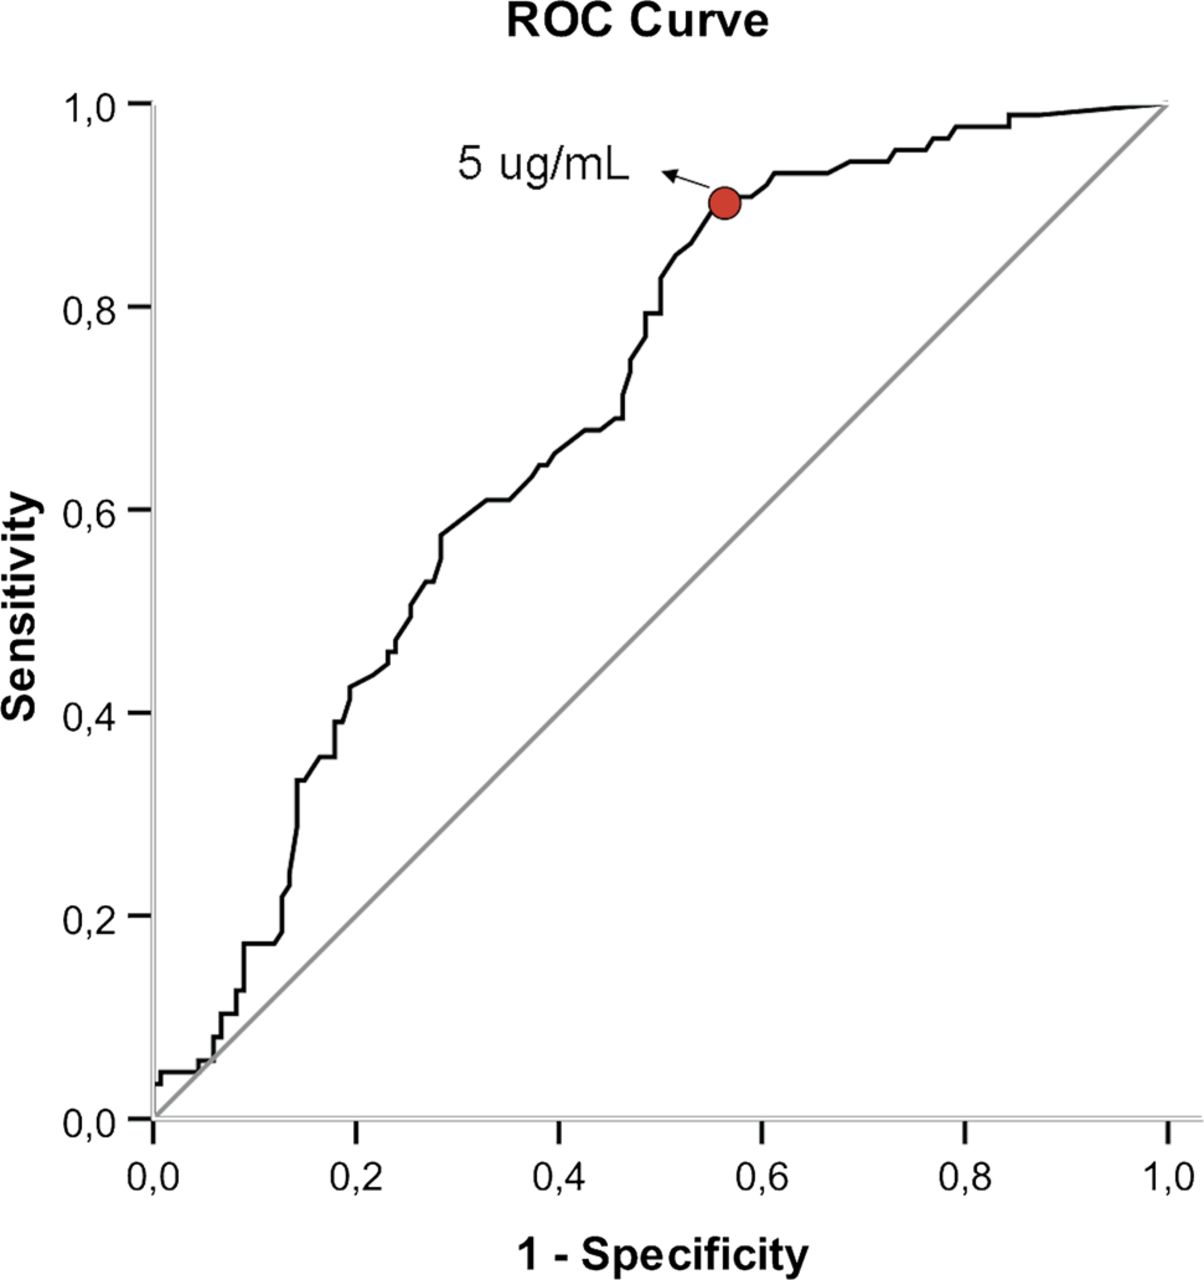
ROC curve
To establish a cut-off value, the patients were divided into a group of good responders and a group consisting of non-responders and moderate responders, according to the EULAR response criteria. The adalimumab concentrations were studied in a ROC curve.
Figure 2 shows an area under the curve (AUC) of 0.695 (95% CI 0.626 to 0.764, p<0.0001). At 5.0 μg/mL, a sensitivity of 91% and a specificity of 43% were found. The AUC in the ROC curve is significantly different from 0.5, concluding that adalimumab concentration has the ability to distinguish between the group of good responders and the group of moderate and non-responders.
ROC-curve analysis: EULAR non and moderate vs. good response. ROC-curve analysis with trough level concentrations of adalimumab. To optimally distinguish between EULAR non + moderate responders versus good responders a cut-off value of 5 ug/mL was found with an AUC of 0.695 (95% CI 0.626 to 0.764, p<0.0001), with a specificity of 43% and sensitivity of 91%.
Effect of MTX on adalimumab trough levels
The relationship between adalimumab concentration and clinical response is similar for patients concomitantly using MTX (figure 1B) and patients not using MTX (figure 1C). The patient group using MTX consists of 170 patients, and the patient group not using MTX consists of 51 patients. Both curves show the same trend but with a higher mean improvement of DAS28 for patients in the MTX group.
These two groups had an overall significantly different median adalimumab concentration. Patients on adalimumab monotherapy had a median adalimumab level of 4.1 μg/mL (IQR 1.3–7.7), with 80.4% non-responders or moderate responders and only 19.6% good responders. By contrast, patients concomitantly taking MTX had a median level of 7.4 μg/mL (IQR 5.3–10.6, p<0.001), and 45% of this population was good EULAR responder and 55% was non-responder or moderate responder.
Table 2 shows the median adalimumab concentrations for patients with no concomitant MTX use (n=51), low-dose MTX (5–10 mg/week, n=34), intermediate-dose MTX (12.5–20 mg/week, n=49) or high-dose MTX use (≥22.5 mg/week, n=87). There was a significant difference in adalimumab levels between patients not using MTX and low-dose, intermediate-dose and high-dose MTX users (p=0.034, 0.026 and 0.001, respectively), but no significant difference in levels was seen between the MTX user groups.
Adalimumab levels for patients on different dosages of MTX
Discussion
With the identification of this concentration–effect relationship of adalimumab in patients with RA, new opportunities have emerged to optimise treatment and reduce costs.
Although adalimumab concentrations vary widely between patients, with an AUC of 0.695, a drug level of 5 μg/mL has a predictive value of good clinical response according to the EULAR response criteria. At 5.0 μg/mL, a sensitivity of 91% and a specificity of 43% were found. Since there are also other reasons for non-response in addition to low drug levels, in other words, there are non-responders with adequate or high drug levels, specificity is not likely to be very high in our population.
Even in patients with low adalimumab concentrations around 3 μg/mL clinical effect was found. However, in patients without detectable drug levels, there was no clinical effect of adalimumab.
Most importantly, we illustrated no additional improvement of disease activity in patients with adalimumab concentrations exceeding 8 μg/mL.
In 2002, it was described that dose titration in adalimumab is feasible without losing clinical efficacy.27 We observed that levels exceeding 8 μg/mL compared with 5–8 μg/mL had no additional improvement of disease activity, which roughly comes down to one-third of the patients. These findings together imply that in the group of patients exceeding these concentrations it might be able to successfully lower the dose interval without losing clinical efficacy.
Overtreatment of this expensive drug results in a substantial waste of healthcare resources. Therefore, rather than avoiding or anticipating on toxic concentrations, therapeutic drug monitoring (TDM) of adalimumab would primarily aim to reduce costs without affecting treatment efficacy. However, it remains to be investigated whether patients will indeed retain an optimal clinical response with lower concentrations. A dose decrease might potentially lead to issues with increased immunogenicity since it is unknown whether lower adalimumab concentrations will result in breaking tolerance.
Vice versa, patients with low drug levels can be identified. For these patients, TDM-based dose titration might assist in restoring or improving clinical response, although costs of adalimumab may limit the usefulness of this approach in patients with RA. Moreover, this will only be useful in patients with absent or low ADAb levels.16
In our patient population, one of the main factors influencing pharmacokinetics was the concomitant use of MTX: on average, patients with adalimumab monotherapy had an adalimumab concentration of 4.1 μg/mL, whereas patients concomitantly treated with MTX had a median concentration of 7.4 μg/mL. One factor that can explain this effect is influenced by the fact that adalimumab patients concomitantly treated with MTX are less prone to develop ADAb,19 and since ADAb bind to the idiotype of adalimumab,14 functional drug levels are higher in patients taking concomitant MTX. This corresponds to our data, in which of the 18 patients having no detectable adalimumab concentration, 61% were on adalimumab monotherapy and 89% had detectable ADAb levels.
Furthermore, there might be a synergistic effect between MTX and adalimumab. Even in patients failing to respond to MTX, there will be some level of suppression of inflammation, resulting in fewer targets for adalimumab to bind to and therefore higher functional drug levels. Therefore, we can conclude that even the use of a low concomitant MTX dose aids in optimising treatment with adalimumab, at least during the first 6 months of treatment, since patients taking MTX might need a lower dose of adalimumab to obtain an effective concentration with maximal clinical benefits. Whether this effect of MTX will also be accomplished by other immunosuppressive agents needs further investigation.
These current results can probably be extrapolated to other biologics and inflammatory diseases. Especially for drugs in which pharmacokinetics are influenced by immunogenicity, however, half-life, dose, dosing interval and administration route influence pharmacokinetics and differ between drugs. Furthermore, concentrations needed to obtain maximal clinical effect will differ between inflammatory diseases. In addition to variable pharmacokinetics of drugs in different inflammatory diseases, MTX co-treatment is not common in all diseases and sometimes even discontinued before the initiation of a biologic.18 ,28 Even though MTX has no clinical effectiveness in some inflammatory diseases, that is, ankylosing spondylitis, it might be worthwhile to consider concomitant MTX therapy.
Important prerequisites for the construction of a concentration–effect curve are the availability of a standardised, validated assay and controlled timing of blood sampling.29 For the current study, we used our newly validated and automated adalimumab concentration ELISA. Furthermore, all patients in our cohort were requested to donate blood just before their next adalimumab injection. Nevertheless, there might have been some variation in this timing between patients adding to the variation in drug levels.
SDs of ΔDAS28 in figure 1 were large and overlapping between groups. This indicates that pharmacokinetics of a drug is not the only factor defining whether a patient is or will be a responder. Other factors contributing to response to therapy will be patient and disease related and need to be investigated further in order to optimise treatment in these patients. For instance, in some patients, the disease may not be driven by TNF and a TNF-inhibitor may not be the right type of drug. These patients might benefit from biologics with other mechanisms to suppress inflammation.
In conclusion, the concentration–effect curve is a new instrument in the treatment of adalimumab. We identified the therapeutic range of 5–8 μg/mL for maximal clinical effect. This range can be used for TDM-based treatment adaptations to titrate the dose of adalimumab towards this range. This will lead to a more optimal use of the expensive drug. Concomitant MTX use is an important factor influencing pharmacokinetics of adalimumab and should therefore, if possible, be used to optimise treatment with adalimumab. TDM-based individually tailored treatment will result in maximal clinical benefit with the lowest possible dose of the drug.
Acknowledgments
We thank all research nurses of the Jan van Breemen Research Institute | Reade for performing the clinical assessments for this study and everybody working at the Laboratory for Monoclonal Therapeutics, Sanquin Diagnostic Services, Sanquin, who were involved in preparing, validating and performing the assays for our research. The authors are also grateful to Teun van Gelder for providing comments on the statistical analysis.
References
Footnotes
-
Handling editor Tore K Kvien
-
MFP and CLK contributed equally to this article.
-
Contributors MFP, TR, CLK, LA and GW were responsible for study concept and design. MFP, CLK, DvdK, TR and MTN were responsible for acquisition of data. MFP, CLK, TR, LA, GW, DvdK and MTN were responsible for interpretation of data. MFP, CLK, DvdK, MTN, LA, TR and GW were responsible for drafting and critical revision of the manuscript for important intellectual content. TR, MTN and GW were responsible for study supervision. MFP is the guarantor.
-
.
-
Competing interests MTN has received consultancy fees from Abbott, Roche, Pfizer, MSD, UCB, BMS and Wyeth, payment for lectures from Abbott, Roche and Pfizer. TR has received honoraria for lectures from Pfizer and Abbvie. LA has received honoraria for lectures from Abbott, Roche and Pfizer. Funding of this study was provided by an unrestricted grant of Wyeth Pharmaceuticals. Wyeth Pharmaceuticals had no involvement in the study design; in the collection, analysis and interpretation of data; in the writing of the manuscript; or in the decision to submit the manuscript for publication. GW reports having received a research grant from Wyeth Pharmaceuticals and honoraria for lectures from Amgen, UCB, BMS, Abbvie and Pfizer. CLK honoraria for lectures from Pfizer, Abbvie and UCB. DvdK and MFP declare none.
-
Patient consent Obtained.
-
Ethics approval medical ethics committees of the Slotervaart Hospital, and the Jan van Breemen Research Institute | Reade, Amsterdam, the Netherlands.
-
Provenance and peer review Not commissioned; externally peer reviewed.