Article Text

Abstract
Objectives The objective of this proof of concept study was to evaluate alerts generated by a patient-reported outcome measure (PROM)-based algorithm for monitoring patients with rheumatoid arthritis (RA).
Methods The algorithm was constructed using an example PROM score of an equally weighted mean of visual analogue scale (VAS) general health, VAS disease activity and VAS pain. Based on the PROM score, red flags are generated in 2 instances: the target level of disease activity is not met; change in disease activity surpasses an early alert threshold. To reduce false alarms, 3 consecutive red flags are needed to trigger an alert to the physician. Time series data from patients included consecutively in the practice-based Nijmegen Early RA cohort were analysed to select an appropriate autoregressive integrated moving average (ARIMA) model. This allowed for advanced interpolation of PROM scores and weekly data evaluation. Alerts were evaluated against disease-modifying antirheumatic drug (DMARD)/biologic medication intensification registered in the cohort.
Results Data of 165 patients followed in their second year postdiagnosis were analysed. In 89.8% of 716 visits, the algorithm did not generate an alert and medication was not escalated. Positive predictive value, sensitivity and specificity were 24.6%, 55.6% and 69.7%, respectively. Comparable performance was found when analyses were stratified for baseline Disease Activity Score 28-joint count (DAS28) level.
Conclusions When using the algorithm to screen scheduled visits, the overall chance of missing patients in need of medication intensification is low. These findings provide evidence that an off-site monitoring system could aid in optimising the number and timing of face-to-face consultations of patients with their rheumatologists.
- Rheumatoid Arthritis
- Health services research
- Patient perspective
- Disease Activity
- Treatment
This is an Open Access article distributed in accordance with the Creative Commons Attribution Non Commercial (CC BY-NC 4.0) license, which permits others to distribute, remix, adapt, build upon this work non-commercially, and license their derivative works on different terms, provided the original work is properly cited and the use is non-commercial. See: http://creativecommons.org/licenses/by-nc/4.0/
Statistics from Altmetric.com
Key messages
What is already known about this subject?
Treat-to-target strategies have been shown to be effective in treating rheumatoid arthritis (RA). Most of these strategies are based on physician-reported measures, even though several patient-reported outcome measure (PROM)-based instruments to assess disease activity in RA exist.
What does this study add?
This study is a first proof of concept that a PROM-based algorithm can aid physicians in screening patients’ disease activity prior to scheduled outpatient visits taking place.
How might this impact on clinical practice?
An off-site monitoring system based on PROMs could aid in optimising the number and timing of face-to-face consultations of patients with their rheumatologists. Furthermore, this could help empower patients to manage their disease and make informed shared decisions with their physicians.
Introduction
Several patient-reported outcome measure (PROM)-based instruments exist to assess disease activity in rheumatoid arthritis (RA).1–7 To date, these instruments have predominantly been used for research purposes, though an evidence base for their use in monitoring strategies in daily practice is lacking. This is unfortunate, for PROM-based instruments offer the unique potential to get patients more involved in their disease management, while producing valuable data on the disease course from the patient's perspective. A secondary benefit is that PROM-based instruments are location-independent and time-independent, offering the possibility for flexible, patient-tailored off-site monitoring and management. A possible explanation why PROMs are not often utilised could be related to reports that show differing disease perceptions between patients and physicians.8–10 This means that the translation of PROM-based scores, and the changes thereof, into treatment targets and monitoring guidelines is far from straightforward. The question that arises is how patient-reported data on disease activity in RA should be interpreted and how well this corresponds to clinical medication decisions. The objective of this study was to evaluate alerts generated by a PROM-based algorithm for monitoring patients with RA.
Methods
Study design and setting
This study was a simulation study based on retrospective cohort data. Data from patients with a complete second-year follow-up after diagnosis, included consecutively in the Nijmegen early RA cohort between 2003 and 2011, were used. This study population was chosen as a proof of concept. It represents patients beyond the initial intensive phase of treatment, though where disease activity might still fluctuate, indicating the need for adequate monitoring.
PROM-based algorithm
On the basis of discussions with experts in the field of rheumatology (see Acknowledgements section) and meetings with patient partners attending Disease Activity Score 28-joint count (DAS28) training sessions at the Radboud University Medical Center, the idea of an off-site monitoring strategy based on PROM scores was formulated. As an example of a PROM score of RA disease activity, an equally weighted mean of: visual analogue scale (VAS) general health, VAS disease activity and VAS pain, was used. These component scores were chosen as they are often collected as core set measures and would be likely to be responsive to weekly variations in disease activity. Monitoring of the score is focused on two components:
The target level of disease activity;
Change in disease activity (current level vs best moving average of 3 past visits).
To allow for empowerment of patients in the monitoring of their disease, preliminary targets (which can be optionally tailored to the individual patient) are based on clinimetric measures, which include the patient perspective. Patient acceptable symptom state (PASS) is used for the upper level of disease activity. To prevent favourable scores gradually returning to higher levels, an early alert threshold for change in disease activity is based on a minimal important change (MIC) value. Default values for PASS and MIC are derived from an OMERACT consensus meeting and are set at 40 mm and 20 mm, respectively.11 A downside to MIC or PASS cut-off values is that misclassification could arise when monitoring is based only on either MIC or PASS.12–15 For example, a patient might have a positive perception of the achieved disease course trajectory (MIC), however, he or she might not have achieved the desired health state (PASS). When solely focusing on either MIC or PASS, this can lead to misinterpretation of the PROM score and the views of the respective patient. Therefore, the algorithm monitors the PROM score on MIC and PASS targets, and if either one is not met, red flags are generated (figure 1).
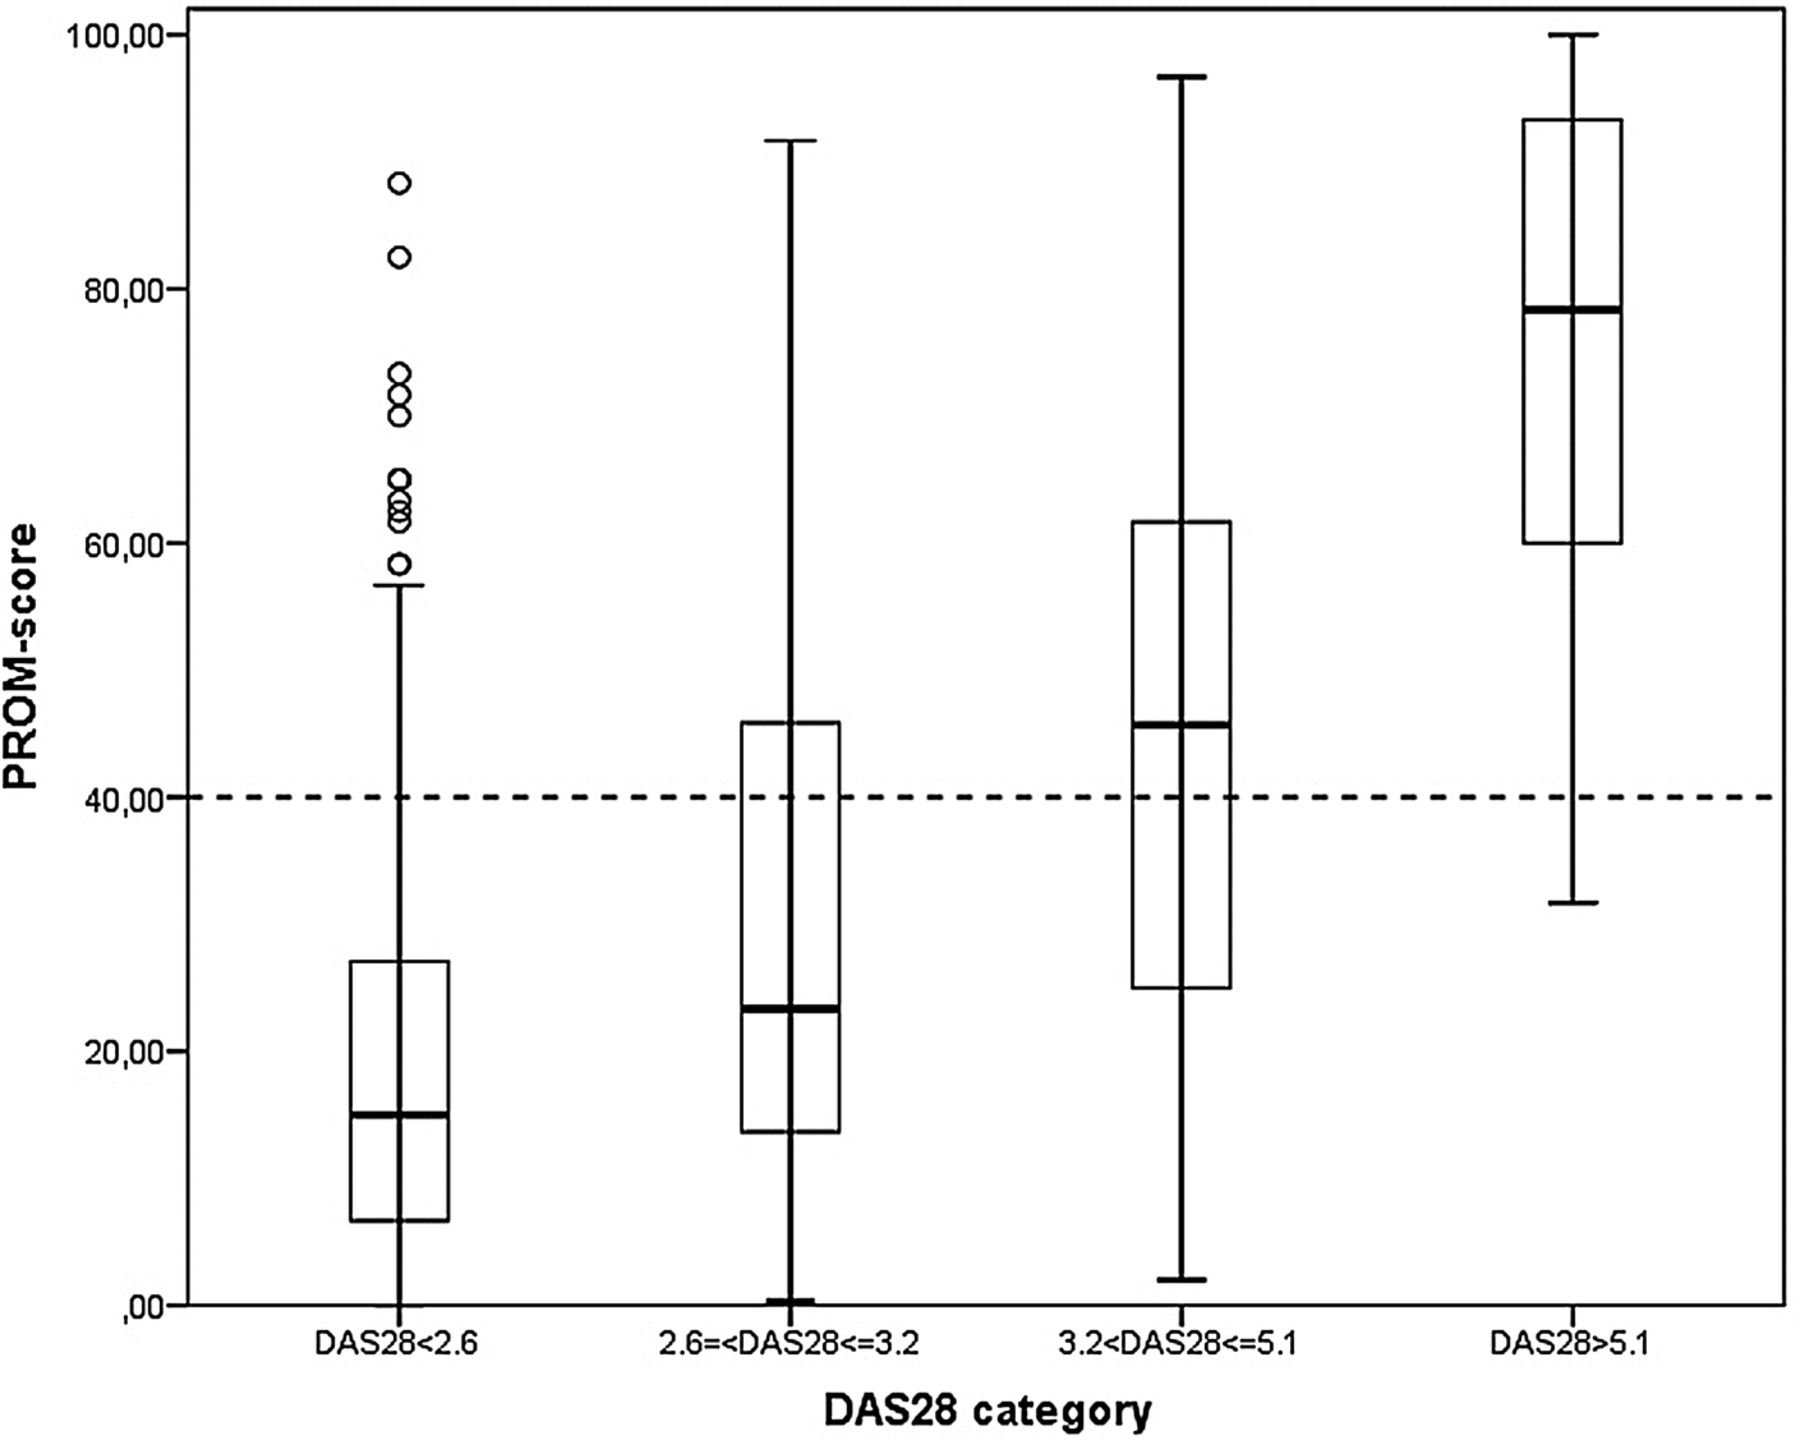
Boxplots of patient-reported outcome measure (PROM) scores by Disease Activity Score 28-joint count (DAS28) categories.
To allow for timely detection of high disease activity in need of consultation, a weekly measurement frequency was proposed. PROM-based scores can, however, fluctuate considerably from week to week.16 To reduce the chance of many false alarms, three consecutive red flags are needed to trigger an alert to the physician, indicating the need for further consultation (figure 1). After three red flags and an alert is generated, the three-span best moving average resets and the algorithm recalibrates over a 4-week period, to allow for any therapy alterations to take effect before new red flags are generated.
Generation of weekly data based on existing data
As mostly only monthly and three monthly data were available in our registry, weekly data needed for the evaluation of the algorithm had to be simulated. This was carried out by an advanced form of interpolation. First, fluctuations of PROM scores of 29 patients who were stable on synthetic disease-modifying antirheumatic drugs (sDMARD) and/or biologic DMARDs (bDMARD), with at least 10 assessments, were inspected using time series analysis to select an appropriate forecasting model. These patients were not included in the algorithm evaluation. Based on the time series analysis, an autoregressive integrated moving average (ARIMA 1,0,0) with heterogeneous variances and random intercept was fitted to the data.17 A correlation of 0.5 between monthly scores was found, with a SD between 11 and 13.5 around the mean PROM score at each time point characterising residual variance. Next, weekly data were simulated by first interpolating weekly data between registered data minus random error based on the residual variance seen in stable patients and then adding random error to the interpolated scores. Supplementary information on the ARIMA model selection and data simulation can be found in online supplementary appendix I.
Statistical evaluation of the algorithm
Alerts were evaluated against sDMARD or bDMARD medication intensification within 1 month of the outpatient visit, as an external standard. Intensification was defined as an increase in dose/frequency or start of new drug. Performance of the algorithm was analysed by cross-tabulating alerts generated by the algorithm against the external standard, and inspecting positive predictive values (PPVs) and negative predictive values (NPVs). Analyses were also stratified according to DAS28 level at 12 months. All analyses were performed using IBM SPSS Statistics V.20.0.0.2.
Results
Data of 165 patients with RA visiting the outpatient clinic 716 times were available for analysis; most patients (90.3%) had between 4 and 6 visits in the 12 months of follow-up in the second year postdiagnosis. These patients represent a sample of a population that is seen in daily clinical practice (table 1). Most patients were female, rheumatoid factor positive and had short disease duration at the time of diagnosis. Disease activity was low (DAS28<3.2) for 55% of the patients, and most patients used methotrexate. Of the 716 visits, a total of 108 medication intensifications took place within 1 month of the visit: 31 dose increases and 77 starts of new medications. Consequently, the a priori chance of medication intensifications was 15.1%.
Patient characteristics at first visit during second-year follow-up postdiagnosis
The association of DAS28 categories with the example PROM score is illustrated in figure 2. Validity of the PROM score and the 40 point threshold used in the algorithm is substantiated as most patients below the threshold are categorised in low or remission DAS28 categories. Figure 3 shows an example of how these simulated PROM scores result in fluctuations that more closely resemble fluctuations seen in practice than those based on standard linear interpolation of registered PROM scores.

Results of advanced interpolation based on time series analysis versus standard linear interpolation for five randomly drawn patients (PROM, patient-reported outcome measure).
An overview of the algorithm performance is shown in table 2. The NPVs represent the proportion of visits without medication intensification in all cases where the algorithm indeed did not generate an alert, which was 424/472 (89.8%). In 18/48 (37.5%) of the cases where there was a false-negative result, this was due to intensification of the current drug and 11/18 (61.1%) of these intensifications were small increases in methotrexate doses (2.5–5 mg). The PPVs represent the proportion of visits with medication intensification in all cases where the algorithm also generated an alert. This was the case in 24.6% of all visits, which is an improvement over the a priori chance of 15.1%.
PROM-based algorithm performance
The performance, stratified according to DAS28 level at baseline (12 months postdiagnosis in this analysis), showed very similar results when compared with overall performance (table 2). As is to be expected, the a priori chance of medication intensification and PPVs increase with higher DAS28 levels.
Discussion
The objective of this study was to evaluate alerts generated by a PROM-based algorithm for monitoring patients with RA, against intensifications of antirheumatic medications. The PPVs, though low, were an improvement over the a priori chance of medication intensification. In case an alert is raised, the overall chance of medication intensification was 24.6% instead of 15.1%. The NPV of 89.8% indicates that the algorithm performed very well at indicating which patients were not in need of medication intensification, and this was an improvement over the a priori chance of 84.9% not intensifying medication. In total, this means that knowing the result of the algorithm improves the a priori knowledge by 14.4% (9.5%+4.9%). If the algorithm is used in daily practice to screen scheduled visits, this could mean a possible reduction of visits, with a relatively small overall chance of missing patients in need of medication intensification. The sensitivity and specificity values were 55.6% and 69.7%, respectively. Although these values might seem low from a diagnostic perspective, they are quite promising for a low cost, low effort screening tool. One must also not forget that, due to a low prevalence of medication intensification, the absolute number of visits with medication intensification missed by the algorithm is small (48), and relative to the total number of visits (716), this amounts to a low overall chance of missing these patients (48/716=6.7%). Moreover, the value of using PROMs for monitoring extends beyond improving diagnostic performance of fixed monitoring strategies. By actively engaging patients in relating their symptoms to a disease activity score (DAS), they are better informed on the concept of disease activity. Patients can then become more empowered to make informed shared decisions with their physicians. Vice versa, rheumatologists become more informed about their patients’ experiences of their disease in between visits. A patient's experience might not always correlate with clinical measures of disease activity, as PROMs can be influenced by irreversible damage. However, knowing how patients perceive their disease is valuable, as this will form the basis on which patients will judge their disease course and make decisions with regard to treatment.
The findings of this study provide a first proof of concept that an off-site monitoring system could aid in optimising the number and timing of face-to-face consultations of patients with their rheumatologists. An alternative analysis where a single red flag would trigger an alert resulted in a lower PPV (22.4%), due to a higher false-positive percentage. The monitoring performance of the proposed algorithm might be further enhanced if it is tailored to the patient as time passes and more information about each patient is collected. Based on individual patient characteristics, for example, Anti–citrullinated protein antibody (ACPA) status, the patients’ individual goals and/or sensitivity to detect changes in their disease course, the number of red flags needed to trigger an alert, the target level and/or early alert threshold could be adjusted to best suit the patient.18
As this study is a first proof of concept, it is not without limitations. First, we chose to demonstrate the algorithm with an example PROM score based on VAS general health, VAS disease activity and VAS pain. Some studies have reported interchangeability of VAS general health and VAS disease activity for calculation of the DAS28.19 ,20 This does not automatically mean that they measure the same health aspect, because the VAS scores are heavily down-weighted in the DAS formulae and correlations between the actual VAS scores are often only moderate.19–21 In our study population, the correlations between the three component VAS scores ranged, respectively, between 0.81, 0.82 and 0.86, and differed more than 10 points for approximately 25% of individual patients. A second limitation, due to the retrospective study design, was the lack of weekly data to evaluate the algorithm. To overcome this, we used an advanced form of interpolation based on time series analysis to make the best use of existing data. The resulting individual patient data (sample of 5 patients shown in figure 3) showed weekly fluctuations following long-term linear trends. These patterns correspond quite well to those that have been reported by Blanchais et al,16 who have presented data of 26 patients who were followed on a weekly basis. Similar to their study, where Routine Assessment of Patient Index Data 3 (RAPID3) scores within patients varied up to 3 points (out of 10) from 1 week to the next, our weekly generated PROM scores varied up to 24 points (out of 100). A third limitation of this study was that it only focused on medication intensification as an outcome to measure performance. There are, of course, other reasons, such as adverse drug effects, that would call for consultation with a physician. This brings to light an important consideration when trying to use monitoring algorithms; these cannot, and should never, completely replace common sense or clinical reasoning. In cases such as adverse drug effects, patients should contact their physician in the same manner as they would do in standard daily practice.

Preliminary PROM-based algorithm (MIC, minimal important change; PASS, patient acceptable symptom state; PROM, patient-reported outcome measure; VAS, visual analogue scale).
Further investigation into the optimal PROM score, measurement frequency and algorithm parameter values to be used for off-site monitoring seems warranted, given the many potential benefits and the positive results of this proof of concept study. The value of a PROM-based algorithm lies in systematically collecting individual patient data, utilising it with the best knowledge for current practice and further inspecting it to optimise future practice. Making more use of PROMs for monitoring in daily practice could lead to effective and efficient strategies, in which care is centred on the patient, who is empowered to manage the disease and make informed, shared decisions with their physicians.
Acknowledgments
The authors would like to acknowledge the following experts for their input in the development of the algorithm during Patient-Reported Outcomes expert panel meetings organised by Pfizer: James Fries, Paul Emery, Peter Taylor, Alessandro Ciapetti, Tore Kvien, Bernard Combe, Angela Zink, Tauny Southwood, Kurt de Vlam, Georg Schett, Angelo Ravelli and Ignazio Olivieri.
References
Supplementary materials
Supplementary Data
This web only file has been produced by the BMJ Publishing Group from an electronic file supplied by the author(s) and has not been edited for content.
- Data supplement 1 - Online supplement
Footnotes
Twitter Follow Jos Hendrikx at @joshendrikx
Funding An unrestricted grant was given from Pfizer to the Department of Rheumatology of the Radboud University Medical Center to evaluate alerts generated by a patient-reported outcome measure (PROM)-based algorithm for monitoring patients with rheumatoid arthritis.
Disclaimer The study design, data analysis and interpretation of results were performed independent of Pfizer.
Competing interests None declared.
Provenance and peer review Not commissioned; externally peer reviewed.
Data sharing statement No additional data are available.