Article Text

Abstract
Objective To assess changes in work productivity in patients who have achieved response using etanercept (ETN) 50 mg+methotrexate (MTX) (phase I) are randomised to ETN 25 mg+MTX versus MTX versus placebo (phase II) and then withdrawn from treatment (phase III).
Methods Patients included in the analysis were in employment entering phase II of the PRIZE trial and had one or more follow-ups. Phase II was a 39-week, randomised and double-blind comparison of the 3 dose-reduction treatments. Phase III was a 26-week observational study where treatment was withdrawn. The Valuation of Lost Productivity was completed approximately every 13 weeks to estimate productivity impacts from a societal perspective.
Results A total of 120 participants were included in our analyses. During phase II, ETN25+MTX or MTX improved paid work productivity by over 100 hours compared with placebo, amounting to a gain of €1752 or €1503, respectively. ETN25+MTX compared with placebo gains €1862 in total paid/unpaid productivity. At week 52, the 3-month paid work productivity loss was 21.8, 12.8 and 14.0 hours, respectively. The productivity loss increased at week 64 from week 52, dropped at week 76 for all treatment groups and then continued rising after week 76 for the placebo group (71.9 hours at week 91) but not for the other 2 groups (21.9 hours for ETX25+MTX and 27.6 hours for MTX).
Conclusions The work productivity gain in phase I as a result of ETN50+MTX was marginally lost in the dose-reduction treatment groups, ETN25+MTX and MTX, but substantially lost in the placebo group during phase II.
Trial registration number NCT00913458; Results.
- Rheumatoid Arthritis
- Arthritis
- Early Rheumatoid Arthritis
- Economic Evaluations
This is an Open Access article distributed in accordance with the Creative Commons Attribution Non Commercial (CC BY-NC 4.0) license, which permits others to distribute, remix, adapt, build upon this work non-commercially, and license their derivative works on different terms, provided the original work is properly cited and the use is non-commercial. See: http://creativecommons.org/licenses/by-nc/4.0/
Statistics from Altmetric.com
Key messages
What is already known about this subject?
Early aggressive treatment in patients with rheumatoid arthritis (RA) can reduce work productivity loss.
What does this study add?
This study assesses changes in work productivity in patients with early RA during reduced-dose regimens, step-down therapy and treatment-free periods after early aggressive treatment.
How might this impact on clinical practice?
The work productivity gain in phase I as a result of etanercept 50 mg (ETN50) plus methotrexate (MTX) is marginally lost in the dose-reduction or step-down treatment groups, ETN25+MTX and MTX, but substantially lost in the placebo group during phase II of the PRIZE trial.
Reducing the dose of ETN or stepping down from ETN plus MTX to MTX alone sustains improvements in paid work productivity gained from the treatment-induction phase among the patients who still remain in the treatment.
The use of ETN25+MTX in comparison to placebo results in gains of ∼€2000 in total paid and unpaid productivity during phase II.
Introduction
Early aggressive treatment in persons with rheumatoid arthritis (RA) has been found to limit structural damage and functional impairment resulting in greater clinical improvement.1–4 Consequently, early aggressive treatment can also improve patient work productivity. For example, several clinical trials have found that early aggressive treatment reduces absenteeism and RA-related work disability.5–7 However, only taking into account the reduction in job loss and absenteeism provides partial evidence of the overall productivity effect of early intervention. A full measurement of productivity loss includes employment status change (including job loss, reduced routine work hours and job change), absenteeism, presenteeism (reduced work productivity while working) and unpaid work productivity loss (housework, shopping, childcare, etc) due to poor health.8
Estimating productivity loss in monetary terms enables all these components to be combined in a single unit—productivity cost. However, only recently has the economic theory necessary to properly estimates productivity costs due to poor health been conceptualised.8 In this, productivity loss due to health problems is seen as the output loss due to reduced labour input attributable to poor health. To calculate productivity costs, labour time input loss is monetised by multiplying the time loss by the wage rate and a multiplier that adjusts the wage rate to represent actual output loss due to reduced labour input.8 ,9
The PRIZE trial was conducted to evaluate the effect of reduced-dose regimens, step-down therapy and treatment-free after early aggressive treatment in patients with early moderate-to-severe RA. The study findings have suggested that after achieving low disease activity with early aggressive treatment, a reduction in or withdrawal of biological treatment may be reasonable in some patients, especially those who have sustained remission.10 These treatment regimens are desirable to address questions on patient preferences, the safety of long-term drug exposure (adverse events) and the cost burden of biological therapy.10 It would also be more convenient for patients to reduce treatment with biological therapy considering their routines of administration (injectable biologics or infused biologics).
It has previously demonstrated that during phase I (open label) of the PRIZE trial, etanercept 50 mg (ETN50) plus methotrexate (MTX) can reduce work productivity loss.11 The objective of this study was to comprehensively assess changes in work productivity in patients with early active RA during the entire PRIZE study period, especially during the dose-reduction phase.
Methods
Study design
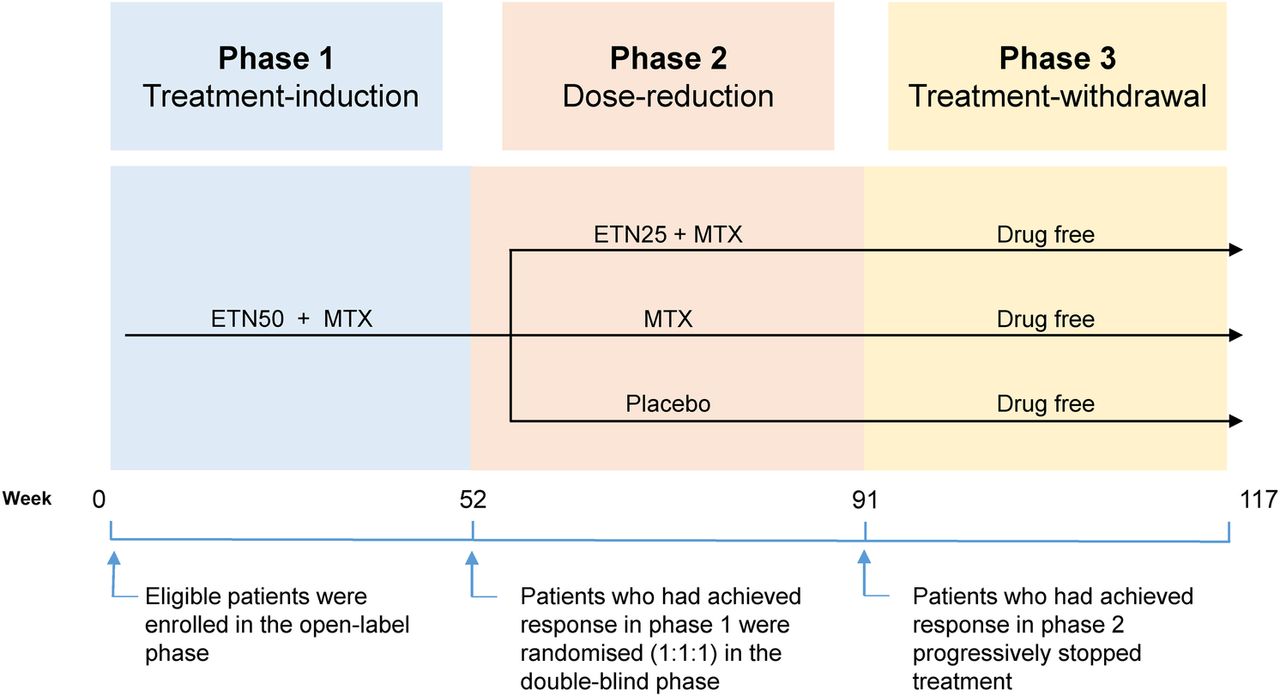
This is a three-phase study conducted at 57 centres in Europe and Asia (figure 1). The participants were eligible for enrolment if they had symptom onset within 12 months and active disease as indicated by a Disease Activity Score based on a 28-joint count (DAS28) >3.2. All patients provided written informed consent before participation in the study. Phase I (treatment-induction phase) of the PRIZE trial was a 52-week open-label, single-arm period in which all participants were treated with ETN50+MTX. Participants who were not in sustained remission or who did not have low disease activity (DAS28>3.2) at the week 39 visit were withdrawn from the study and treated in accordance with local clinical practice.10 Phase II (dose-reduction phase) was a 39-week, randomised and double-blind comparison of drug reduction treatments, ETN25+MTX, MTX or placebo, in participants who had achieved response during phase I. Participants with DAS28>3.2 at visit week 56 or 64 were given a boost of corticosteroids. If their DAS28>3.2 at the subsequent visit, the participants were then withdrawn from the study and treated entirely at the discretion of the investigator. Phase III (treatment-withdrawal phase) was a 26-week observational phase in which phase II responders progressively stopped treatment. It included a 2-week to 4-week period of double-blind MTX tapering (depending on the optimised MTX dose), followed by an observational phase until week 117. More details on the study design have been described in previous study.10

Study design. ETN50+MTX, etanercept 50 mg plus methotrexate; ETN25+MTX, etanercept 25 mg plus methotrexate; MTX, methotrexate.
Measurements of clinical outcomes and quality of life
Patient demographic characteristics, medication and medical history, clinical outcomes and quality of life at week 52, the starting time point in phase II, were measured and compared among the three treatment groups (analysis of variance (ANOVA) and Kruskal-Wallis test were used for continuous variables and χ2 test or Fisher's exact test for categorical variables). Clinical outcomes included patient assessment of general health, patient pain assessment, patient global assessment of disease activity and physician global assessment of disease activity using visual analogue scales, functional disability measured by Health Assessment Questionnaire, fatigue measured by Functional Assessment of Chronic Illness Therapy and patient acceptable symptom state (PASS). For all clinical outcomes except PASS, the higher score indicates the worse status. Quality of life was measured using EuroQol-5 Dimensions and short form-36. More details in these measurements have been shown in previous study.10
Measurement of productivity loss
We used the Valuation of Lost Productivity (VOLP), a validated questionnaire in patients with RA, to measure all the time input loss components (absenteeism, presenteeism, employment status changes and unpaid work productivity loss) as well as information on job and workplace characteristics.12 Wage multipliers were estimated based on the characteristics to value the productivity loss due to the reduced time input of workers.9
In this study, the VOLP was measured approximately every 13 weeks. The main VOLP outcomes of interest at each visit were (1) paid work productivity loss (hours) in the past 3 months, the sum of hour loss from absenteeism, presenteeism and employment status changes; (2) unpaid work productivity loss (hours) in the past 7 days, quantified by the number of hours of getting help on unpaid work activities and (3) total costs of lost productivity in the past 3 months, the sum of the costs of paid and unpaid work productivity loss.
Our primary outcomes were the VOLP outcomes cumulative during phase II study period and they were (4) paid work productivity loss (hours and costs); (5) unpaid work productivity loss (hours and costs) and (6) total costs of lost productivity. These three outcomes were the sum of the corresponding outcomes at weeks 64, 76 and 91. The Last Observation Carried Forward (LOCF) method was applied for any missing follow-ups including patient withdrawn due to their high DAS to calculate these cumulative outcomes.
We defined productivity loss as an outcome that was calculated at each time point or cumulatively during a period. A productivity gain was defined when comparing outcomes between different groups or time points. For example, when comparing productivity loss between treatment groups, if patients in the ETN+MTX group had reduced productivity loss (hours or costs) in comparison to those in the placebo group, this was referred to as a gain in productivity for patients in the ETN+MTX group. When productivity loss decreased over time compared with baseline, this was referred to as a productivity gain during the time period.
Since this was a multinational trial, we cost paid work loss by converting the self-reported income into Euros in 2010 using Purchasing Price Parties reported by World Bank.13 For unpaid work productivity loss, we used the 2010 hourly earnings (Euro) reported by the Eurostat for service and sales workers in each country.14 The costs were then calculated as ‘lost work hours×hourly wage×multiplier’.9 Costs with multipliers are presented in the article, while costs without multipliers are in the online supplementary appendix. The details on VOLP productivity outcome definitions can also be found in the online supplementary appendix.
supplementary appendix
Primary analyses
Our primary analyses were to compare the cumulative productivity loss among three treatment groups during phase II. The participants who were employed at week 52 and had at least one follow-up visit with the VOLP during phase II (weeks 64, 76 or 91) were referred to as phase II study sample in this article. Since there were three treatment groups, multiple comparisons were conducted between treatment groups for the main VOLP outcomes of interest: Bootstrap two-sample t-test for continuous variables and χ2 test or Fisher's exact test for categorical variables.15 ,16
Since the measures of total productivity loss during phase II were highly skewed with majority of 0, zero-inflated models were used to measure the effect of treatment on paid work productivity loss and a two-part model was used for costs of lost paid productivity and total costs of lost productivity. For the paid work productivity loss (in hours) during phase II, zero-inflated negative binomial (ZINB) models were chosen according to the Vuong test.17 For the costs of lost paid productivity and total costs of lost productivity in the 1-year study period, two-part model (logistic regression for the probability of no costs and generalised linear model with γ distribution and log link for non-zero costs) was performed for the comparison. Owing to a small number of patients who had any unpaid work productivity loss during phase II in each group, a logistic regression was used only to compare the proportion of zero unpaid work productivity loss between treatment groups.
For each of the VOLP outcomes, the model included treatment variables and the corresponding VOLP outcome at week 52. For example, for paid work productivity loss in the 39-week study period, the model includes treatment variable and paid work productivity loss in the past 3 months at week 52. We included only the VOLP outcome at week 52 in each model, as clinical outcomes at week 52 and patient demographic characteristics should be balanced between treatment arms due to the randomised design, and given the small size, the VOLP outcome at week 52 is the best choice to address the potential confounding bias.
Furthermore, to improve the interpretation of the coefficients of the ZINB and two-part models, we computed the expected values for each treatment group, respectively, while holding the model covariates at their mean value for all patients at week 52 shown in online supplementary table S1. The difference in expected values between groups was referred to as the marginal effects. Since the continuous VOLP outcomes were highly skewed with majority equal to 0, bootstrap method was used for p value adjustment in the multiple comparisons between treatment groups and for the comparisons of regression model estimates between treatment groups.18–20
Secondary analyses
Our secondary analyses focused on measuring the changes in 3-month paid productivity loss (hours) over the entire study period. The 3-month paid productivity loss in hours at each visit was plotted for phases 1, 2 and 3, respectively. For this analysis, the samples considered in phase I were the phase II study sample who were also employed at baseline (week 0) and had at least one VOLP follow-up visit during phase I. The samples considered in phase III were the phase II study sample who were also employed at week 91 and had at least one VOLP follow-up visit during phase III.
Results
Phase II patient characteristics at week 52
Among the total of 193 patients who entered phase II, 125 reported that they were still employed at week 52, and 68 were unemployed. A total of 120 employed patients who had at least one follow-up with the VOLP were included in our final analysis for phase II: 39 patients in the ETN25+MTX treatment group, 49 in the MTX group and 32 in the placebo group. The flow chart of the study cohort from phase II to phase III is in the online supplementary figure S1. All the characteristics were not significantly different among the three treatment groups except patient general health score and patient global assessment score (p<0.1) at week 52 using ANOVA (table 1). The patient self-assessment of general health status (13.19 (SD: 16.37)) and patient global assessment of disease activity (10.41 (16.64)) were worse in the placebo group than the groups treated with ETN25+MTX (8.72 (11.74) and 5.56 (6.41), respectively) or MTX alone (7.31 (7.33) and 4.80 (7.16)). Kruskal-Wallis test results did not show any significant differences among groups (see online supplementary table S2).
Phase II patient characteristics at week 52
VOLP outcomes at weeks 52, 64, 76 and 91 during phase II
Table 2 presents the main VOLP outcomes by treatment groups at each visit. No significant differences in the continuous VOLP outcomes were found between treatment groups at each visit. Compared with the other two groups, patients in the ETN25+MTX group gained hours in paid work productivity at each follow-up visit (weeks 64, 76 and 91), but the gains were not statistically significant. Patients in the ETN25+MTX group and the MTX group kept gaining productivity in monetary term from week 64 to week 91 compared with the placebo group. Again, all the gains were not significant. Compared with the placebo group, significantly (at margin) fewer patients had unpaid work loss in the ETN25+MTX group at weeks 76 and 91, and fewer patients had any costs at week 76.
Main VOLP outcomes of interest by treatment groups at each visit during phase II
Cumulative VOLP outcomes during phase II
Table 3 presents the cumulative VOLP outcomes of interest during phase II. Patients in the ETN25+MTX group gained hours in paid and unpaid work and money in total productivity (62.91 (144.28) hours, 49.67 (163.68) hours and €1332.43 (2457.24), respectively) in comparison to those in the placebo group (160.54 (312.50) hours, 172.25 (353.75) hours and €3797.97 (6317.85), respectively). However, only the total monetary productivity gains of the ETN25+MTX group compared with the placebo group were marginally significant (p=0.101). Furthermore, the difference between the proportion of patients who had unpaid work productivity loss was significant between the ETN25+MTX group and the placebo group (p=0.012).
Cumulative productivity loss during phase II by treatment groups
Table 4 presents the expected values and marginal effects from models comparing the phase II cumulative productivity loss between treatment groups (see online supplementary table S3). According to the logistic regression results, patients in the ETN25+MTX group were 11.4 times (CI 1.9 to 67.1) more likely to have no unpaid work productivity loss than those in the placebo group. For cumulative paid work productivity loss, while holding covariates at their mean at week 52, the expected probability of being zero was 60% (CI 41% to 77%) for the ETN25+MTX group, 55% (38% to 70%) for the MTX group and 37% (20% to 55%) for the placebo group; the expected paid work hour loss in part 2 was 135 (67 to 222), 141 (91 to 192) and 261 (130 to 442) hours, respectively; overall, the expected paid work productivity loss was 54 (21 to 97), 63 (34 to 100) and 164 (75 to 281) hours, respectively, with a 111-hour gain (12 to 234) of the ETN25+MTX group and a 101-hour gain (5 to 222) of the MTX group compared with the placebo group. Correspondingly, patients in the ETN25+MTX group and the MTX group gained €1752 (€291 to €3459) or €1503 (€71 to €3238), respectively, in paid work. Overall, patients receiving ETN25+MTX gained €1862 (CI €341 to €3585) in total productivity compared with patients receiving placebo.
Expected values for cumulative productivity loss during phase II by treatment groups and marginal effects from the regression models
3-Month paid work productivity loss over the entire study period
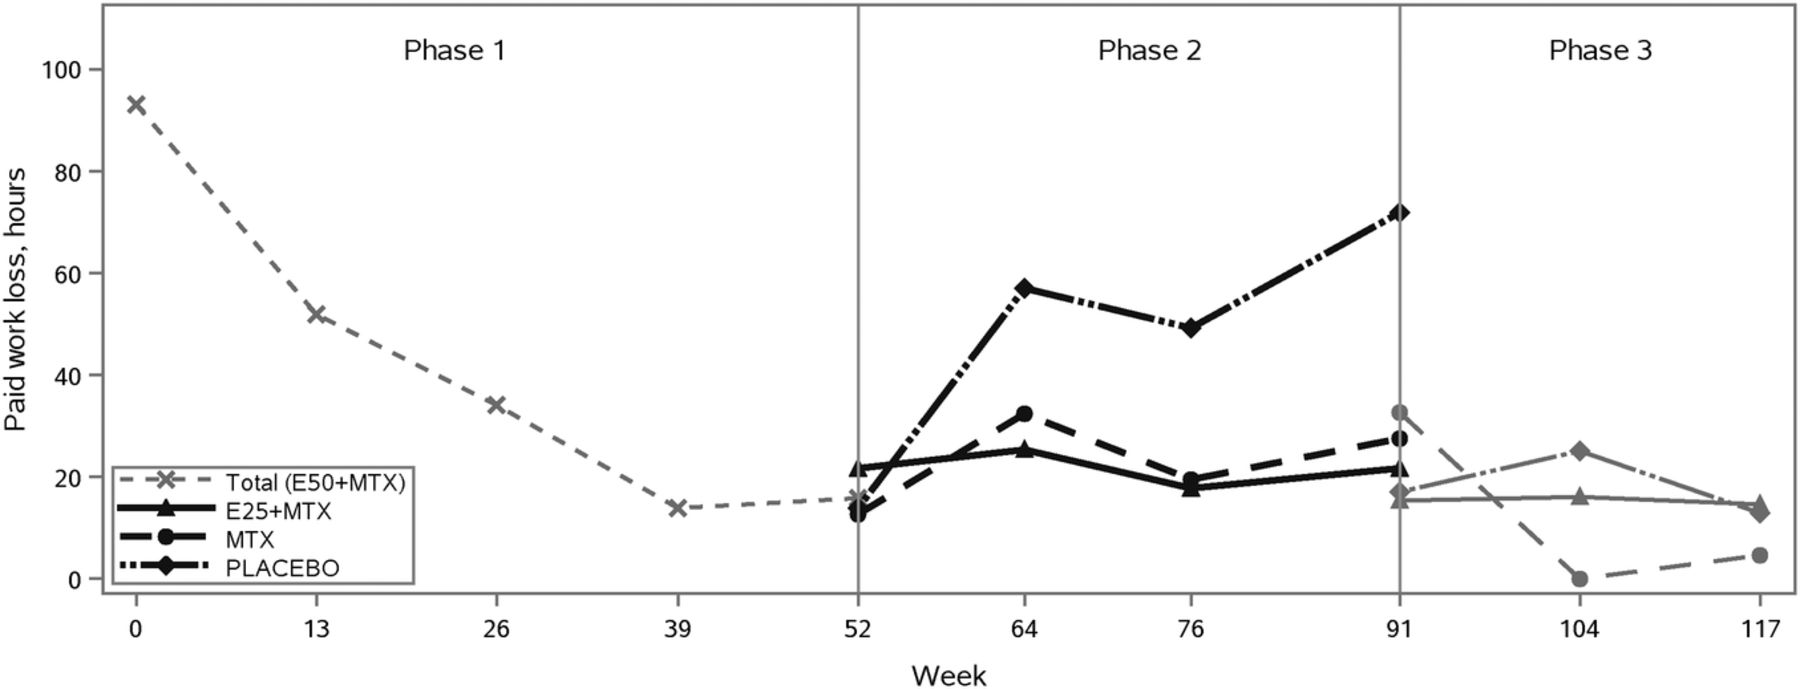
A total of 80 patients (75 employed patients at week 91 and 5 unemployed patients) completed phase II and entered phase III. A total of 55 patients who were employed at week 91 and had at least one follow-up with the VOLP were included in our final analysis for phase III. Among phase II study sample, 116 patients who were also employed at baseline and had at least one follow-up with VOLP were included in our analysis for phase I. Figure 2 plots the 3-month paid work productivity loss (hours) at each visit over the entire study period among these patients who still remained in the study.

Plots of 3-month paid productivity loss in hours at each visit during the entire study period. E50+MTX, etanercept 50 mg plus methotrexate; E25+MTX, etanercept 25 mg plus methotrexate; MTX, methotrexate.
During phase II, at week 52, the 3-month paid work productivity loss was 21.8 (SD: 43.9), 12.8 (44.3) and 14.0 (55.9) hours, respectively. The productivity loss increased at week 64 from week 52 and dropped at week 76 for all treatment groups. This could be attributed to patients who lost their clinical response status and received a booster at week 56, however did not respond (DAS>3.2) at week 64 and thus were withdrawn from the study. Nonetheless, the productivity loss continued rising after week 76 for the placebo group (71.9 (141.3) hours at week 91) but not for the other two groups (21.9 (54.9) hours for ETX25+MTX and 27.6 (79.7) hours for MTX).
In contrast, the 3-month paid work productivity loss dropped sharply from 93.1 (103.6) hours at baseline to 14.0 (65.0) hours at week 39 and then flattened at week 52 (15.8 (47.8) hours) during phase I. During phase III, among all patients who remained in the study, regardless of which treatment group they were in, paid work productivity loss was maintained the same as their loss at the end of phase II (week 91). The MTX group showed a larger reduction compared with the other treatment groups. However, due to the fact that a small sample of patients were still followed up for each group, and an even smaller number of patients suffered any productivity loss (ie, loss>0), we lacked the power to make any inference for phase III based on the results. Furthermore, the paid productivity loss at each time point shown in figure 2 would be lower if including those who were withdrawn from the study because of their high disease activity. However, the difference between the placebo group and other two groups in phase II would be larger because a higher proportion of patients in the placebo group were withdrawn because of high disease activity.10
Discussion
To the best of our knowledge, the PRIZE study is the first clinical trial to measure the impact of dose-reduction, step-down and treatment-free treatment strategies on all the labour input components that affect overall productivity and the corresponding monetary value among people with early RA.7 ,21 This study found that over the 39-week phase II study period, ETN25+MTX or MTX alone improved paid work productivity by over 100 hours compared with placebo, which amounts to a gain of €1752 or €1503, respectively, in paid work productivity. Overall, ETN25+MTX in comparison to placebo gains €1862 in total paid and unpaid productivity. However, these results are based on small numbers, and many of the intermediate productivity outcomes are not significant between groups.
The study was limited by its small sample size especially for phase III where only 20 patients in the ETN25+MTX group, 20 in the MTX group and 7 in the placebo group reported valid paid work productivity loss at week 91. Furthermore, the number of patients who had any loss (ie, loss>0) were even smaller, for example, six patients in the ETN25+MTX group, three in the MTX group and two in the placebo group. Therefore, we did not have power to make any statistical inference for phase III based on the small sample size. The sample size of the PRIZE trial was originally calculated based on the clinical outcomes.10 In order to examine whether the treatment groups, the ETN25+MTX group and the MTX group, were significantly more productive than the placebo group in phase III, the sample size required would be a total of 309 employed patients with DAS28≤3.2. The detailed calculation was presented in the online supplementary appendix. Nevertheless, the study provides important signals for the influence of treatment strategies on productivity. The paid work productivity gain in phase I as a result of ETN50+MTX was considerably lost in the placebo arm during phase II of the trial among the patients who still remained in the treatment and had valid response to the relevant questions. The gain was marginally lost in the dose-reduction treatment arms, ETN25+MTX and MTX. Patients who still remained in the study, regardless of the treatment groups, maintained their paid work productivity during phase III.
We used the LOCF method to address the missing issues when measuring cumulative productivity loss during phase II. Most of the missing values were because patients withdrawn from the study if their disease activity remained high or had unsatisfactory response. It is likely that these patients had lower work productivity and even had to stop working, that is, higher productivity loss. It has shown that the ETN25+MTX group had the highest remission rate and no unsatisfactory response and the placebo group had the lowest remission rate and 17 unsatisfactory responses during phase II.10 Using LOCF, we assumed that the productivity loss of those patients kept the same as before (it was likely to be higher). Therefore, our estimates of the difference in cumulative productivity loss between the ETN25+MTX group and the placebo group during phase II are relatively smaller, which makes our results conservative.
It is also worth noticing that patients in the placebo group had worse self-assessment of general health status and patient global assessment of disease activity at the starting time point of phase II (week 52). Worse health might be related to higher productivity loss. In our regression model, for each cumulative VOLP productivity outcome in phase II, we have adjusted for the corresponding VOLP outcome at week 52 because it is more directly related to the cumulative productivity loss than general health status and disease activity. Furthermore, as shown in table 2, the productivity loss in the placebo group was actually lower than the other two groups although not significantly. Therefore, the self-assessment of general health status and patient global assessment of disease activity at week 52 would not have much confounding effects.
In this study, we valued productivity loss by adjusting wage by multipliers to represent the productivity impact of the reduced labour input due to health problems. This is in contrast to an alternative valuation method known as the friction-cost (FC) method. In this, productivity losses are only taken into account within a ‘friction period’ when absent workdays are longer than the period.22 Another approach that has been considered in the literature is the impact of compensation mechanisms.23 ,24 In this, the consideration of compensation mechanisms could potentially reduce productivity loss estimates because productivity losses are not counted if the missed work is compensated for during normal working hours.8 In the literature, the choice of valuation method has been debated and no consensus has been achieved.9 ,25 ,26 If the FC method and the potential impact of compensation mechanisms are considered in our study, the estimated productivity losses would be smaller.
This study has implications for research, practice and healthcare systems. When measuring and valuing the effect of a treatment on productivity, this study demonstrates why it is important to consider all the labour input components that affect overall productivity. Further studies, especially with a larger sample size, are needed to confirm our study findings and investigate the treatment effect on productivity during the treatment-free period. In terms of practice, this study found that the productivity loss was similar in the ETN25+MTX group and the MTX group during phase II. This implies that clinicians can reduce or withdraw biological therapy in some patients after they achieve low disease activity (ie, responders) with early aggressive treatment without impairing their productivity outcomes. From a healthcare system perspective or a societal perspective, this implies that the costs for treatment might be reduced if those responders to early aggressive treatment were treated by MTX only afterwards. However, this would require clinicians to vigilantly monitor patient disease activity and functional and radiographic outcomes and to retreat patients when needed.10
In conclusion, the paid work productivity gain in phase I as a result of ETN50+MTX was marginally lost in the dose-reduction treatment groups, ETN25+MTX and MTX, but substantially lost in the placebo group during phase II. Our results suggest that reducing the dose of ETN or stepping down from ETN plus MTX to MTX alone sustained improvements in paid work productivity gained from the treatment-induction phase among the patients who still remain in the treatment (ie, responders). The use of ETN25+MTX in comparison to placebo resulted in gains of ∼€2000 in total paid and unpaid productivity.
Acknowledgments
Wei Zhang is a recipient of the Michael Smith Foundation for Health Research Postdoctoral Fellowship Award. Nick Bansback is a New Investigator of the Canadian Institutes of Health Research.
References
Footnotes
Contributors RP and SK were involved in the study design of the clinical trial and data collection. WZ, NB, AHA, RP and SK designed this study. HS and WZ analysed the data. All the authors critically interpreted the results. WZ prepared the first version of the manuscript. All the authors reviewed the draft versions and gave their approval of the final version of the manuscript.
Funding This study was sponsored by Pfizer Inc.
Competing interests AHA and NB are members of the Scientific Staff, and WZ is a trainee, of the Arthritis Research Centre (ARC), who received financial support from Pfizer in connection with the development of this manuscript. HS is a member of Centre for Health Evaluation and Outcome Sciences (CHEOS), and CHEOS was compensated by ARC in connection with the development of this manuscript. RP and SK are employees of Pfizer. Outside the submitted work, AHA has received research funding and/or honoraria from Pfizer Inc. and AbbVie Corporation, both of whom manufacture biologics. AHA has also received payment for lectures, which include service on speakers’ bureau, from International Value Coalition and AbbVie Corporation.
Ethics approval For the clinical trial, the institutional review board or ethics committee at each participating centre approved the study protocol. The clinical trial was conducted in accordance with the ethical principles of the Declaration of Helsinki and the Good Clinical Practice guidelines of the International Conference on Harmonisation. This study was approved by the Behavioural Research Ethics Board of the University of British Columbia (certificate number H13-00894).
Provenance and peer review Not commissioned; externally peer reviewed.
Data sharing statement No additional data are available.