Article Text

Abstract
Osteoarthritis is a common hip joint disease, involving loss of articular cartilage. The prevalence and prognosis of hip osteoarthritis have been difficult to determine, with various clinical and radiological methods used to derive epidemiological estimates exhibiting significant heterogeneity. MRI-based methods directly visualise hip joint cartilage, and offer potential to more reliably define presence and severity of osteoarthritis, but have been underused. We performed a systematic review of MRI-based estimates of hip articular cartilage in the general population and in patients with established osteoarthritis, using MEDLINE, EMBASE and SCOPUS current to June 2016, with search terms such as ‘hip’, ‘femoral head’, ‘cartilage’, ‘volume’, ‘thickness’, ‘MRI’, etc. Ultimately, 11 studies were found appropriate for inclusion, but they were heterogeneous in osteoarthritis assessment methodology and composition. Overall, the studies consistently demonstrate the reliability and potential clinical utility of MRI-based estimates. However, no longitudinal data or reference values for hip cartilage thickness or volume have been published, limiting the ability of MRI to define or risk-stratify hip osteoarthritis. MRI-based techniques are available to quantify articular cartilage signal, volume, thickness and defects, which could establish the sequence and rate of articular cartilage changes at the hip that yield symptomatic osteoarthritis. However, prevalence and rates of progression of hip osteoarthritis have not been established in any MRI studies in the general population. Future investigations could fill this important knowledge gap using robust MRI methods in population-based cross-sectional and longitudinal studies.
- Magnetic Resonance Imaging
- Osteoarthritis
- Arthritis
This is an Open Access article distributed in accordance with the Creative Commons Attribution Non Commercial (CC BY-NC 4.0) license, which permits others to distribute, remix, adapt, build upon this work non-commercially, and license their derivative works on different terms, provided the original work is properly cited and the use is non-commercial. See: http://creativecommons.org/licenses/by-nc/4.0/
Statistics from Altmetric.com
Key messages
We performed a systematic review of MRI-based estimates of hip articular cartilage in the general population and in patients with established osteoarthritis, using MEDLINE, EMBASE and SCOPUS current to June 2016; 11 studies were found appropriate for inclusion, but they were heterogeneous in osteoarthritis assessment methodology and composition.
Overall, the studies consistently demonstrate the reliability and potential clinical utility of MRI-based estimates. However, no longitudinal data or reference values for hip cartilage thickness or volume have been published, limiting the ability of MRI to define, risk-stratified hip osteoarthritis, or satisfactorily answer basic epidemiological questions about hip osteoarthritis.
Hip cartilage volume and thickness have been shown to differ by measurement technique, femoral head size, body mass index and sex; more work is necessary to determine the optimal techniques and quantification approaches (automated or otherwise) to establish basic reference values.
Longitudinal MRI-based studies that can establish the sequence and rate of articular cartilage changes at the hip that yield clinically and radiologically evident osteoarthritis are needed to aid in understanding normal variation and hip osteoarthritis pathogenesis.
Introduction
Osteoarthritis (OA), the most common disease of joints, generally involves slow progressive loss of articular cartilage. The associated musculoskeletal sequelae are a significant source for disability and reduced quality of life,1–3 which have been on the rise globally over the past several decades.1 Two of the most common and most disabling sites for OA are the hip and knee joints. Despite OA ranking as the most frequent pathological process at the hip joint,2 considerably fewer studies of OA are aimed at the pathophysiology of hip as compared with the knee. The risk factors for the development of hip OA are similar to those for knee OA, particularly repetitive physical stress, obesity, genetics and advancing age,3–9 although the relationship between increasing bodyweight or body mass index (BMI) and hip OA is complex and may be non-linear.10–15
In any study of prevalence, risk stratification or treatment of hip OA, it is crucial to settle on an accurate disease definition. Historically, this has been done using clinical or radiological criteria, but MRI has potential to improve this process since it allows direct visualisation of cartilage and other articular structures. Numerous robust, multicentre, prospective studies have been conducted to assess a wide variety of end points related to the development of OA at the knee,16–23 but we were surprised to find a relative lack of literature on the prevalence and progression of OA at the hip. We primarily focused on quantitative measures for cartilage volume and thickness which can be measured from routine MRI sequences. For reference, typical findings of superior joint space narrowing (JSN), subchondral cyst formation and marginal osteophytes in two patients with hip OA are demonstrated using standard T1 fat-suppressed and T2-weighted sequences in figure 1. We have also included brief discussions on promising advanced techniques such as T2 mapping and relaxometry, which require specialised MRI protocols. To the best of our knowledge, these advanced methods have not yet been applied to community screening.

Typical findings of osteoarthritis at the hip using routine T1-weighted and T2-weighted MRI. (A) Sixty-three years M, T1FS and T2-weighted sequences showing superior joint space narrowing, labral tearing (blue arrow) and an acetabular subchondral cyst (arrow head) adjacent to the labral tear. (B) Fifty-nine years M, T1FS and T2-weighted sequences showing small femoral osteophytes (red arrows), a femoral head–neck junction cyst (arrow head), superior labral tearing (blue arrow) and mild joint space narrowing. M, male; T1FS, T1 fat-suppressed.
With respect to MRI-based assessments of hip articular cartilage volume and thickness, we were interested to learn what measures are currently used, whether there are established normative values for these in the general population and, if so, whether hip OA can be defined in terms of variation from these normal values. Furthermore, we wondered whether the rate of change over time for these normative values had been investigated. We, therefore, conducted a systematic review of MRI-based estimates of hip articular cartilage variation and hip OA prevalence and progression in the general population.
Methods
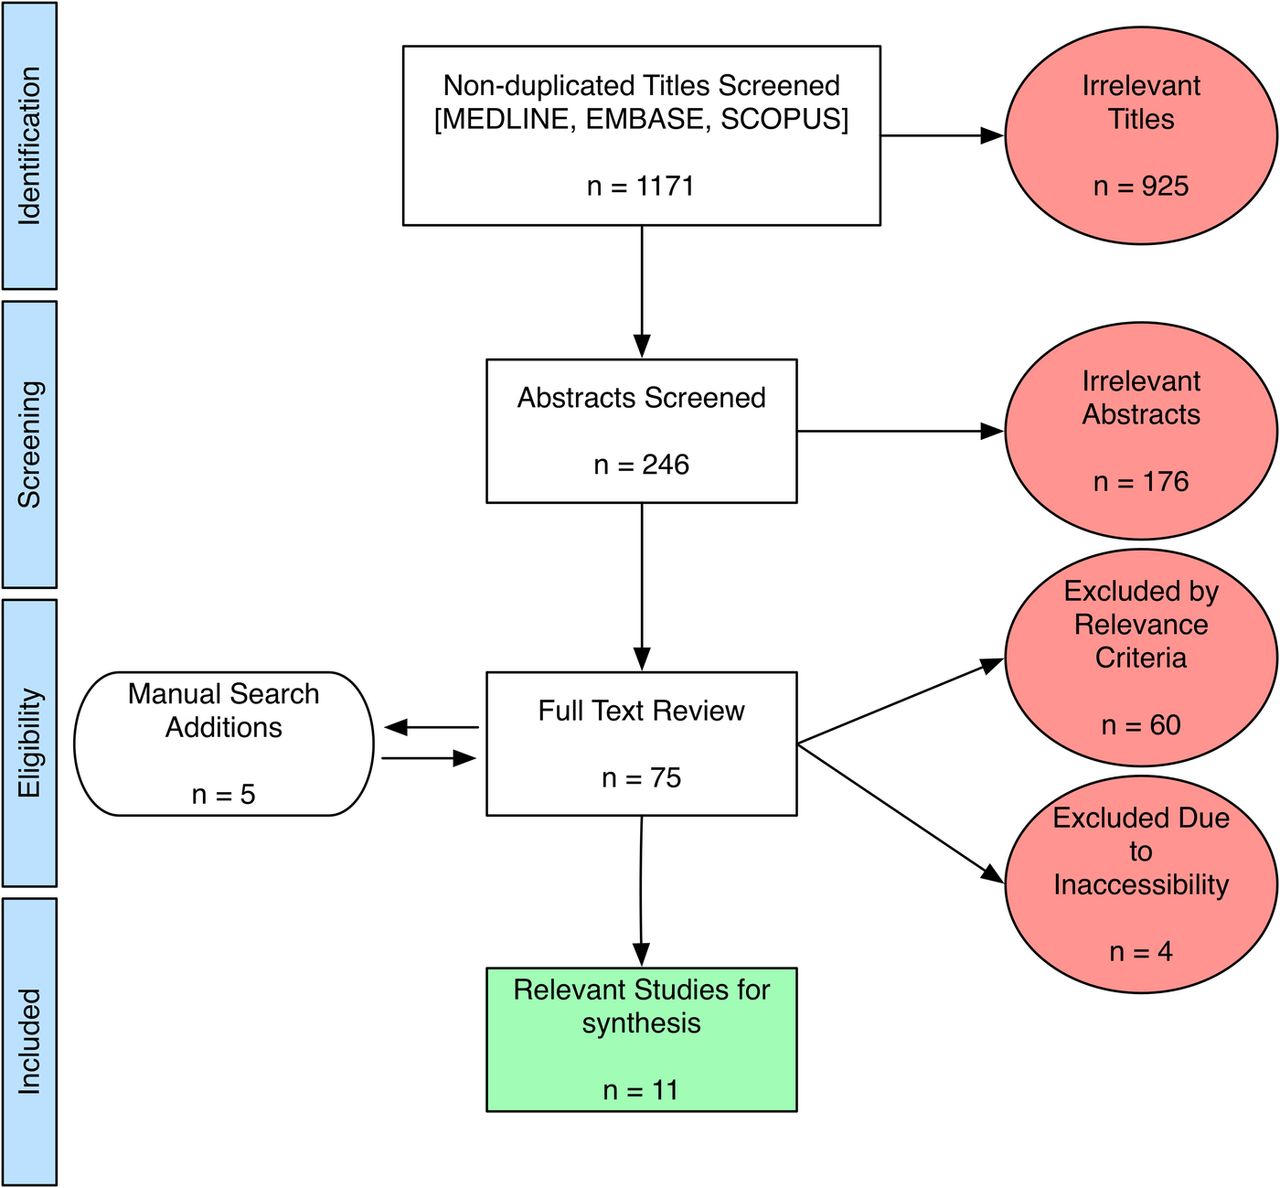
We searched MEDLINE (1946 to present), EMBASE (1974 to present) and SCOPUS (1960 to present) current to June 2016 using combinations of the search terms, such as ‘hip’, ‘hip joint’, ‘femur’, ‘femoral head’, ‘cartilage’, ‘hyaline cartilage’, ‘articular cartilage’, ‘volume’, ‘thickness’. The screening strategy and results are summarised in the flow diagram in figure 2 (as per the PRISMA 2009 guidelines).24 The full electronic search strategy used for combining MEDLINE and EMBASE searches is demonstrated in the online supplementary appendix. Results were limited to peer-reviewed studies published in English and relating to human participants. We limited studies to ‘primary’ hip OA, as opposed to hip OA resulting from other pathologies (femoroacetabular impingement, developmental hip dysplasia, etc) since primary OA may be a specific entity resulting largely from complex systemic and genetic factors.12 ,25–27
PRISMA 200924 flow diagram. Potentially relevant published studies were retrieved from database searches, and reduced to the final number (11) for synthesis, as shown.
supplementary appendix
The initial search produced 1171 non-duplicate titles, which were screened by two reviewers (HNA and JLJ). Common reasons for exclusion at this stage were emphasis on alternate pathologies (developmental dysplasia of the hip, femoroacetabular impingement, etc) and on joints other than hips. After eliminating clearly irrelevant titles, a total of 246 abstracts were further scrutinised, yielding 70 studies for full-text review. Manual searches of the bibliographies for relevant studies yielded an additional five results for full-text review (total 75). At this stage, studies were commonly excluded for an in vitro/cadaveric specimen approach, a primary focus on mathematical or technical aspects of MRI, or for emphasising physicochemical assessments of cartilage in vitro. A further four studies were excluded because the full text was inaccessible, despite efforts to contact the corresponding authors. Finally, 11 publications satisfied the inclusion criteria for this qualitative review. From these studies, we extracted demographic information, MRI sequences used, the primary study end points with respect to MRI measures, the OA defining criteria used to categorise patients and the available prevalence estimates.
Results and discussion
The 11 relevant works are summarised in table 1.
MRI-based assessments of hip cartilage or volume in symptomatic (OA) or asymptomatic populations
The studies were heterogeneous in terms of composition, and three of the studies were limited by samples of <10 participants.28 ,30 ,32 The studies having more than 100 participants10 ,11 ,29 ,34 ,35 were derived from the larger databases of the Tasmanian Older Adult Cohort Study (TASOACS) or the Melbourne Collaborative Cohort Study (MCCS). Ten studies included male and female participants, with one of the smaller studies limited to women only.30 Eight of 10 studies relied on routine MRI sequences for cartilage assessment, and 2 emphasised advanced compositional sequences aimed at imaging the cartilage proteoglycan/collagen network.32 ,39 An advanced discussion of these specialty techniques for assessing articular cartilage is beyond the scope of the current review, and thus reader is referred elsewhere for further details.43 ,44
Instead of providing quantitative hip cartilage measurements, two studies provided semiquantitative data regarding hip cartilage signal changes, description or quantification of hip cartilage defects, and/or quantification of other MR cartilage parameters such as relaxometry.35 ,39 OA defining criteria were not used in five studies.11 ,28 ,30 ,38 One study36 used an MRI-based scoring system for OA (Hip Osteoarthritis MRI Scoring System, HOAMS37), whereas the remaining studies used radiographic grading of hip OA as per the Kellgren-Lawrence (K-L) score or Altman atlas. Heterogeneous prevalence data regarding various MRI or radiographic findings at the hip joint were published in five studies.10 ,11 ,29 ,35 ,39 We were particularly interested in information and data available from the papers related to: (1) MRI-based hip cartilage measures used, (2) normative, quantitative hip cartilage values and associated factors, (3) presence and prevalence of OA based on hip cartilage measures, and (4) rate of change of hip articular cartilage or progression of hip OA as evidenced by changes in articular cartilage.
MRI-based hip articular cartilage measurement methods
Accurate and reliable measurement of thin curved cartilage plates at the hip is challenging. Two studies used a fully automated segmentation approach36 ,38 with the remainder using a combination of manual and semiautomated segmentation. Two groups using automated computer-aided segmentation36 ,38 were aimed at validating this technique and evaluating its performance when combined with different MRI sequences for optimal cartilage detection. Among the non-automated approaches, the most popular method involved application of a trilinear interpolation routine to retrieve isotropic voxels, and thereafter manual segmentation of the femoral head cartilage by manual disarticulation followed by reconstruction into a three-dimensional (3D) volume with summation of pertinent voxels.10 ,11 ,28 ,29 ,34 A fairly similar semiautomated method was facilitated by a different software algorithm30 and a third approach used techniques including edge detection and edge enhancement to identify voxels containing cartilage.32
Hip cartilage volume measurements on MRI have been directly validated ex vivo in 10 explanted femoral head specimens, where whole-joint cartilage volumes (WJCV) ranged from 1800 to 7800 mm3 by MRI and 1600 to 8100 mm3 by surgical dissection, with measurement error 600 mm3, similar to the observed SD of MRI measurements.28
Normative values for hip cartilage volume and thickness, and associated factors
Teichtahl et al studied the dominant hip on 3T MRI in 141 community participants recruited from the MCCS who had never been diagnosed with OA and had no symptoms of hip OA, and 19 separately recruited participants meeting American College of Rheumatology (ACR) criteria for hip OA, including K-L grade >1. This study confirmed that the OA participants had significantly reduced femoral head cartilage volumes (FHCV) compared with their non-OA counterparts, with mean values 1763±321 vs 3343±808 mm3, p<0.001.10 In addition, cartilage defects and bone marrow lesions were more prevalent in the OA participants after adjusting for age, gender and BMI. Further work by the same investigators on presumably the same cohort of 141 non-OA participants showed that FHCV was significantly and substantially higher in men than women (mean 3891±636 vs 2867±451 mm3, respectively). In women only, increasing BMI correlated negatively with FHCV and with increased cartilage defects. Interestingly, increased fat-free mass was beneficial in terms of FHCV for both genders.11 These relations were demonstrated after adjusting for age and femoral head bone area, but unfortunately the authors did not report the correlations between FHCV and age. Hip OA prevalence could not be estimated by this study design.
These results confirmed earlier cross-sectional study findings involving the TASOACS cohort, in which significantly larger WJCV was found in 79 men (5900±1000 mm3) vs 72 women (4700±800 mm3).29 This finding could be at least partially attributable to a significantly larger femoral head size in men (men: 18.6±2.0 cm2, women: 14.1±1.5 cm2). As in the Teichtahl et al10 ,11 studies, higher BMI correlated significantly to decreased hip cartilage volumes in this study (although increased radiographic JSN did not).29 Also, radiographic JSN, but not the presence of osteophytes, correlated with cartilage volume loss, such that each increase in radiographic K-L grade (ie, worsening JSN) resulted in a mean 13% reduction in FHCV, and a 9% reduction in femoral head cartilage thickness. Of the study participants, 46% of men and 56% of women had radiographic OA (K-L grade >1), with no equivalent prevalence estimates for MRI features provided.29
A 2008 feasibility study by Carballido-Gamio et al32 for T1ρ and T2 relaxometry measures for hip articular cartilage used 3T MRI in five healthy participants, one with ‘mild’ OA (K-L grade 1–2) and another with ‘severe’ OA (K-L grade 3–4). WJCV in the five non-OA participants was 5075–7370 mm3, with a mean value 6260 mm3 and a coefficient of variation (CoV) of 2.2%. WJCVs were not reported for the patients with OA.
A third cross-sectional study in the TASOACS cohort used 3D fat-suppressed T1 gradient-recalled echo sequences to quantify and correlate MRI-measured cartilage volumes at the hip and knee with each other and with radiographic JSN as per the Altman atlas. The FHCV was relatively high in this study, with a median estimate of 5227 mm3, and this correlated more strongly with total knee cartilage volume than with cartilage volume in a specific knee compartment or with radiographic JSN at either the hip or knee after adjusting for age, sex, height and weight.34 Unfortunately, variation of FHCV with factors such as age was not analysed in that report.
The above estimates largely derived from participants with clinical and radiological evidence for hip OA share a significant overlap with the estimates from Chandra et al36 and Ramme et al38 which were conducted on asymptomatic and otherwise healthy individuals. Both groups used a fully automated segmentation approach to provide estimates for WJCV of ∼4000–12 000 and 2300–9580 mm3, respectively, though the former estimates were not stated in the publication text, but rather can be gleaned from a figure contained there. The latter of these two reports acknowledge the use of MR data for which the image thickness exceeded the ideal (<1 mm) for optimal software performance, which may account for some of the discrepancy between the two studies. Still, there remains a significant overlap in WJCV estimates across OA and non-OA individuals, and it is not clear whether such differences are the result of varying approaches to obtaining cartilage measurements, or to what extent morphometric parameters, such as femoral head size, might account for this.
Some have taken the approach of estimating the mean whole-joint cartilage thickness (WJCT) rather than volume. Carballido-Gamio et al32 determined average cartilage thickness of 2.8–3.3 mm (mean 3.1 mm) in five normal participants, with CoV 2.2%, and 2.8 mm in a patient with mild OA and 3.4 mm in another with severe OA. Another study used semiautomated segmentation in six healthy women (ages 22–34 years), to visualise WJCT as it varies across the hip.30 The overall mean WJCT was 2.3±0.13 mm thinner than in the Carballido-Gamio et al's32 study and differed from an in vitro measurement in a previous report.45 It remains unclear whether this difference is due to technical issues or differences between the samples.
By applying traction to separate the acetabular and femoral head cartilages, others have successfully used automatic segmentation methods to estimate acetabular cartilage thickness at 0.76–3.21 mm (mean 1.60±0.50) in a small sample (n=4), with good agreement to direct ex vivo and semiquantitative measurements.46
Intuitively, it would seem that cartilage thickness across individuals might be less affected than cartilage volume with respect to variation in patient height and weight, which presumably could reflect variations in femoral head and acetabular sizes; however, no data are available, to the best of our knowledge, to clarify this.
In summary, hip cartilage has been quantified by several groups using a variety of methods primarily focused on FHCV and WJCV. The reported cartilage volumes vary substantially by method used, sex, BMI, age and OA disease status. Furthermore, it may be important to adjust for joint size for meaningful measurements. Cartilage thickness was measured by fewer authors and varied substantially.
Hip OA disease definition, prevalence and rate of progression
Owing to cross-sectional study designs, varied participant populations and limited sample sizes, the studies available do not provide sufficient information to enable clear definitions for OA in terms of cartilage volume or thickness. Furthermore, there is a dearth of longitudinal data, from which to estimate hip OA incidence and rate of progression. Unfortunately, even the two Teichtahl et al10 ,11 studies of the MCCS with 10–15 years of follow-up only used MRI at the final time point, thus no longitudinal data were available.
The only longitudinal study among those fitting our search criteria examined T1ρ and T2 relaxation as potential imaging biomarkers for detection of hip OA progression.39 The Scoring Hip Osteoarthritis with MRI (SHOMRI)40 scoring system was used to evaluate the presence of hip cartilage lesions in multiple anatomic subregions using fast spin echo (FSE) images. Baseline cartilage scores for 54 participants were compared with cartilage scores at 18 months. Stratification into disease progression or non-progression was based on increasing SHOMRI scores at follow-up. At baseline, 3D segmented spoiled gradient-recalled acquisition sequences were acquired for T1ρ and T2 relaxation parameters to evaluate their prognostic value for disease progression. At baseline, 16 of 54 participants (29.6%) had mild or moderate hip OA (K-L—2, 3), and at 18-month follow-up, 9 of 54 participants (16.7%) demonstrated progression. The only statistically significant association was for greater BMI with acetabular cartilage lesion progression. The mean baseline SHOMRI scores for femoral cartilage were 2.9 for femoral lesion progressors and 1.3 for non-progressors. The average SHOMRI acetabular cartilage scores were 1.6 and 0.9 for progressors and non-progressors, respectively. Baseline T1ρ and T2 relaxation times were significantly different between progressors and non-progressors in the femoral, but not acetabular, cartilage, even after adjusting for patient demographic factors and the K-L score. The results suggest that T1ρ and T2 relaxation times could be helpful in terms of deriving a disease definition. However, as acknowledged by the authors, it remains difficult to assess whether the observed MRI-based progression rate observed (16.7%) is in agreement with radiographic rates of progression, especially given the relatively young and healthy study population and short follow-up interval.
One of the previously mentioned cross-sectional studies of 243 participants from the TASOACS database35 did provide modest prevalence data. Hip OA severity was graded as per the Altman atlas, patient pain graded as per the Western Ontario and McMaster Universities Osteoarthritis index (WOMAC) score and MRI hip cartilage defects were assessed by semiquantitative grading. At least one defect (femoral or acetabular) was found in 189 (77%) of the participants. The presence of these lesions did not correlate with advancing age, sex or increasing BMI, but was associated with other imaging findings, including more severe radiographic features of OA, as well as hip pain in men, but not in women.
Overall, we could find no studies assessing the expected rate of change in hip cartilage thickness or volume over time. At the knee, studies have found rates of cartilage thickness loss ranging from 0.4% to 1.9% per year depending on the study cohort.47–50
Conclusion
OA is a very complex whole-joint disease, involving many features. Here, we have focused on the available MRI methods of assessing one such feature—cartilage loss, and acknowledge this narrow focus as a limitation of the current work. This systematic review demonstrated that while reliable techniques for measuring hip cartilage volume, thickness and defects are now available on MRI, these approaches have not yet been used to satisfactorily answer basic epidemiological questions about hip OA. Some early promising work using T1ρ and T2 relaxometry demonstrated the potential for prognostication based on these cartilage mapping parameters. It remains unclear, however, how these MRI biomarkers relate to the basic measures of cartilage thickness or volume, or the rate of change thereof. Considering that hip cartilage volume and thickness have been shown to differ by measurement technique, femoral head size, BMI and sex, more work is necessary to determine the optimal techniques and quantification approaches (automated or otherwise) to establish basic reference values. The exact MRI sequences to be assessed for this purpose remain debatable. However, guidelines for an approach to assessment of the hip joint using MRI for clinical trials are now available for reference.51 It would seem that multiaxial, high field strength (3T), high resolution (≤1.5 mm thick slices), fat-suppression techniques could be best suited for this purpose.
Further cross-sectional studies will also help in this endeavour, but longitudinal MRI-based studies that can establish the sequence and rate of articular cartilage changes at the hip that yield clinically and radiologically evident OA are also needed. We performed a systematic search of three large databases (MEDLINE, SCOPUS, EMBASE) and found no longitudinal studies assessing changes to hip cartilage volume or thickness on MRI in any cohort. We acknowledge that some relevant search results may have escaped our search strategy; however, on balance, there is a clear need to perform such longitudinal studies, which will be crucial to understanding normal variation and hip OA pathogenesis.
Acknowledgments
The authors thank Linda Slater, Public Services Manager at the John W Scott Health Sciences Library at the University of Alberta, for her help in constructing and executing the database searches.
References
Footnotes
Contributors HNA, JLJ and MCB were involved in conception and design, analysis and interpretation of the data, critical revision of the article, and final approval of the article. HNA was involved in collection and assembly of data, and drafting of the article.
Competing interests None declared.
Provenance and peer review Not commissioned; externally peer reviewed.
Data sharing statement No additional data are available.