Article Text

Abstract
Objective To assess the utility of erythrocyte methotrexate-polyglutamate (MTX-PG) concentrations in determining the safety and efficacy of MTX in patients with rheumatoid arthritis (RA).
Methods 79 MTX-naïve patients with RA were enrolled in this prospective 76-week cohort study. MTX was initiated, and a predefined dose-escalation protocol was followed. Erythrocyte MTX-PG concentrations were measured using liquid chromatography. The associations of MTX-PG concentrations with disease activity and adverse events were analysed.
Results Dose escalation of MTX resulted in increased MTX-PG concentrations and a decrease in the mean Disease Activity Score in 28 joints (DAS28). A significant association was observed between total MTX-PG concentrations and ΔDAS28 at week 12 (β=−0.013, p=0.003) and at week 24 (β=−0.014, p=0.003). The maximum MTX-PG levels were significantly higher in patients presenting with elevated transaminases (≥100 IU/L) than in those without (146 vs 106 nmol/L, p=0.009). Receiver operating characteristic curve analysis revealed that a total MTX-PG concentrations of 83 nmol/L at week 12 was the threshold for a DAS28 improvement of ≥1.2 at week 24, and 105 nmol/L was the threshold for transaminases of ≥50 IU/L and 131 nmol/L for transaminases of ≥100 IU/L. MTX-PG concentrations were strongly influenced by body mass index and a serum albumin level.
Conclusions MTX-PG concentrations are a useful biomarker in MTX therapy, in terms of efficacy and safety.
- Rheumatoid Arthritis
- Methotrexate
- Treatment
This is an Open Access article distributed in accordance with the Creative Commons Attribution Non Commercial (CC BY-NC 4.0) license, which permits others to distribute, remix, adapt, build upon this work non-commercially, and license their derivative works on different terms, provided the original work is properly cited and the use is non-commercial. See: http://creativecommons.org/licenses/by-nc/4.0/
Statistics from Altmetric.com
Key messages
What is already known about this subject?
Risk factors underlying the interpatient variability in the response to methotrexate (MTX) in patients with rheumatoid arthritis have been unclear.
While plasma MTX concentrations fall below pharmacologically effective levels rapidly, MTX-polyglutamates (MTX-PGs) retained within the cells for a period of time might be a potential biomarker associated with response to MTX.
What does this study add?
This long-term multicentre prospective study assessed the relationship between the dynamics of intraerythrocyte MTX-PG concentrations and the efficacy and adverse effects of MTX in patients with rheumatoid arthritis.
How might this impact on clinical practice?
Monitoring MTX-PGs could optimise treatment response while minimising liver injury in the treatment with MTX.
The body mass index and the serum albumin level affected MTX-PG concentrations.
Introduction
Methotrexate (MTX) is the mainstay of disease-modifying anti-rheumatic drug (DMARD) therapy. It is widely used to treat rheumatoid arthritis (RA) because of its marked efficacy and acceptable side effect profile.1 However, a number of patients have a poor response despite dose escalation, or experience adverse events resulting in dose restriction or treatment cessation. At present, the mechanisms and risk factors underlying the interpatient variability in the response to MTX have not been established. However, the amount of MTX or MTX metabolites in the body could be a major determinant of its effect.
MTX is transported into cells via a reduced folate carrier, where it is converted by folylpolyglutamate synthase into glutamate-chained MTX. It is retained within the cells for a period of time after its elimination from the plasma. Depending on the number of conjugated glutamates, MTX-polyglutamates (MTX-PGs) can be present as MTX-PG1 through 5. MTX-PGs inside the cells increase the inhibition of de novo purine synthesis and promote the accumulation of adenosine, thereby exerting immunosuppressive and anti-inflammatory effects.2–4
Plasma MTX concentrations fall below pharmacologically effective levels rapidly.5 Therefore, they are unreliable for predicting the efficacy or toxicity of MTX in patients with RA.6–12 In contrast, MTX-PG concentrations in erythrocytes have been identified as a potentially promising biomarker associated with response to MTX in patients with RA and juvenile idiopathic arthritis.12–17 However, the majority of these studies employed a cross-sectional design, and reported conflicting results on the efficacy and limited findings on the safety of MTX in relation to MTX-PG concentrations.
The aim of this long-term multicentre prospective study was to clarify the association between the dynamics of intraerythrocyte MTX-PG concentrations and the efficacy and adverse effects of MTX in patients with RA.
Methods
Study protocol and patients
The MAGIK (methotrexate as an anchor drug in Japanese rheumatoid arthritis monitored by erythrocyte PG concentrations at the Keio Rheumatology Expert Meeting) study, which was a 76-week long multicentre prospective study, started in December 2012. The medical ethics committee at each study site approved the protocol prior to study initiation, and all patients gave written informed consent before enrolment. This study was registered with the University Hospital Medical Information Network (UMIN000008514).
We enrolled patients in whom RA had been diagnosed according to the 2010 American College of Rheumatology (ACR)/European League Against Rheumatism (EULAR) classification criteria.18 These patients also had to have active disease (Disease Activity Score in 28 joints (DAS28)>3.2), be naïve to MTX or biological agent therapy, and be scheduled to start MTX treatment for their RA. Patients who were contraindicated to MTX, had a desire to bear a child, or had serious complications were excluded.
The study protocol specified the dose-escalation procedure for MTX, as well as the time points for performing clinical assessments including disease activity and adverse events and measuring MTX-PG concentrations. MTX was started at a dose of 8 mg/week with 5 mg/week folic acid, and was increased by 4 mg every 4 weeks until 16 mg/week, the maximum dose allowed in Japan, had been reached. Adding other DMARDs during the study was not allowed. This protocol was followed unless the patient achieved remission or experienced relevant adverse events. The dose could be decreased if adverse events occurred. The patients' clinical and biochemical parameters were assessed at baseline and at weeks 4, 8, 12, 24, 36, 52 and 76 of the study.
Clinical parameters
Data on patient demographics and clinical characteristics were obtained. This included age, sex, duration of arthritic symptoms, smoking status, body mass index (BMI), DAS28, Health Assessment Questionnaire Disability Index score (HAQ-DI), rheumatoid factor, anti-cyclic citrullinated peptide antibody, estimated glomerular filtration rate (eGFR) calculated with the Cockroft-Gault formula, aspartate transaminase (AST) levels, alanine transaminase (ALT) levels and blood cell counts. Hepatotoxicity was defined as AST or ALT >50 IU/L, and leucopenia was defined as white cell count <3000/μL. Outcome measures for effectiveness of MTX were ΔDAS28, EULAR good response,19 DAS28 remission20 and ΔHAQ-DI.
MTX-PG concentrations
To measure the MTX-PG concentrations, blood samples were collected in EDTA tubes at prespecified clinical assessment visits. The EDTA tube was centrifuged for 5 min at 3000 rpm at 4°C. The cell pellet was collected and centrifuged again after the addition of isotonic saline. The resulting packed red blood cells were stored at −80°C. These samples were air-shipped under dry ice to Exagen Diagnostics (Vista, California, USA), and the MTX-PGs (MTX-PG1, MTX-PG2, MTX-PG3, MTX-PG4 and MTX-PG5) were measured using a liquid chromatography-electrospray ionisation tandem mass spectrometry-based assay as previously described.21 The total MTX-PGs, or the sum of MTX-PG1 through MTX-PG5, was used in the analysis.
Statistical analysis
The comparison of proportions and correlations between groups was tested with Student's t-test, χ2 test, Mann-Whitney U-test, Spearman's correlation coefficient, and one-way analysis of variance, in accordance with the type of variable. Cross-sectional analyses of the association of MTX-PGs with the ΔDAS28 were performed with a linear mixed model with correction by potential confounders including age, non-steroidal anti-inflammatory drug (NSAID) use, the use of other DMARDs, glucocorticoid use, smoking status and eGFR. Cut-off MTX-PG concentrations with optimal sensitivity and specificity for predicting the decrease in DAS28 of more than 1.2, or the increase in transaminases of ≥50 or 100 IU/L, was determined using receiver operating characteristic (ROC) curves. A two-sided statistical test of no difference at the 5% significance level was used. All statistical analyses were performed using SPSS V.23.0 (SPSS, Chicago, Illinois, USA).
Results
Patient characteristics
A total of 79 patients were included in the study. Table 1 shows the baseline characteristics of the patients enrolled. The mean age was 56.7 years, and the majority of patients were female (86%). The mean BMI was 21.9 kg/m2, which was around the average for Japanese individuals. The mean DAS28 was 4.0 at baseline.
Demographic and clinical characteristics
Pharmacokinetics of MTX-PG in erythrocytes and disease activity
Figure 1A shows the pharmacokinetics of the total MTX-PGs and fractions of MTX-PGs in erythrocytes with the mean dose of MTX from baseline through 76 weeks. MTX-PGs were measured in 79 patients at week 4, 78 patients at week 8, 76 patients at week 12, 51 patients at week 24, 43 patients at week 36, 37 patients at week 52, and 35 patients at week 76. The attrition was due to various patient-related factors, including 2 moving house, 3 missing a blood test, 9 being lost to follow-up, 5 to adverse events, 23 to use of biological agents, or 2 withdrawing consent. Total MTX-PG values increased steadily with MTX dose-escalation and plateaued after 12 weeks at ∼90 nmol/L on 10.5 mg/week of MTX. The main fractions of MTX-PGs were MTX-PG1 and MTX-PG2, followed by MTX-PG3. MTX-PG4 and MTX-PG5 were nearly undetectable throughout the 76 weeks.
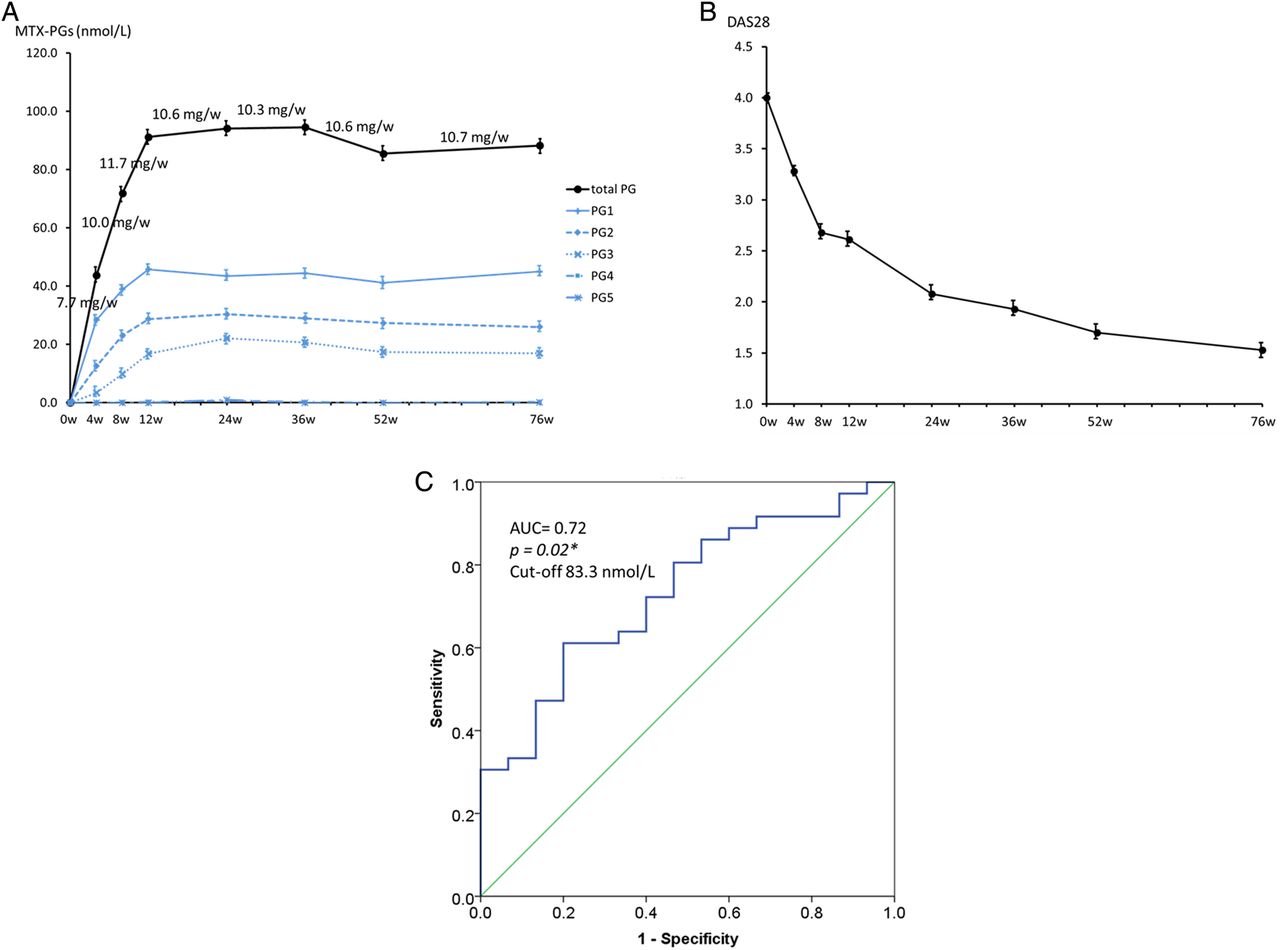
MTX-PG concentrations and efficacy. (A) Pharmacokinetics of MTX-PG concentrations with the mean MTX dose; (B) DAS28 and (C) cut-off values at week 12 for ΔDAS28>1.2 at week 24. *p<0.05. AUC, area under the curve; DAS28, Disease Activity Score for 28 joints; MTX-PG, methotrexate polyglutamate.
Figure 1B demonstrates the mean DAS28 which decreased from 4.0 at baseline to 3.3 at week 4, 2.7 at week 8, 2.6 at week 12, 2.0 at week 24, 1.9 at week 36, 1.7 at week 52, and to 1.5 at week 76 (p<0.05 at all time points compared with the baseline).
Association of MTX-PG concentration with clinical effectiveness
Table 2 shows the results of cross-sectional analyses with a linear mixed modelling for association between MTX-PG levels with ΔDAS28 at the corresponding visit. A significant association with ΔDAS28 was observed for MTX-PG3 (β=−0.035; SE=0.017; p=0.04) at week 8; MTX-PG1 (β=−0.025; SE=0.007; p=0.000), MTX-PG2 (β=−0.035; SE=0.011; p=0.002) and total MTX-PG (β=−0.013; SE=0.004; p=0.003) at week 12; MTX-PG1 (β=−0.026; SE=0.009; p=0.005), MTX-PG2 (β=−0.027; SE=0.012; p=0.03), MTX-PG3 (β=−0.028; SE=0.014; p=0.04) and total MTX-PG (β=−0.014; SE=0.004; p=0.003) at week 24; and for MTX-PG3 (β=−0.03; SE=0.015; p=0.04) at week 36. Furthermore, MTX-PG levels at week 12, the time when the concentrations reached a plateau, were associated with ΔDAS28 at weeks 24 and 36; MTX-PG1 (β=−0.025; SE=0.010; p=0.01), MTX-PG2 (β=−0.067; SE=0.013; p=0.000), MTX-PG3 (β=−0.039; SE=0.018; p=0.04) and total MTX-PG (β=−0.018; SE=0.004; p=0.001) at week 24; MTX-PG1 (β=−0.031; SE=0.008; p=0.001), MTX-PG2 (β=−0.051; SE=0.016; p=0.002) and total MTX-PG (β=−0.016; SE=0.005; p=0.001) at week 36.
Cross-sectional analysis of MTX-PG concentrations and ΔDAS28 with a linear mixed model
The associations of MTX-PG concentrations with other outcome measures including EULAR good response, DAS28 remission and ΔHAQ-DI are tabulated in tables 3 and 4. At weeks 12 and 24, MTX-PG concentrations were significantly higher in the patients who achieved EULAR good response or DAS28 remission than in those who did not. ΔHAQ-DI were associated with MTX-PG concentrations at weeks 24 and 36 by a linear mixed modelling.
Associations of MTX-PG concentrations with EULAR good response, DAS28 remission and ΔHAQ-DI
Correlations of baseline factors with total MTX-PGs at weeks 12 and 24
ROC analysis was used to determine the cut-off concentrations of total MTX-PGs at week 12 needed to produce an improvement of >1.2 in DAS28 at week 24 (figure 1C). A total MTX-PG concentration of ≥83.3 nmol/L could discriminate between patients with a DAS28 improvement of ≥1.2 and those without; the area under the curve (AUC) for this was 0.72 (95% CI 0.57 to 0.87, p=0.02).
Adverse events
Over a period of 76 weeks, 27 patients (34.2%) reported 46 instances of adverse events. Twenty patients (25.3%) presented with gastrointestinal symptoms, including nausea and stomatitis; 20 (25.3%) with hepatotoxicity (defined as AST or ALT ≥50 IU/L, the same patients with ALT≥50 IU/L in consequence); 2 (2.5%) with leucopenia; 1 (1.3%) with hair loss; 1 (1.3%) with Pneumocystis jirovecii pneumonia; 1 (1.3%) with cryptococcal pneumonia; and 1 (1.3%) with malignancy (gastric cancer). The last three events were deemed to be serious adverse events.
Among the 20 patients who developed hepatotoxicity, 12 had transaminase levels exceeding 100. The maximum total MTX-PG levels were 105.6 nmol/L in patients without hepatotoxicity, 119.5 nmol/L in those with 50≤AST/ALT<100, and 146.3 nmol/L in those with AST/ALT ≥100 (p=0.009, figure 2A). ROC analysis determined the cut-off value of MTX-PG concentrations for AST/ALT elevation ≥50 IU/L to be 105.4 nmol/L with an AUC of 0.67 (95% CI 0.52 to 0.81, p=0.03, figure 2B), and that for AST/ALT ≥100 IU/L to be 131.0 nmol/L (95% CI 0.50 to 0.93, p=0.04, figure 2C). Of note, NSAIDs use and other DMARDs use were not different between the patients with AST/ALT ≥50 IU/L and those without (20% vs 39%, p=0.09 for NSAIDs use; 10% vs 9%, p=0.85 for other DMARDs use).
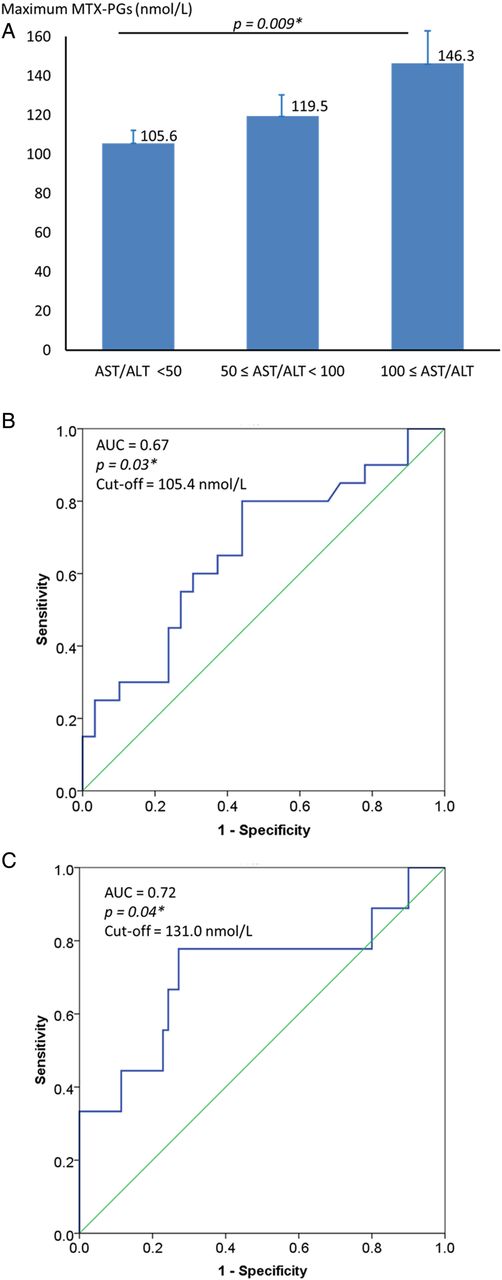
MTX-PG concentrations and hepatotoxicity. (A) Maximum MTX-PG concentrations among groups with or without hepatotoxicity; (B) cut-off values of total MTX-PG concentration for AST/ALT ≥50 and (C) cut-off values of total MTX-PG concentration for AST/ALT ≥100. *p<0.05. ALT, alanine transaminase; AST, aspartate transaminase; AUC, area under the curve; DAS28, Disease Activity Score for 28 joints; MTX-PG, methotrexate polyglutamate.
Factors affecting MTX-PG concentrations
To identify the individual patient factors affecting MTX-PG concentrations at weeks 12 and 24, correlation analyses of total MTX-PG concentrations with baseline patient characteristics including age, body weight, BMI, white cell count, red cell count, albumin level and eGFR were performed. The baseline BMI strongly affected total MTX-PGs at week 12 (ρ=−0.318, p=0.006) and week 24 (ρ=−0.422, p=0.002). Similar trends were observed for body weight (ρ=−0.305, p=0.03) and serum albumin (ρ=−0.422, p=0.002) at week 24.
In order to verify the influence of BMI on the concentrations of MTX-PG, we divided 75 patients (no BMI data available in four patients) into three groups according to the BMI categories defined by the WHO: 12 underweight patients (BMI<18.5 kg/m2), 52 normal weight patients (18.5≤BMI<25.0 kg/m2) and 11 overweight patients (BMI≥25.0 kg/m2). The total MTX-PG concentrations differed significantly among the three BMI groups (figure 3A). At week 24, the concentrations were found to be 151.6 nmol/L in the underweight group at 10.7 mg/week of MTX, 92.1 nmol/L in the normal group at 10.9 mg/week, and 65.6 nmol/L in the overweight group at 9.1 mg/week (p=0.001), while the ΔDAS28 at week 24 was comparable between the groups (−2.0 in the underweight group vs −1.7 in the normal group vs −1.8 in the overweight group, p=0.77, figure 3B). Elevated transaminase levels (AST/ALT ≥100 IU/L) were observed in 33.3% of the underweight group, 15.4% of the normal weight group and none of the overweight group (p=0.07, figure 3C).

MTX-PG concentrations and BMI. (A) MTX-PG concentrations in the three groups divided according to the BMI category; (B) decrease in DAS28 in the three groups and (C) the frequency of AST/ALT ≥100. *p<0.05. ALT, alanine transaminase; AST, aspartate transaminase; BMI, body mass index; DAS28, Disease Activity Score for 28 joints; MTX-PG, methotrexate polyglutamate.
Discussion
This prospective longitudinal cohort study revealed the utility of MTX-PG concentrations in assessing the efficacy and toxicity of MTX in patients with RA. We concluded that total MTX-PG concentrations between 83 and 105 nmol/L could be optimal for maximising the efficacy of MTX while minimising its toxicity in patients with RA. In addition, we have also identified the significant effect BMI has on MTX-PG concentrations.
Associations between MTX-PG concentrations in erythrocytes and disease activity in patients with RA have been investigated in several studies.12–18 ,21–24 Most of these studies have shown that higher MTX-PG levels were associated with lower disease activity, or that MTX-PG levels were significantly higher in patients responsive to MTX. Three longitudinal studies showed that an increase in MTX-PG concentrations was associated with a decrease in DAS28 scores.16 ,21 ,22 The results of our longitudinal study in MTX-naïve Japanese patients with RA are consistent with those of previous studies, and we have added to the body of knowledge by showing that 83 nmol/L could be the threshold for a DAS28 improvement of ≥1.2 by MTX. Although the relatively low mean DAS28 of 4.0 at baseline might be interpreted cautiously, we believe our results have provided new insights into the usage of MTX.
Little is known about the relationship of MTX-PGs and the safety of MTX. There have been a few reports indicating a relationship between adverse events and high MTX-PG3 to five levels in patients with juvenile idiopathic arthritis or inflammatory bowel disease.25 ,26 However, none of the MTX-PGs fractions have been linked to adverse events in patients with RA.21 Our findings have demonstrated the clear correlation between the MTX-PG levels and hepatotoxicity by showing that higher MTX-PG concentrations could result in higher transaminase levels. Although the maximum dose of MTX approved in Japan is 16 mg/week, the mean MTX dose used in actuality remains ∼12 mg/week owing to the predisposition of Japanese patients to adverse events.27 The frequent hepatotoxicity observed in our study clarified the relationship between MTX-PG concentrations and liver injury. Liquid chromatography-electrospray ionisation tandem mass spectrometry used to measure MTX-PG levels may be disadvantageous in the cost and the practicality at the moment; nevertheless, monitoring MTX-PG concentrations can be helpful in clinical practice.
Interestingly, despite the dosages of MTX used being largely similar, the MTX-PG concentrations in our patients were markedly higher than those observed in other studies from Europe or the USA. Our samples were evaluated by Exagen using the exact same method reported by Dervieux et al,21 who found that the total MTX-PGs at week 20 were around 65 nmol/L in patients with RA in the USA at 13.4 mg/week of MTX. In contrast, our cohort, which comprised Japanese patients with RA, demonstrated MTX-PG concentrations of 94 nmol/L at 10.3 mg/week of MTX at week 24. The difference in MTX-PG concentrations could potentially be ascribed to the differences in physical frames. We found that BMI strongly affected MTX-PG concentrations, and that total MTX-PG concentrations were much higher in underweight patients despite the similar MTX dose. MTX-related pharmacogenomics may be another possibility. Several studies have indicated that MTX-PG concentrations may be influenced by polymorphisms in the genes encoding the enzymes and transporters involved in the import and export of MTX/MTX-PGs, and ethnic variations have been reported to influence the frequencies of these polymorphisms.28–30 Further studies are needed to investigate these polymorphisms in Japanese patients.
In conclusion, this study suggests that maintaining the MTX-PG concentrations in erythrocytes at ∼80–100 nmol/L could optimise treatment response while minimising liver injury in the treatment of RA with MTX. As such, monitoring MTX-PG concentrations can be helpful in clinical practice.
Acknowledgments
The authors would like to thank Ms Harumi Kondo and Ms Mayumi Ota for their assistance in the acquisition of clinical information.
References
Footnotes
Contributors CT, YK and TT designed the study and analysed and interpreted the data. CT, YK, YO, HT, HO, KI and KY were involved in collecting data and managing the clinical research sites. All authors were involved in the writing of the manuscript and have approved the final version.
Competing interests YK has received lecture fees from Abbvie, Eisai Pharmaceutical, Chugai Pharmaceutical, Bristol Myers Squibb, Astellas Pharmaceutical, Mitsubishi Tanabe Pharma Corporation, Pfizer, Janssen and UCB. HO has received lecture fees from Astellas Pharma, Asahi Kasei, Takeda Pharmaceutical, Bristol Myers Squibb, MSD LLC, Chugai Pharmaceutical, Mitsubishi Tanabe Pharma Corporation and DS Pharma Biomedical Co. KY has received consulting fees and speaking fees from Pfizer, Chugai Pharma, Mitsubishi-Tanabe Pharma, Takeda Industrial Pharma, GlaxoSmithkline, Nippon Shinyaku, Eli Lilly, Janssen Pharma, Eisai Pharma, Astellas Pharma and Acterlion Pharmaceuticals. TT has received research grants and lecture fees from Abbvie, Astra Zeneca, Bristol Myers Squibb, Chugai Pharmaceutical, Eisai Pharmaceutical, Janssen Pharmaceutical, Mitsubishi Tanabe Pharma Corporation, Novartis, Takeda Pharmaceutical, Abbott Japan Co., Astellas Pharma, Daiichi Sankyo, Pfizer, Sanofi–Aventis, Santen Pharmaceutical, Teijin Pharma, Asahikasei Pharma Corp., SymBio Pharmaceuticals, Celtrion, Nipponkayaku Co., Eli Lilly Japan K.K. and Taisho Toyama Pharmaceutical.
Patient consent Obtained.
Ethics approval Keio University School of Medicine, Ethics committee.
Provenance and peer review Not commissioned; externally peer reviewed.
Data sharing statement No additional data are available.