Article Text

Abstract
Objectives To perform a systematic literature review on imaging techniques for diagnosis, outcome prediction and disease monitoring in large vessel vasculitis (LVV) informing the European League Against Rheumatism recommendations for imaging in LVV.
Methods Systematic literature review (until 10 March 2017) of diagnostic and prognostic studies enrolling >20 patients and investigating ultrasound, MRI, CT or positron emission tomography (PET) in patients with suspected and/or established primary LVV. Meta-analyses were conducted, whenever possible, obtaining pooled estimates for sensitivity and specificity by fitting random effects models.
Results Forty-three studies were included (39 on giant cell arteritis (GCA), 4 on Takayasu arteritis (TAK)). Ultrasound (‘halo’ sign) at temporal arteries (8 studies, 605 patients) and MRI of cranial arteries (6 studies, 509 patients) yielded pooled sensitivities of 77% (95% CI 62% to 87%) and 73% (95% CI 57% to 85%), respectively, compared with a clinical diagnosis of GCA. Corresponding specificities were 96% (95% CI 85% to 99%) and 88% (95% CI 81% to 92%). Two studies (93 patients) investigating PET for GCA diagnosis reported sensitivities of 67%–77% and specificities of 66%–100% as compared with clinical diagnosis or temporal artery biopsy. In TAK, one study each evaluated the role of magnetic resonance angiography and CT angiography for diagnostic purposes revealing both a sensitivity and specificity of 100%. Studies on outcome prediction and monitoring disease activity/damage were limited and mainly descriptive.
Conclusions Ultrasound and MRI provide a high diagnostic value for cranial GCA. More data on the role of imaging for diagnosis of extracranial large vessel GCA and TAK, as well as for outcome prediction and monitoring in LVV are warranted.
- giant cell arteritis
- ultrasonography
- magnetic resonance imaging
This is an Open Access article distributed in accordance with the Creative Commons Attribution Non Commercial (CC BY-NC 4.0) license, which permits others to distribute, remix, adapt, build upon this work non-commercially, and license their derivative works on different terms, provided the original work is properly cited and the use is non-commercial. See: http://creativecommons.org/licenses/by-nc/4.0/
Statistics from Altmetric.com
Key messages
What is already known about this subject?
Imaging modalities including ultrasound (US), MRI, CT and 18F-FDG positron emission tomography are frequently used for diagnosing large vessel vasculitis (LVV) in clinical practice. However, their diagnostic value is still questioned by several clinicians, especially by those with less experience in imaging.
What does this study add?
US and MRI of the superficial temporal artery reveal a good performance for the diagnosis of cranial giant cell arteritis (GCA) with pooled sensitivities of 77% and 73%, respectively, as well as pooled specificities of 96% and 88%, respectively.
Studies on the diagnostic accuracy of imaging in extracranial large vessel GCA and Takayasu arteritis are scarce.
Studies on the role of imaging techniques for outcome prediction and monitoring of disease activity and damage of LVV are limited and mainly non-informative because of heterogeneous study design and of being mostly descriptive, not enabling reaching an inferential conclusion.
How might this impact on clinical practice?
The results of this systematic literature review help clinicians to place the use of imaging in the diagnosis of LVV in their daily clinical practice.
US and MRI of the temporal arteries can be accurately used in the diagnostic work-up of patients with a suspicion of cranial GCA, possibly avoiding the need for more invasive diagnostic techniques, such as a temporal biopsy.
Introduction
Large vessel vasculitis (LVV) is the most common form of primary vasculitis comprising (cranial and large vessel (LV)) giant cell arteritis (GCA), Takayasu arteritis (TAK) and idiopathic aortitis. Prompt diagnosis and treatment of LVV are important to prevent serious ischaemic complications such as visual loss in GCA, vascular stenosis/occlusion in TAK and aneurysm formation in idiopathic aortitis.1 2 Temporal artery biopsy (TAB) has been the standard test to confirm the diagnosis of GCA3–5; although highly specific, biopsy is invasive and lacks sensitivity, with false-negative results in up to 61% of patients compared with a clinical diagnosis of GCA.6 In addition, extracranial arteries are usually not accessible for histological assessment, and in extracranial LV-GCA, temporal arteries are spared in up to 40% of patients.7 8 Consequently, GCA diagnosis often relies on the combination of clinical symptoms, elevated serum inflammatory markers and imaging findings.
The classification criteria for TAK focus on the detection of arterial stenosis and occlusions as detected by conventional angiography.9 Conventional angiography, however, does not allow the delineation of vessel wall changes and bears the potential risk of complications, such as allergic reactions, haematoma, iatrogenic embolisation and arterial dissection. Therefore, angiography is being increasingly replaced by newer imaging modalities.2
Aortitis is common in GCA and TAK but rarely occurs as an isolated (idiopathic) disease.10 The diagnosis of idiopathic aortitis is frequently based on radiological findings with inflammatory wall changes of the aorta because histological assessment is only possible if aortic aneurysms are operated.11
The role of imaging modalities including ultrasound (US), MRI, CT and 18F-FDG positron emission tomography (PET) in LVV has been addressed in several studies over the last years. Imaging modalities, however, are not yet uniformly used for the diagnosis and monitoring of LVV in clinical practice. A European League Against Rheumatism (EULAR) project has therefore been undertaken to develop recommendations for the use of imaging in LVV in clinical practice.12
The aim of this systematic literature review (SLR) was to summarise the available evidence on the performance of imaging techniques on diagnosis, outcome prediction and monitoring of disease activity and damage in LVV, as well as technical aspects of imaging modalities in order to inform the EULAR task force developing these new recommendations.12
Methods
Literature search
In the first meeting of the EULAR task force, four key questions were framed according to the Population, Intervention, Comparator, Outcome (PICO) format.13 These referred to the role of US, MRI, magnetic resonance angiography (MRA), PET±CT, CT or CT angiography (CTA) in diagnosis, outcome prediction and monitoring of LVV, as well as technical aspects for the different imaging techniques (online supplementary table S1a–d). The population of interest consisted of adult patients (≥18 years) with a suspected (for diagnostic studies and studies on technical aspects) and/or established primary LVV (ie, GCA, TAK and idiopathic aortitis; for studies on monitoring, prognosis and technical aspects). For diagnostic accuracy of imaging, physician’s clinical diagnosis (both at first assessment and also at first and follow-up assessments) and TAB were accepted as reference standards, and sensitivity and specificity of imaging were the outcomes of interest. For prognostic and monitoring studies, presence and absence of baseline imaging abnormalities (or also over the follow-up for monitoring studies) were considered as ‘interventions’ and ‘comparator’, respectively; outcomes of interest were those reflecting disease activity or damage. The task force did not specify these outcomes, because it was argued that the literature review would reveal relevant outcome parameters addressed in prospective studies.
Supplementary file 1
Eligible studies were all full research articles of cohort studies with prospective design (excluding research letters, case–control and retrospective studies) involving >20 patients; both cross-sectional and longitudinal studies were included.
Study selection, data extraction and assessment of risk of bias (RoB)
The SLR was conducted by two reviewers (ChristinD and ChristiaD) under the guidance of the methodologist (SR) and with the help of the statistician (AS), who performed the meta-analyses. The search strategy was developed by an experienced librarian (LF) (online supplementary text S1). MEDLINE (1946), Embase (1974) and the Cochrane Library (1993) databases were searched without language restrictions from their inception dates (noted in parentheses) until 10 March 2017.
The reviewers screened independently all titles and abstracts to identify potentially eligible studies that were then reviewed in full text. Papers fulfilling the inclusion criteria were proceeded to data extraction. Both reviewers independently retrieved data using a predefined data extraction sheet. The following data were extracted for diagnostic studies: studies’ main characteristics (year of publication, setting, number of included patients, inclusion criteria, use of glucocorticoids (GC) before performance of imaging), patient characteristics (number (%) of females, patients’ age), disease characteristics (number (%) of patients fulfilling clinical criteria for GCA or TAK, number (%) of patients with positive TAB, number (%) of patients with the LV-GCA subset), technical aspects (imaging devices used, elementary lesions and structures investigated, blinding of the index test to reference standard), index test (lesions identified in the index test that are analysed), reference standard, diagnostic performance (raw data to calculate sensitivity, specificity, positive likelihood ratio (LR+) and negative likelihood ratio (LR−)) and parameters required for the assessment of the RoB. For prognostic and monitoring studies, the following items were retrieved: study’s aim, inclusion criteria, number of patients included, number (%) of patients with follow-up, period of follow-up, investigated structures, signs and time of change, prognostic factors and outcome—as explained above any outcome reflecting disease activity or damage. For technical aspects, we extracted the study aim, number of included patients, inclusion criteria, number of patients finally diagnosed with GCA or TAK, investigated structures, different technical aspects being compared (intervention and comparator) and outcome (diagnostic performance or disease activity/damage, as appropriate) were detailed.
RoB of the studies was appraised independently by the same two reviewers who conducted the SLR. For studies on diagnostic accuracy, the Quality Assessment of Diagnostic Accuracy Studies-2 (QUADAS-2) tool was used comprising four domains: patient selection, index test, reference standard, as well as flow and timing. Each of these domains was evaluated as having a ‘low’, ‘high’ or ‘unclear’ RoB, whereas concerns about applicability were evaluated in the first three domains also as ‘low’, ‘high’ or ‘unclear’. The Quality In Prognosis Studies (QUIPS) tool was applied for the assessment of prognostic studies evaluating the following aspects: study participation and attrition, prognostic factor measurement, outcome measurement, study confounding as well as statistical analysis/reporting.14 15 Each QUIPS domain was rated as ‘high’, ‘moderate’, ‘low’ or ‘unclear’ RoB. For studies on monitoring and technical aspects, no RoB assessment was performed, because identified studies were mainly only descriptive (see below), hence no adequate RoB assessment could be performed. Discrepancies between reviewers regarding study selection, data extraction and RoB assessment were solved by discussion. A third reviewer (WAS) was involved in case no consensus could be achieved (n=2 studies).
Data analysis
Meta-analysis for diagnostic accuracy was performed whenever possible, that is, in case enough data stemming from homogeneous studies concerning imaging modality, reference standard (either clinical diagnosis or TAB as reference standards) and outcome assessment was available. For all other diagnostic accuracy studies as well as for prognostic and monitoring studies, individual results (of studies not included in the meta-analysis) are reported.
Pooled sensitivity and specificity were estimated by random-effects bivariate generalised binomial mixed models. This is the recommended analytical method for meta-analysis of diagnostic tests, since it estimates sensitivity and specificity together taking into account their correlation.16 Parameter estimates from each model were used to derive the LR+ and LR− and 95% CIs. In case of limited data (here: ≤3 studies), the above-mentioned rule was relaxed, and univariate random-effects models were used by assuming no correlation between sensitivity and specificity.16
Sensitivity analyses were performed for diagnostic accuracy studies on US and MRI in GCA evaluating the effect of: (1) the quality of studies (excluding those with high RoB), (2) GC treatment before the index test (including only those without GC treatment before imaging), (3) the use of imaging devices with high resolution (including only studies that used >12 MHz probes for US or 3T MRI machines), (4) target population (including only studies with a detailed description of what was meant by the ‘suspicion’ of GCA) and (5) reference standard (including only studies with clinical diagnosis confirmed after follow-up used as reference standard).
All analyses were conducted in Stata V.14. The Cochrane Collaboration’s Review Manager Software V.5.3 was used to build forest plots.
Results
Out of 8691 articles screened, 43 studies were finally included with some of these addressing more than one index test or key objectives (see flow chart in online supplementary figure S1). For GCA, 27 articles focused on the diagnostic accuracy,6 17–425 studies on outcome prediction,43–47 13 on monitoring disease activity17 20 22 25 28 29 43–45 48–51 and five on technical aspects.35 37 52–54 For TAK, four studies were included with two studies addressing diagnostic accuracy55 56 and two studies evaluating the value of imaging for monitoring.57 58 No study on isolated aortitis was identified.
Diagnostic accuracy studies
For GCA, most diagnostic accuracy studies focused on the role of US (n=17)6 17–32 or MRI (n=8).33–40 One study addressed the role of PET,41 and another study examined the role of PET and CTA for GCA diagnosis.42 In TAK, one study evaluated the role of MRA and another the role of CTA.55 56
Ultrasound
The main study—and patient—characteristics are summarised in table 1 with additional data and details on the RoB assessment described in online supplementary tables S2 and S6, respectively. Most US studies in GCA tested the ‘halo’ sign (n=166 17–31) as a key elementary lesion defining vasculitis. Other US signs addressed (mostly in combination with the ‘halo’ sign) were stenosis (n=136 17 18 20 22–30), occlusion (n=96 17 22–26 28 30) and the ‘compression’ sign (n=230 32).
Main characteristics of diagnostic studies on ultrasound in GCA
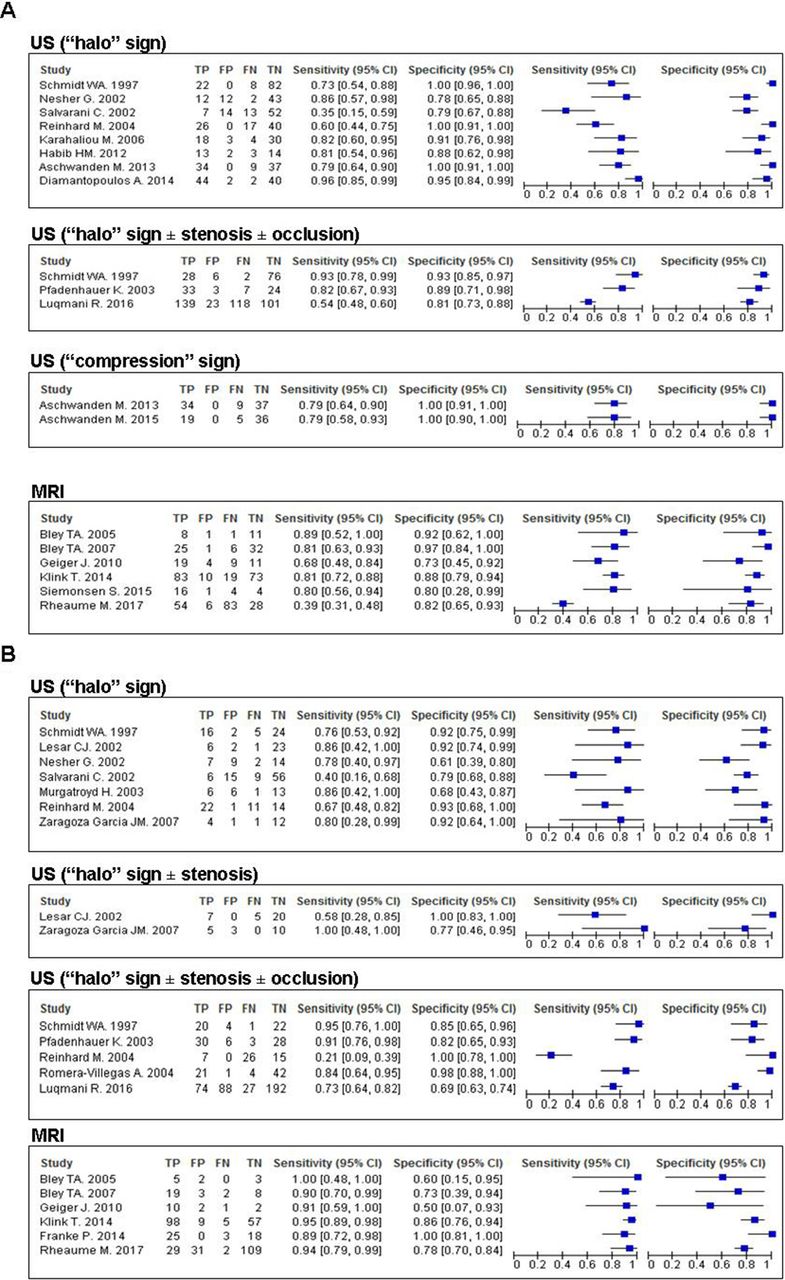
Results of the meta-analysis on the diagnostic performance of the different US signs are summarised in table 2, and results of individual studies are shown in figure 1A,B.

(A) Diagnostic performance of different ultrasound (US) signs of vasculitis and MRI studies in comparison with clinical diagnosis as reference standard. (B) Diagnostic performance of different US signs of vasculitis and MRI studies in comparison with temporal artery biopsy as reference standard. TP, true positives; FP, false positives; FN, false negatives; TN, true negatives.
Results of the meta-analysis (pooled estimates) for ultrasound and MRI signs of vasculitis in comparison with clinical diagnosis or temporal artery biopsy as reference standard for giant cell arteritis (GCA)
Eight studies (n=605, three studies with low RoB)17 19 20 23 25 28 30 31 investigated the value of the ‘halo’ sign in comparison with the clinical diagnosis of cranial GCA yielding a pooled sensitivity of 77% (95% CI 62% to 87%) and a specificity of 96% (95% CI 85% to 99%). A similarly good diagnostic performance was obtained when the ‘halo’ sign was compared with TAB as reference standard (seven studies, n=289, no study with low RoB).17–21 23 27 Also, the evaluation of the combination of US signs defining vasculitis (‘halo’, stenosis or occlusion) in comparison with clinical diagnosis (three studies, n=560, no study with low RoB)6 17 22 or TAB (five studies, n=611, one study with low RoB)6 17 22–24 resulted in a similar diagnostic performance as the ‘halo’ sign alone. Sensitivity analyses for the diagnostic performance of the ‘halo’ sign (compared with clinical diagnosis of cranial GCA) as detailed above, revealed higher pooled sensitivities (86%–89%) than the main analysis and comparable or slightly lower specificities. The only exception was the analysis including only studies without GC treatment before the index test, which had a slightly lower sensitivity of 73% (table 3).
Sensitivity analyses for diagnostic studies on ultrasound (‘halo’ sign) and MRI in comparison with clinical diagnosis for cranial giant cell arteritis (GCA) as reference standard
Two studies (n=140, both with low RoB),30 32 conducted by the same research group, investigated the ‘compression’ sign. The authors reported sensitivities of 77%–79% and a specificity of 100% of this sign compared with the clinical diagnosis of cranial GCA.
In three US studies6 29 31 (n=541, one study with low RoB), extracranial arteries were examined. Only one of these addressed the effect of the examination of temporal plus axillary arteries on the diagnostic performance as compared with the assessment of temporal arteries alone. This study revealed an incremental change of sensitivity of 2% by the former compared with the latter approach.31 Although 22 arteries were evaluated in the study by Aschwanden et al 29 a low sensitivity of 55% was observed for US (‘halo’ and stenosis) to detect vasculitis. No separate results for the diagnostic performance of US in patients with cranial and extracranial LV involvement were provided in that study.29
No study on US in TAK was identified.
Magnetic resonance imaging
All MRI studies addressed vessel wall thickening and contrast enhancement as signs of vasculitis in the superficial temporal and occipital arteries. Study characteristics are detailed in table 4, individual sensitivity and specificity data are reported in online supplementary table S3 and figure 1A,B and details of the RoB assessment are shown in online supplementary table S6.
Main characteristics of diagnostic studies on MRI in cranial giant cell arteritis (GCA) and Takayasu arteritis (TAK)
Six MRI studies were included in the meta-analysis using clinical diagnosis33–35 38–40 (n=509, one with low RoB) and/or TAB33–35 37 38 40 (n=443, one with low RoB) as the reference standard (table 2). A pooled sensitivity of 73% (95% CI 57 to 85) and specificity of 88% (95% CI 81 to 92) was found comparing MRI with the clinical diagnosis of cranial GCA. When TAB was used as the reference standard, MRI yielded a sensitivity of 93% (95% CI 89 to 96) and a specificity of 81% (95% CI 73 to 87). Sensitivity analyses, as detailed in table 3, underlined the robustness of the main analysis. Of note, in all included MRI studies, patients were on treatment with GCs when the MRI was conducted. One study examined the role of the deep temporal arteries and the involvement of the temporal muscle for the diagnosis of GCA revealing a sensitivity of 42% and a specificity of 90% (online supplementary table S3).36 This study was not included in the meta-analysis because the structures investigated were different from those of other studies. No study was identified addressing the role of MRI for the evaluation of extracranial LV-GCA.
One study55 (n=30, low RoB) investigated MRA for the diagnosis of TAK using conventional angiography as the reference standard (see table 4 and online supplementary tables S3 and S6 for further details). A sensitivity of 100% (95% CI 76 to 100) and a specificity of 100% (95% CI 63 to 100) for MRA was reported.
18F-FDG positron emission tomography
Only two studies41 42 (n=93, one study with low RoB42) focused on the diagnostic performance of 18F-FDG-PET for the diagnosis of extracranial LV-GCA yielding sensitivities of 67%–77% and specificities of 66%–100%, using TAB or a clinical diagnosis after 6 months as reference standards, respectively. The study by Lariviere et al 42 (n=24, low RoB), reporting a specificity of 100%, applied a semiquantitative approach (aortic-to-blood pool uptake ratio) for the evaluation of 18F-FDG vessel wall uptake (table 5 and online supplementary table S4 for further study details, online supplementary table S6 for RoB assessment).
Main characteristics of diagnostic studies on 18F-FDG positron emission tomography (18F-FDG PET) and CT angiography (CTA) in extracranial large vessel giant cell arteritis (GCA) and Takayasu arteritis (TAK)
CT angiography
The study by Lariviere et al mentioned above42 (n=25, with low RoB) evaluated the roles of PET and CTA within the same population. CTA revealed a sensitivity of 73% (95% CI 45 to 92) and a specificity of 78% (95% CI 40 to 97) using the clinical diagnosis of GCA after 6 months as reference standard.
For the diagnosis of TAK, one study56 (n=25, with low RoB) examined the role of CTA reporting a sensitivity of 100% (95% CI 76 to 100) and a specificity of 100% (95% CI 40 to 100) compared with conventional angiography (table 5 and online supplementary tables S5 for further study details, online supplementary table S6 for RoB assessment).
Outcome prediction, monitoring disease activity and damage and technical aspects of imaging techniques
Description of observations without inferences in monitoring studies (n=11) and studies on technical aspects (n=5) as well as heterogeneity in study design, outcomes and technical settings of prognostic studies (n=5) precluded any meta-analysis. Main study characteristics and findings are summarised in online supplementary tables S7–S10.
Five studies investigated the role of US,43 44 18F-FDG-PET45 46 or CT47 for outcome prediction in GCA (online supplementary table S7) with none of them being appraised at low RoB (online supplementary table S8). GCA characteristic US lesions at baseline did not predict a relapse,44 and the risk of ischaemic complications was similar in patients with temporal and extracranial LV involvement.43 The response of 18F-FDG-uptake to GC therapy (at 3 and 6 months) was not associated with the risk of relapse45; however, baseline 18F-FDG-uptake at the aorta predicted aortic dilatation during long-term disease course according to one study.46 For TAK, no study was identified addressing the role of imaging for outcome prediction.
For GCA, 13 studies were found investigating the role of imaging for monitoring disease activity and damage.17 20 22 25 28 29 43–45 48–51 Ten US studies (197 patients, follow-up range: 1–41 months) reported that the ‘halo’ sign at temporal arteries was no longer detected in the majority of patients after 2–4 weeks of GC therapy,17 20 22 25 28 29 43 44 48 49 whereas at larger arteries, vessel wall swelling persisted in two thirds of patients according to CT and US studies.43 51 Additionally, the occurrence of new vasculitic US lesions was reported in up to 10% of GCA patients despite GC treatment.43 18F-FDG uptake in the wall of extracranial LVs was comparable in GCA patients in full remission and those with a relapse.45 In TAK, US and MRI were also not helpful to discriminate between active disease and remission57 58 (see online supplementary table S9 for details on monitoring studies).
All five studies (two on MRI, three on 18F-FDG-PET)35 37 52–54 on technical requirements, settings and operational procedures were performed in GCA patients and are summarised in online supplementary table S10.
Discussion
This SLR confirms the good performance of US and MRI for the diagnosis of cranial GCA. The ‘halo’ sign (US) and increased vessel wall thickness in combination with contrast enhancement (MRI) of superficial temporal arteries, respectively, were the most relevant imaging findings suggesting GCA. Data on imaging for diagnosis of extracranial LV disease remain limited.
The diagnostic performance of US was better in the current than in previous meta-analyses with a higher sensitivity (77% vs 55%–69%)59–61 but similar specificity (96% vs 89%–94%)59–61 for diagnosis of cranial GCA, which possibly relies on the fact that we included more recent, high-quality studies. A recent SLR conducted by Buttgereit et al identified many of the same studies described in this work; however, that SLR focused on imaging modalities in GCA and PMR (omitting papers on TAK), spared CT and only reported diagnostic values of individual studies rather than providing meta-analysed estimates on sensitivity and specificity.62 This is a clear addition of our SLR, together with also covering outcome prediction as well as monitoring disease activity/damage, not addressed in previous SLRs. The sensitivity analyses of the meta-analysis suggest that technical aspects and the definition of study entry criteria have all an impact on the sensitivity of US. Expertise with vascular US (as in any other diagnostic test) is another factor that may influence its diagnostic properties. We could not assess this factor, since all studies were conducted by expert groups. GC treatment before an imaging test has been demonstrated to reduce the sensitivity of the respective imaging modality.6 63 Our results do not seem to confirm this observation since the ‘halo’ was less sensitive for diagnosis of cranial GCA when pooling studies in which patients had not been treated with GCs before US was performed as compared with the main analysis. This finding, however, was largely influenced by a single study with high RoB and, by exclusion of that particular study, US was more sensitive to diagnose cranial GCA in patients without GCs as compared with the main analysis (83% vs 77%).
The observation that the combination of the US signs ‘halo’, stenosis and occlusion had a similar sensitivity to the ‘halo’ sign alone can be explained by the fact that in GCA, vascular stenosis or occlusion is usually caused by inflammatory wall swelling, which is the morphological correlate of the ‘halo’ sign.6 17 22–24
The ‘compression’ sign, another key elementary US lesion for cranial GCA, revealed a good diagnostic performance in two studies.30 32 Both studies, however, were published by the same research group and were not completely independent since five patients (Aschwanden M, personal communication) were included in both studies.
The pooled sensitivity (73%) and specificity (88%) of MRI was lower than that of US (77% and 96%, respectively) when the clinical diagnosis was used as the reference standard, while MRI had a higher sensitivity (93% vs 70%) and a similar specificity (81% vs 84%) to sonography when both modalities were compared with TAB. This indirect comparison must be interpreted with caution, because the different test performances are likely also influenced by variations in study design and data analysis. In most MRI studies, for example, TAB was performed in selected cases with high suspicion of GCA only, while in US studies, the majority of patients underwent a TAB. A retrospective study comparing US and MRI directly reported a similar sensitivity (69% and 67%, respectively) and specificity (both with 91%) for both techniques,64 whereas a prospective direct comparison of both modalities is still missing.
Although PET is commonly used in patients with suspected extracranial LVV, fever of unknown origin or other systemic illnesses, the SLR identified only two prospective studies on this imaging modality41 42 reporting highly discordant results: in the study of Blockmans et al, data from patients with TAB proven GCA, and PMR with 18F-FDG uptake in LVs were both considered as GCA cases. This creates ‘ground’ for circular reasoning given that the test under investigation had also been part of the reference standard.41 Recalculating the PET data for TAB positive GCA patients yielded a sensitivity of 77% and specificity of 66%, which might be an underestimation of the true diagnostic value of PET, because TAB is frequently false negative in patients with extracranial LV-GCA.7 Besides, the study by Lariviere et al, which applied the clinical diagnosis after follow-up of 6 months as reference standard, showed a specificity of PET of 100%.42 This divergence underlines that the performance of a diagnostic test is strongly influenced by the reference standard and that such a standard is urgently needed for extracranial LVV in order to facilitate future studies in the field.
Extracranial large arteries are involved in up to 80% of patients with GCA.8 48 65 66 In one US study, sensitivity improved by only 2%, when axillary arteries were investigated in addition to temporal arteries, with similar specificity.31 Since no other studies were available, the diagnostic gain of evaluating different vascular beds with imaging in addition to cranial arteries remains therefore unclear. Additional studies are warranted to clarify whether a standardised hierarchical approach to assess different vascular territories (eg, temporal, carotid, subclavian and axillary arteries) with US or other imaging modalities improves the diagnostic certainty of cranial and extracranial LV-GCA to an extent that justifies the increased clinical effort. The relatively low sensitivity of 55% for US assessment of 22 arteries reported in the study by Aschwanden et al is probably explained by the fact that one-third of patients had extracranial LV-GCA and that the American College of Rheumatology (ACR) criteria were applied as the reference standard. The ACR criteria mainly capture patients with cranial GCA.29
In TAK, both studies on MRA and CTA revealed excellent sensitivities and specificities using conventional angiography as the reference standard. These studies, however, were small, included (partially) the same patients and there was a long interval between MRA/CTA and angiography.55 56 Future studies on the diagnostic performance of imaging techniques in TAK are thus warranted, and there is a need for a novel reference standard, given that conventional angiography is highly invasive.
Current evidence on the role for imaging modalities for outcome prediction, as well as for monitoring disease activity and damage in LVV is limited. Although a response of vessel wall alterations to GC treatment was detected in both, cranial and extracranial LV-GCA and TAK,17 20 22 25 28 29 43–45 48–51 57 58 neither imaging findings at baseline nor during follow-up were clearly associated with a disease relapse or any other outcome. Besides, monitoring studies were mainly descriptive and without clear inferences, thus precluding drawing a clear conclusion from them that could be of further information for an SLR like ours. The decision to include these studies in the current SLR was solely based on content knowledge, while from a methodological point of view, this decision is obviously arguable. Now, 15 studies on monitoring are included in this SLR, as we were inclusive, and facing a scarcity of studies, tried to retrieve from the literature any information on the value of imaging for monitoring LVV. However, we could have also been somewhat more restrictive by only including studies that analysed any association between the imaging for monitoring and other outcomes (eg, relapse); if this was the case, no eligible study would have been found in the literature. The development of standard tools for monitoring disease activity and damage in LVV is urgently needed and might facilitate further research on the evaluation of the role of imaging for disease monitoring and outcome prediction.
Studies on minimal technical requirements, settings and operational procedures for the evaluation of patients with cranial and extracranial LV-GCA are also scarce. The quality of imaging devices is obviously a critical issue, because poor equipment may easily lead to misclassification of patients67 and because heterogeneity in the quality of imaging devices renders comparison between studies difficult. To avoid this type of bias in our meta-analysis, we performed a sensitivity analysis focusing on studies using high-quality US machines only which resulted, as expected, in a higher sensitivity as compared with the main analysis (87% vs 77%), thus confirming the important role of using high-quality imaging devices.
In summary, this SLR confirms the good performance of US and MRI of the superficial temporal arteries for diagnosis of cranial GCA. More data on imaging techniques in LV-GCA and TAK are needed, as well as on the role of imaging for outcome prediction, monitoring and technical aspects of LVV, as current studies on these aspects are not conclusive. Based on the results of this SLR, EULAR recommendations for the use of imaging modalities in LVV in daily clinical practice have been developed.
References
Footnotes
ChristinD and ChristiaD are first co-authors.
Contributors Study concept and design: ChristinD, ChristiaD, SR and WAS; data collection: ChristinD and ChristiaD; statistical analysis and data interpretation: AS, ChristinD, ChristiaD, SR and WAS; ChristinD prepared the first version of the manuscript. All authors revised the manuscript critically for important intellectual content and gave final approval of the version to be published.
Funding Funding was provided by the European League Against Rheumatism.
Competing interests None declared.
Provenance and peer review Not commissioned; externally peer reviewed.
Data sharing statement No additional data are available.