Article Text

Abstract
Objective To compare several methods of missing data imputation for function (Health Assessment Questionnaire) and for disease activity (Disease Activity Score-28 and Clinical Disease Activity Index) in rheumatoid arthritis (RA) patients.
Methods One thousand RA patients from observational cohort studies with complete data for function and disease activity at baseline, 6, 12 and 24 months were selected to conduct a simulation study. Values were deleted at random or following a predicted attrition bias. Three types of imputation were performed: (1) methods imputing forward in time (last observation carried forward; linear forward extrapolation); (2) methods considering data both forward and backward in time (nearest available observation—NAO; linear extrapolation; polynomial extrapolation); and (3) methods using multi-individual models (linear mixed effects cubic regression—LME3; multiple imputation by chained equation—MICE). The performance of each estimation method was assessed using the difference between the mean outcome value, the remission and low disease activity rates after imputation of the missing values and the true value.
Results When imputing missing baseline values, all methods underestimated equally the true value, but LME3 and MICE correctly estimated remission and low disease activity rates. When imputing missing follow-up values at 6, 12, or 24 months, NAO provided the least biassed estimate of the mean disease activity and corresponding remission rate. These results were not affected by the presence of attrition bias.
Conclusion When imputing function and disease activity in large registers of active RA patients, researchers can consider the use of a simple method such as NAO for missing follow-up data, and the use of mixed-effects regression or multiple imputation for baseline data.
- DAS28
- rheumatoid arthritis
- epidemiology
- outcomes research
- disease activity
This is an open access article distributed in accordance with the Creative Commons Attribution Non Commercial (CC BY-NC 4.0) license, which permits others to distribute, remix, adapt, build upon this work non-commercially, and license their derivative works on different terms, provided the original work is properly cited, appropriate credit is given, any changes made indicated, and the use is non-commercial. See: http://creativecommons.org/licenses/by-nc/4.0/.
Statistics from Altmetric.com
Key messages
What is already known about this subject?
Missing data is a major problem in large register of observational data. The use of complete case analysis is known to be a potential source of bias, and imputation of missing data is recommended.
What does this study add?
The present work provides the first systematic study comparing the consequences of a wide range of strategies for dealing with missing values of function or disease activity in large registers of patients with rheumatoid arthritis (RA).
Imputation methods considering data both forward and backward in time, such as using the nearest available observation, give a mean value and an associated remission or low disease activity rates almost unbiased for missing follow-up.
How might this impact on clinical practice or future developments?
The results presented will help researchers to appropriately choose imputation methods when dealing with missing function or disease activity data in large register of observational data. This will ease studies exploring the effectiveness and safety of RA treatments in real-world populations, and thus indirectly impact clinical practices.
Introduction
Large observational studies become more common for the assessment of new treatments1 and are encouraged by national or international health agencies.2 Rheumatoid arthritis (RA) studies follows these trends and disease registers have been developed,3–8 allowing to explore the effectiveness and safety of RA treatments in real-world populations. One of the key estimates of effectiveness is the calculation at a given follow-up time of the disease activity and the corresponding remission rate. However, observational register studies often face large amount of missing data, due to a variety of reasons, such as attrition of patients over time or due to missing visits at specific follow-up periods. Missing data of a variable Y can be of three type: (1) missing completely at random (MCAR) if the probability of missing is unrelated to any observed or unobserved variable, (2) missing at random (MAR) if the probability of missing depends on observed variables but not on missing values of Y, and (3) missing not at random (MNAR) if the probability of missing depends on missing values of Y.9 10 To avoid reducing the statistical power and to prevent the potential bias that complete case analyses (CCA) would cause in case of MAR or MNAR data,11 12 the use of imputation techniques to handle missing data is advised. Imputation methods available for longitudinal data are numerous. Some impute forward in time, such as last observation carried forward (LOCF) or linear forward extrapolation (LFE). Others consider data both forward and backward in time, for instance nearest available observation (NAO),13 linear extrapolation (LE), and polynomial extrapolation (PE), where the missing data is obtained by the adjustment of the variable time dependence with a third order polynomial. More advanced methods use all available data from all patients. Mixed effects regression, for example, can be used as an imputation method by estimating the mean and the individual time evolution of disease activity to extrapolate missing data.14 Finally, the well-known multiple imputation using chained equation (MICE), uses data from other variables instead of using only the variable Y at different time points.15 16 Despite the existence of this panel of techniques, an informal review of the articles using large registers published in two major rheumatology journals (Annals of the Rheumatic Diseases and Arthritis&Rheumatology) over the last 2 years demonstrated that almost 50% of them do not describe the strategy used to handle missing data, 25% use CCA and 5% LOCF. This observation, which is not specific to rheumatology,17 is partly due to the absence of guidelines and the lack of studies tackling the problem of data imputation in large registers and its impact on outcomes estimates. Although imputation has been studied in clinical trials of rheumatic diseases11 18–22 and in small registers,23 the focus was generally limited to only a few imputation techniques and applied to a panel containing maximum four data points per patient. The aim of this work is thus to compare the effects of the main imputation techniques for MCAR or MAR data and the resulting impact on the estimation of mean function and disease activity and on the derived remission and low disease activity (LDA) rates in longitudinal observational data of RA patients. We will focus on the estimation of mean function and disease activity and remission rate at baseline and three specific but common follow-up: 6, 12 and 24 months.
Methods
We used RA patient data from six national registries (Czech Republic, Denmark, Italy, Norway, Portugal and Sweden) of an existing register collaboration of RA registers (the Pan-European analysis of real-world effectiveness of abatacept (PanABA)).8 24 Each register has obtained ethical approval for the use of anonymous data for research in their local ethics committee. Inclusion criteria were diagnosis of RA established by a rheumatologist, >18 years of age and initiation of a treatment with abatacept or tumor necrosis factor-inhibitors. Baseline (0 month) was defined as the initiation of a bDMARD treatment, and follow-up as the time elapsed since treatment initiation. The three outcomes of interest were the Health Assessment Questionnaire (HAQ) and the disease activity score based on 28 joints (DAS28) at four time points of interest: baseline, 6, 12 and 24 months. Because in real world observational data, patients’ visits are rarely exactly at the specified time point, function and disease activity scores were taken within a time window from 0 to +1 month for baseline or treatment initiation, and within a 3-month time window centred at the time of interest for follow-up visits (6, 12, or 24 months).
Creation of the two datasets for the simulation study
First, a random sample of 1000 patients were selected from a pool of patients with complete data for the three outcomes at 0, 6, 12 and 24 months (DS1). The patients selected in for this simulation study had more visits on average (median 20, IQR 8–25) than patients from the registers not included in this study (median 6, IQR 2–7). In order to study the behaviour of imputation methods on a dataset representative of patients a commonly followed in registers, we created a second dataset DS2 with a number of visits per patient similar to the average patient in the registers. To this end, we randomly selected for each patient of DS1 a number of visits following the probability density function of the overall dataset of 49 319 patient stemming from 13 different countries (online supplementary figure S1). This procedure ensures that the DS2 dataset contained patients with similar visit numbers as the entire register collection. Main simulations were performed on DS2, while sensitivity analysis on availability of data near follow-up were performed on DS1 (see Sensitivity analysis section).
Supplemental material
Creating missing data
For each follow-up time of interest, missing data in the two datasets were created by deleting all data in a given time window centred on the time of imputation for a number of patients corresponding to a predetermined percentage of missing data (eg, 60% missing data at 6 months, corresponds to 600 patients having no data available in a time windows centred on 6 months). The percentage of missing data at each time of imputation was varied from 10% to 90%. To simulate MCAR missing data, patients having missing data were chosen randomly, independently of any other variable. To simulate MAR missing data, patients with missing data were chosen by sampling them with a probability given by the odds of having a missing value for the considered outcome and follow-up time. For each outcome and follow-up, these odds were extracted from a generalised linear model applied on the entire register estimating the probability of having a missing outcome as a function of the treatment duration, the number of previous biological treatments and the baseline value of disease activity.
Sensitivity analysis
The length of time windows for the deletion of all observations used to create missing data was set to 3 months. As imputation performance may depend on the proximity of available data near follow-up, we varied the length of the time windows for deletions from 3 to 6 months, 12 months (only for 12 and 24 months follow-up to avoid deleting baseline data) and 18 months (for 24 months follow-up) when creating missing data in DS1.
Imputation methods
Schematic of the imputation methods is presented in online supplementary figure S2.
Last observation carried forward
LOCF sets the missing data to the last available value for each patient.
Linear forward extrapolation
LFE assumes a linear trend between the missing data and the last two available data. The predicted value  of variable Y at follow-up t is:

where  is the last time with available data for Y and
  the second last one.
Nearest available observation
NAO sets the missing data as equal to the closest available data in time (backward or forward) for each patient.
Linear extrapolation
LE assumes a linear trend between the missing data and the two closest available data in time. Mathematical expression is the same as LFE with  the closest time with available data for Y and
  the second closest.
Polynomial extrapolation
PE adjusts the individual variable Y with a K order time polynomial (for N measures,  and
and  ), and predict the Y missing value by calculating its value at follow-up t:

with a, b1, b2 and b3 the polynomial coefficients estimated using ordinary least square regression.
Linear mixed effects cubic regression
LME3 is a linear mixed effects model adjusting the variable to be imputed by a third order polynomial of time using all patients together. Considering  the variable vector with the missing data and
  the time vector associated for patient i, the regression reads:

with  the fixed effect coefficients and
  their random counterpart. The missing data at follow-up t is predicted by directly estimating Y for each patient at t from the regression result.25 26
Multiple imputation by chained equation
Multiple imputation is a widely used technique of imputation developed by Rubin27 28 based on a Monte Carlo technique in which the dataset with missing value is replaced by  complete dataset. We used here MICE16 with the predictive mean matching technique implemented in the mice library in R with
  iterations. Due to the high computational power required for our simulation, we chose m so that the SD of the imputation is only 1% wider than the one obtained with an infinite number of imputation28:

with λ being the rate of missing information, and  the relative efficiency here set to 1%. It resulted in m varying between 22 and 35 depending on the parameters. In this simulation study, the variables used for the imputation were time elapsed since treatment initiation, age, sex, patient identifier, number of previous biological DMARD, type of concomitant synthetic DMARD, disease duration, seropositivity and when imputing at time different than baseline, the baseline values of DAS28 and HAQ.
As sensitivity analysis, other MICE methods were tried for missing values set at 60%: Bayesian linear regression, random sample from observed values, random forest imputations. Influence of iteration and imputation number has been tested by increasing both the imputation number ( ) and the iteration number (
 ).
).
Complete case analysis
We also presented results based on CCA, for example, restricting results to follow-up with no missing values.
Aberrant values
When imputing with LE, LFE or PE and if the imputed value was negative or above maximal possible value, it was set to 0 or the maximum value respectively. Following recommendations,29 imputed value of MICE were not changed.
Simulation
For each condition of missing data, follow-up, percentage of missing data at follow-up and size of the deletion time windows, the values of the outcomes were deleted and imputed with each imputation method 1000 times. Simulation was performed on the high performance computing facility of the Geneva University.
Statistical methods
For each parameter condition, the mean value and the relative bias for the DAS28 and HAQ were calculated and averaged over the 1000 runs of the simulation. The relative bias for a value α is

In addition, for DAS28, the percentage of remission and of LDA was also computed to better assess the potential clinical impact of the different imputation techniques.
R 3.6.130 software with the libraries lme4, mice, parallel, ggplot2 and data.table were used to conduct the study. The code is provided as a supplementary file and can be used to implement these imputation techniques.
Results
Data MCAR
Mean imputed values
For missing baseline values, all imputation methods underestimated the true mean value of DAS28 (figure 1, left panel and online supplementary table S1) and HAQ. PE and LME3 estimated the best results with around −20% bias. LOCF and LE cannot be used at baseline since no prior data are available. For missing 6, 12 and 24 months values, LOCF consistently overestimated the true values, while LFE underestimated them, the absolute bias decreasing for longer follow-ups. Among the methods using data points before and after the missing values, NAO was the most accurate. LME3 overestimated the true values, with biases below 10% in absolute value at 12 and 24 months. MICE also displayed small biases, consistently below 10%.
Supplemental material
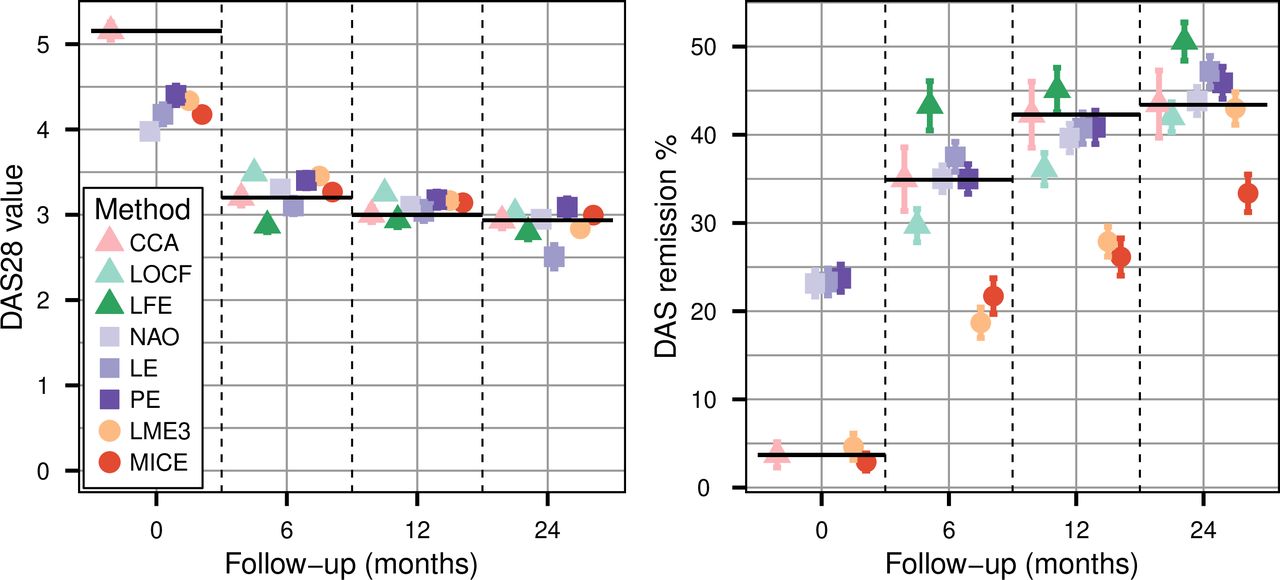
Mean disease activity score based on 28 joints (left panel) and corresponding remission rate (right panel) of the data panel where the 60% of data missing completely at random at follow-up were handled with complete case analysis (CCA), last observation carried forward (LOCF), linear forward extrapolation (LFE), nearest available observation (NAO), linear extrapolation (LE), polynomial extrapolation (PE), linear mixed effect cubic regression (LME3) and multiple imputation by chained equation (MICE). Error bars are the standard errors calculated over the 1000 simulation samples. LFE and LOCF estimation are missing for t=0 since these methods use previous values, which do not exist at baseline. Black horizontal lines represent the true values for each follow-up.
Compared with imputed missing DAS28, imputed HAQ values presented similar relative bias (online supplementary table S2). Varying the proportion of missingness between 10% and 90% at follow-up didn’t affect the bias of the imputed values. It resulted in a linear relation between the bias of the mean outcome calculated over the whole dataset and the percentage of missing value (online supplementary figure S3), since an increase of missing value increments the amount of biassed imputed value entering the calculation of the mean value.
These results can be explained by the mean temporal shape of the main outcomes (online supplementary figure S4 for DAS28). With appropriate treatment, these outcomes begin by improving sharply in the first few months after treatment initiation, then they tend to level off until the outcomes reach a plateau.31–35 At earlier time points, LOCF tends to overestimates the imputed values, as values before the follow-up tend to be higher than values at later follow-up times. The convex shape of this decrease also explains the underestimation of the LFE imputation, as the outcome deviates from a local linear approximation (see online supplementary figure S5). PE and LME3 probably perform best for missing baseline values because they fit more adequately the initial steeper change compared with the other models. Conversely, values imputed by LME3 and PE at 6 and 12 months are overestimated because of the influence of the higher baseline values. Imputed values at 24 months yielded low relative bias for almost all imputation methods because the outcome reaches a plateau.
Remission and LDA rate
When imputing rates of remission (figure 1, right panel and online supplementary table S3) or LDA derived from disease activity assessments, a large difference in results is observed between the various imputation methods. At baseline, LME3 and MICE yield remission rates close to the true rates, while the three other methods yield remission rates overestimated by three times. As LME3 and MICE imputed values are narrowly distributed around their estimated mean (figure 2, left panel), this does not lead to the overrating of small values produced by the other methods and so to the overestimation of remission rate.

Distribution of disease activity score based on 28 joints values imputed with last observation carried forward (LOCF), linear forward extrapolation (LFE), nearest available observation (NAO), linear extrapolation (LE), polynomial extrapolation (PE), linear mixed effect cubic regression (LME3) and multiple imputation by chained equation (MICE), for two different follow-up (t=0 and t=12 months), 1000 imputations of 60% of data missing completely at random at follow-up. Black plain area is the true distribution, and colour lines are interpolations of the imputed dataset’s distribution. The vertical line corresponds to the threshold of remission rate.
For missing follow-up disease activity data, the narrow distribution of LME3 and MICE imputed value creates a strong underestimation of the true remission rate (figure 2, right panel). The NAO, LE and PE methods on the other hand provide an almost unbiased rate of remission (figure 1, right panel). NAO tends to perform best, because the distribution of NAO imputed data is comparable to the true one, whereas PE and LE tend to change the imputed value distribution because of their tendency to impute negative values (figure 2, right panel). LOCF and LFE yield respectively an underestimated and an overestimated remission rate with similar absolute difference (figure 1), in line with their observed tendency to respectively overproduce high and LDA values (figure 2).
The narrowing of the distribution of LME3 imputed values find its root in the mixed effect part of the regression, because it supposes that the polynomial coefficients are normally distributed across the patients, thus artificially reducing the range of allowed values. This is confirmed by the fact that PE, which is similar to LME3 but considers each patient individually, does not show this artefact (figure 2). The results for LDA yield results qualitatively similar to the remission simulations (see online supplementary figure S6 and online supplementary table S3), confirming our previous conclusions for remission rates.
Data MAR
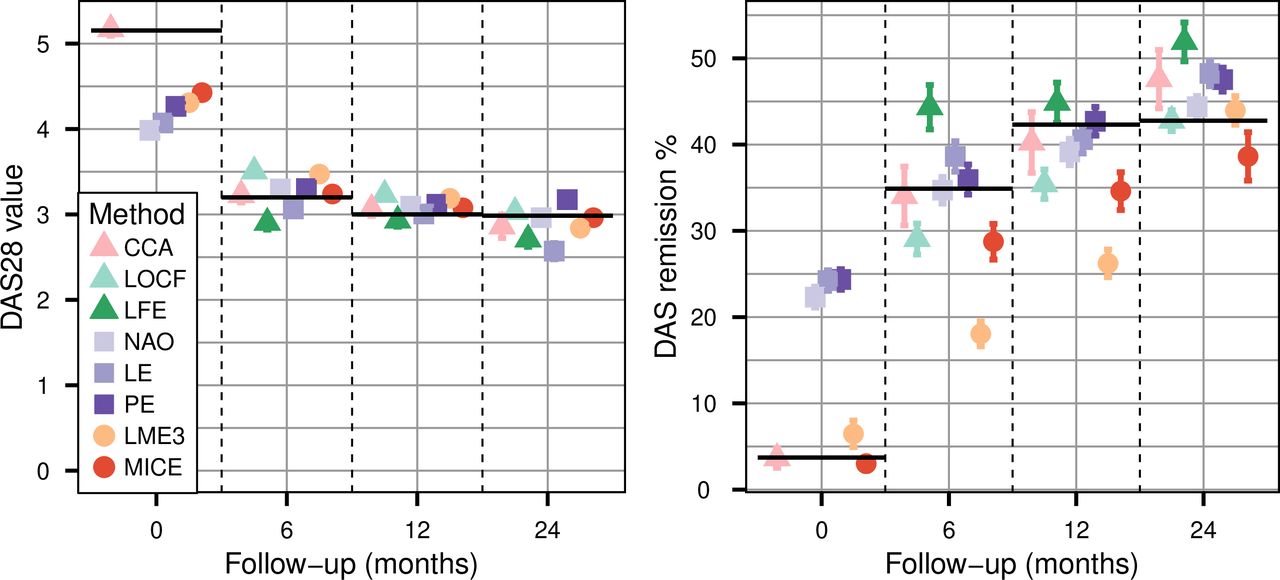
Overall, results were generally similar when missing data patterns depended on covariates. There are two main differences. MICE, which requires MAR data and not MCAR, performs better, but still underestimates true remission rates by at least 10% at any follow-up visits (figure 3). The CCA applied on MAR data leads to biassed estimation of the remission rate, the bias reaching 12% at 2-year follow-up. Imputed mean value, remission rate or LDA by other imputation methods are not or only slightly affected by attrition bias, even though they do not explicitly take into account the covariates. This is certainly due to the fact that these methods use previous or subsequent measures of the outcome, which depend in part on the covariates, and can thus serve as proxy measures of the covariates influencing missing data.

Mean disease activity score based on 28 joints (left panel) and corresponding remission rate (right panel) of the data panel where the 60% of data missing at random at follow-up were handled with complete case analysis (CCA), last observation carried forward (LOCF), linear forward extrapolation (LFE), nearest available observation (NAO), linear extrapolation (LE), polynomial extrapolation (PE), linear mixed effect cubic regression (LME3) and multiple imputation by chained equation (MICE). Error bars are the standard errors calculated over the 1000 simulation samples. LFE and LOCF estimation are missing for t=0 since these methods use previous values, which do not exist at baseline. Black horizontal lines represent the true values for each follow-up.
Sensitivity analysis
In order to test how these results are impacted by the proximity of available data near follow-up, we repeated the analysis on DS1 with varying ranges of the deletion time windows when creating missing data. The results are presented for MAR in online supplementary figure S7 for the mean value, and online supplementary figure S8 for the remission rate. This sensibility study demonstrates that LOCF and LFE are most affected by the size of the deletion time window around the visits. When increasing the deletion time windows, the bias of imputed values increases, since the available time points are further away in time (online supplementary figure S5).
In the sensitivity analysis of MICE parameters, the change in imputation method, number of imputed data sets or iteration number did not affect qualitatively the results presented.
A summary of the different results is presented in table 1.
Summary of the main findings for each imputation method considered
Discussion
This simulation study based on real world data allows to compare the consequences of a wide range of strategies when dealing with missing values for function or disease activity in large registers. However, many methods have been proposed and this simulation study does not test all of them.25 36 The use of CCA can lead to bias greater than 10% in estimating the remission rate for follow-up superior to 1 year. Results for LFE indicates that it should be employed only for follow-up at 2 years or more, in agreement with previous results,21 and that LOCF should be proscribed.37 For other follow-up times, methods considering data both before and after follow-up should be preferred. Complex methods accounting for the whole population such as LME3 and MICE perform well in imputing the mean value of the outcome but can induce changes in the value distribution of the imputed variable, causing considerable bias when estimating derived response rates. The biases of the imputed values are mainly due to the imputation method itself and the evolution in time of the outcome, and thus are not affected by the attrition bias nor by the amount of missing data at follow-up.
Although MICE becomes more popular,15 38 the misspecification of the model and the violation of underlying assumptions such as conditional normality can lead to severe pitfalls39 40 and the choice of covariate is critical.41 Other studies reported changes in distribution of data imputed with MICE.42 Though we included in the model several co-variates, they did not manage to reproduce the variability of the disease activity, even when they were the variables used to generate missing data. A possibility to overcome this problem could be the use of algorithms considering adjacent time.43 Indeed, missing data imputation of longitudinal data with unequal time steps is a very active area of research.43 But given the complexity of such method and the good results of simpler methods, MICE should be restricted to its use in regression models, where it has been widely studied and proven useful.11 44 45
There are strengths and limitations to the present study. The results of our study are supported by the use of data stemming from a large international collection of register of RA patient. Using purely simulated data may lead to excessively good results of the models due to having model assumptions being met too perfectly by the artificial data. Good care was taken for the simulation dataset to reproduce a disease duration and visit frequency structure, as well as pattern of missing data (MAR data), similar to the entire collection of register containing more than 49 000 patients. The large range of imputation techniques considered and the detailed effect of their use on both the mean value of disease activity and the remission rate is another asset of the present study. The results presented are reinforced by their robustness to the different sensitivity analysis performed.
However, using real data is also a limitation. Indeed, the main limitation of the present study is the use of a specific type of observational data coming from patients with active or established RA treated with biological DMARD. Although the results may be generalisable to cohorts with patients presenting a similar evolution of disease activity in time, they cannot be extrapolated without further studies to other types of cohort presenting a different pattern of disease activity over time, such as early arthritis cohorts or remission cohorts. Furthermore, our study only considers missing data of patients still available in the cohort, and does not tackle the difficult problem of lost to follow-up data, for which imputation may not be the proper approach.46
The overall results of this simulation study suggest that imputation of function and disease activity assessments at baseline is best performed with linear mixed effects models with a cubic effect of time (LME3) or multiple imputation (MICE), and for imputation at follow-up times best with the nearest available observation (NAO).
Supplemental material
Acknowledgments
We thank all the health professionals and patients participating in the registers.
References
Footnotes
Twitter @@k_lauper, @@delcourvoisier
Contributors DM and DC designed the analyses. DM performed the simulations and analysed the data. DM, KL, DC and AF drafted the manuscript. All authors critically appraised and approved the final version of the manuscript.
Funding The PANABA collaboration was funded by Bristol Myers-Squibb, data of Czech patients from registry ATTRA were obtained with the support of grant of Ministry of Health 00023728.
Competing interests DM: none declared for this work. KL: none declared for this work. KP: received honoraria for lectures: AbbVie, Roche, MSD, UCB, Pfizer, Amgen, Egis, BMS. CT: none declared for this work. MJS: none declared for this work. EKK: none declared for this work. AF: none declared for this work. DC: none declared for this work.
Patient consent for publication Not required.
Ethics approval Approval of each local ethical committee for the collection of clinical data in each register.
Provenance and peer review Not commissioned; externally peer reviewed.
Data availability statement Data may be obtained from a third party and are not publicly available.