Article Text

Abstract
Objective To evaluate the relationship between disease activity and radiographic progression in rheumatoid arthritis, three phase III studies of SB4, SB2 and SB5 (biosimilars of etanercept, infliximab and adalimumab) were pooled to assess radiographic progression by disease activity status.
Methods Patients from each study with radiographic data were pooled and grouped based on disease activity state (remission, low disease activity (LDA), moderate disease activity (MDA) and high disease activity (HDA)), determined by disease activity score based on 28-joint count (DAS28) per erythrocyte sedimentation rate, Simplified Disease Activity Index (SDAI) and Clinical Disease Activity Index (CDAI) at different time points. Mean change in modified Total Sharp Score (mTSS) and the proportion of radiographic non-progressors of higher disease activity groups (LDA, MDA and HDA) in reference to remission were summarised descriptively, with comparison of ORs using logistic models.
Results 1265 patients were included. In all treatments combined, the 1 year mean change in mTSS was 0.03, 0.4, 0.3 and 1.3 and proportion of radiographic non-progressors was 79.8%, 78.1%, 74.1% and 58.4% in the week 24/30 DAS28-determined remission, LDA, MDA and HDA groups, respectively. ORs (95% CIs) of the proportion of non-progressors were lowest in the HDA group in reference to remission (0.35 (0.23 to 0.54)), followed by MDA (0.72 (0.50 to 1.05)) and LDA (0.90 (0.55 to 1.48)) groups. Similar trends were observed when disease activity was assessed using SDAI or CDAI.
Conclusion A pooled analysis of radiographic assessment data from three biosimilar studies showed that radiographic progression is small overall but increases with worse disease activity.
Trial registration numbers NCT01895309, NCT01936181 and NCT02167139
- anti-TNF
- rheumatoid arthritis
- DMARDs (biologic)
- arthritis
This is an open access article distributed in accordance with the Creative Commons Attribution Non Commercial (CC BY-NC 4.0) license, which permits others to distribute, remix, adapt, build upon this work non-commercially, and license their derivative works on different terms, provided the original work is properly cited, appropriate credit is given, any changes made indicated, and the use is non-commercial. See: http://creativecommons.org/licenses/by-nc/4.0/.
Statistics from Altmetric.com
Key messages
What is already known about this subject?
Tumor necrosis factor (TNF) inhibitors are effective in reducing disease activity and radiograhpic progression
What does this study add?
Radiographic progression in patients receiving tumour necrosis factor (TNF) inhibitors was minimal overall but increased as disease activity worsens.
One-year mean radiographic progression was highest among patients in the high disease activity group and lowest among patients in the remission group.
How might this impact on clinical practice?
When treating with TNF inhibitors, the goal should be low disease activity or remission at early stages of starting therapy.
Introduction
The structural joint damage and systemic complications of rheumatoid arthritis (RA) result in a high rate of disability, quality of life deterioration and substantial costs to patients and society.1–4 Treatment with disease-modifying antirheumatic drugs (DMARDs) is aimed at achieving low disease activity (LDA) or remission in an effort to prevent or minimise joint damage and disability.5 6 Tumour necrosis factor (TNF) inhibitors such as etanercept, infliximab and adalimumab are biological DMARDs (bDMARDs) that are indicated and widely used for the treatment of patients with RA.7–9 These agents are effective with respect to reducing disease activity and radiographic progression,10–18 the latter of which is known to correlate with irreversible functional impairment.19 20 A TNF inhibitor is appropriate as an initial step-up bDMARD therapy in patients exhibiting moderate disease activity (MDA) or high disease activity (HDA), despite prior therapy with methotrexate (MTX) or other conventional synthetic DMARDs.5 6
The phase III clinical trials of approved biosimilars demonstrated non-inferiority in American College of Rheumatology (ACR) response rates and comparable safety and pharmacokinetics between biosimilars and their reference products (etanercept, infliximab and adalimumab, respectively).21–26 Analyses of the safety and efficacy of switching from etanercept, infliximab and adalimumab to their respective biosimilars have not identified any issues.25 27–29
Elucidating the relationship between clinical disease activity and radiographic progression in patients with RA is an area of ongoing interest and research. Indeed, it has been known for several decades that disease activity, such as swollen joint counts, acute phase reactants or levels of composite measures of disease activity (eg, disease activity score based on 28-joint count (DAS28), Simplified Disease Activity Index (SDAI) or Clinical Disease Activity Index (CDAI)), are strongly associated with progression of joint damage.7 10 11 30 31 However, it has also been noted that bDMARDs may diminish the tight link between disease activity and progression even at HDA states.32–37 This is due to differences in thresholds that are required to elicit inflammation when compared with induction of damage.38 Nevertheless, there were some indications that despite the blunting of this association, there may still be a relationship between disease activity and progression of damage even when TNF inhibitors are applied.10 11 To address this question in more detail, we herein report a pooled analysis of the phase III clinical trials of SB4, SB2 and SB5. The objective was to assess 1-year radiographic progression by disease activity state at different time points in patients who received TNF inhibitors.
Methods
Design and patients
Each of the three phase III clinical trials included in this pooled analysis had a multicentre, randomised, double-blind, parallel-group design and enrolled patients with moderately or severely active RA, despite treatment with MTX. The methodologies of each of the clinical trials have been published in detail elsewhere.21–23 Briefly, each study had similar eligibility criteria and, thus, similar patient demographics. Patients were between 18 years and 75 years of age and had been diagnosed with RA (per the ACR 1987 revised classification criteria). Disease duration was ≥6 months, during which patients must have received MTX for ≥6 months and at a stable dosage for ≥4 weeks before screening or randomisation. Additional requirements included the presence of active disease, as evidenced by ≥6 swollen joints and ≥6 tender joints and either erythrocyte sedimentation rate (ESR) ≥28 mm/hour or serum C reactive protein level ≥1.0 mg/dL, and no prior treatment with biological agents.
Given that (1) clinical and radiographic outcomes were similar between individual TNF-inhibitor biosimilars and their respective reference products and (2) no differences regarding clinical and structural outcomes are seen between different types of TNF-blockers,39 40 we pooled all arms of all three studies for the present analyses. Patients were included in this pooled analysis if they completed the clinical trial and had radiographic data available both at baseline (week 0) and week 52/54.
Data extraction
X-ray data of the left and right hand and left and right foot at week 0 and the final assessment at 1 year (ie, week 52/54) were used to determine the modified Total Sharp Score (mTSS), the sum of the joint erosion and joint space narrowing scores.41 42 All X-rays were assessed centrally by two independent qualified readers under blinded conditions, and the mean scores for the two readers were used for this analysis. Radiographic progression was defined as a mean change in mTSS >0; radiographic non-progressors were defined as patients with a mean change in mTSS ≤0. Additionally, the proportion of patients with no rapid radiographic progression was obtained based on baseline mTSS score (≤5 vs >5). Rapid radiographic progression was defined as a 1-year mean change in mTSS >1 or>5. At weeks 12, 24 and 52 (SB4/etanercept and SB5/adalimumab studies) or weeks 14, 30 and 54 (SB2/infliximab study), disease activity was assessed using DAS28 (per ESR), a secondary endpoint in each of the three clinical trials, and by post hoc analyses of SDAI and CDAI data. Corresponding Health Assessment Questionnaire Disability Index (HAQ-DI), Physician Global Assessment Score (PhGA) and Patient Global Assessment Score (PGA) were obtained at week 52/54.
Statistical analysis
Patients were pooled and grouped according to disease activity state of remission, LDA, MDA and HDA, as determined based on DAS28 (ESR), SDAI and CDAI at weeks 12/14, 24/30 and 52/54. Remission was defined as DAS28 (ESR) <2.6, SDAI ≤3.3 and CDAI ≤2.8. Other disease activity cut-off values are presented in online supplementary table 1. Analysis of variance (ANOVA) testing for a linear trend in 1-year mean change in mTSS was used to compare radiographic progression between groups. Mean change in mTSS and the proportion of radiographic non-progressors of higher disease activity groups (LDA, MDA and HDA) in reference to remission were summarised descriptively. ORs of the proportion of radiographic non-progressors of higher disease activity groups (LDA, MDA and HDA) in reference to remission were compared using 95% CIs obtained from logistic models with disease activity state measurement. The estimated difference of the mean change in mTSS was similarly analysed for the higher disease activity groups (LDA, MDA and HDA) in reference to remission. To further aid data interpretation, the cumulative proportion of patients in different disease activity states at week 24/30 was plotted against the change in mTSS over 1 year in all treatment groups.43
Supplemental material
An exploratory analysis was done to examine HAQ-DI, PhGA and PGA scores at 1 year according to disease activity status by DAS28 (ESR), SDAI or CDAI at 6 months.
Results
Of 1580 patients randomised in the three biosimilar trials,21–23 a total of 1265 (80.1%) had an available mTSS assessment at baseline and week 52/54 and were included in this pooled analysis. Baseline characteristics of these patients are summarised in table 1. In all treatments combined, the mean age of participants was 51.3 years, and most patients were women (81.6%). The mean duration of RA was 5.9 years, and the mean mTSS was 37.1 at baseline. Baseline data for the individual studies were published previously.21–23
Baseline demographic and disease activity characteristics
In all treatments combined, the mean±SD change in mTSS from week 0 to the 1 year assessment (week 52/54) was 0.4±2.8, and 72.7% of patients (920/1265) were radiographic non-progressors.
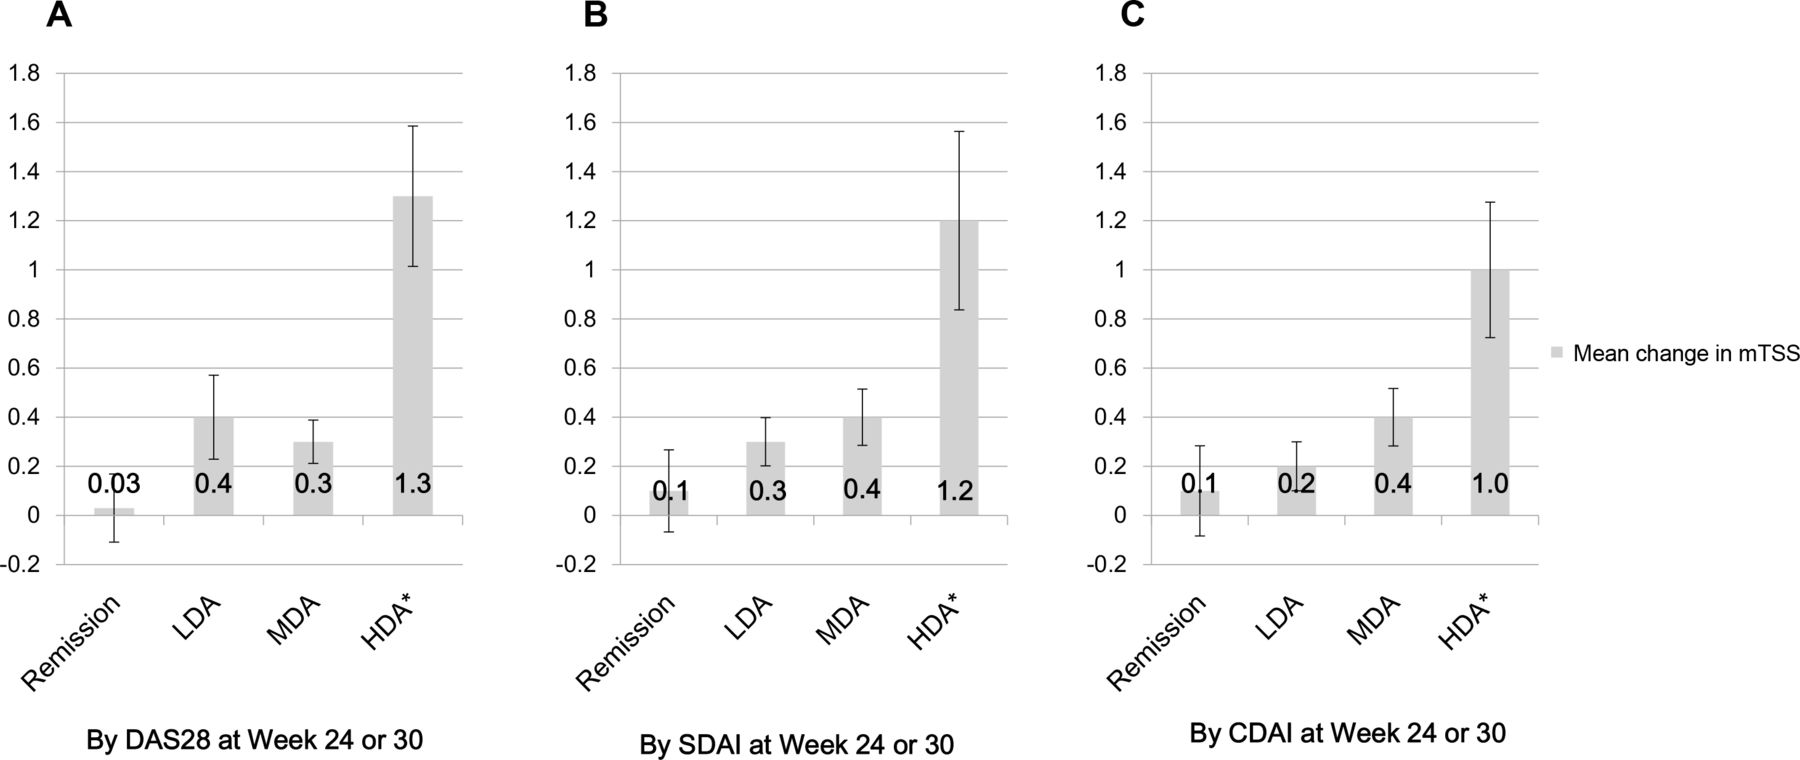
The following results are based on disease activity status at week 24/30. In all treatments combined, 1-year mean radiographic progression was highest among patients in the HDA group and lowest among patients in the remission group, based on DAS28 (ESR), SDAI and CDAI (figure 1A–C). The 1-year mean±SD change in mTSS was 0.03±2.1 in the remission group, 0.4±2.2 in the LDA group, 0.3±2.2 in the MDA group and 1.3±4.4 in the HDA group, based on DAS28 (ESR), with similar results based on SDAI or CDAI (each, p<0.05 by ANOVA with linear trend). The estimated difference of the 1-year mean change in mTSS in reference to remission, as determined by DAS28 (ESR), was significantly larger in the HDA group (1.3 (95% CI 0.7 to 1.8); p<0.0001) than the MDA group (0.2 (95% CI −0.3 to 0.7); p=0.5047) or LDA group (0.4 (95% CI −0.3 to 1.0); p=0.4455).

One-year radiographic progression in mean change in mTSS based on DAS28 (per erythrocyte sedimentation rate), SDAI scores and CDAI scores at week 24/30. CDAI, Clinical Disease Activity Index; DAS28, disease activity score based on 28-joint count; HDA, high disease activity; LDA, low disease activity; MDA, moderate disease activity; mTSS, modified Total Sharp Score; SDAI, Simplified Disease Activity Index. *Estimated difference in reference to remission with p<0.05.
The corresponding proportions of radiographic non-progressors were 79.8% (182/228) in the remission group, 78.1% (125/160) in the LDA group, 74.1% (473/638) in the MDA group and 58.4% (139/238) in the HDA group, based on DAS28 (ESR), with similar results observed based on SDAI and CDAI (figure 2A–C). The number of patients in each disease activity measure was highest in the MDA group by DAS28, SDAI and CDAI at both weeks 12/14 and 24/30. The number in the remission group increased whereas the number in the HDA group decreased from week 12/14 to week 24/30 (online supplementary table 2).

Proportion of radiographic progressors and non-progressors based on DAS28 (per erythrocyte sedimentation rate), SDAI scores and CDAI scores at week 24/30. CDAI, Clinical Disease Activity Index; DAS28, disease activity score based on 28-joint count; HDA, high disease activity; LDA, low disease activity; MDA, moderate disease activity; SDAI, Simplified Disease Activity Index.
The proportion of patients with no rapid radiographic progression (change in mTSS at 1 year ≤5) at 1 year was higher (96.1%, 1215/1264) compared with the proportion of patients (83.9%, 1060/1264) with change in mTSS at 1 year ≤1. When stratified by baseline mTSS score ≤5 or>5, the proportion of patients with no rapid radiographic progression tended to increase with lower baseline mTSS score and with better disease activity status by DAS28 at week 24/30 (online supplementary table 3). Mean change in mTSS at 1 year, when stratified by baseline mTSS score, was higher with greater baseline mTSS score (>5) compared with the lower baseline mTSS score (≤5) (online supplementary table 3).
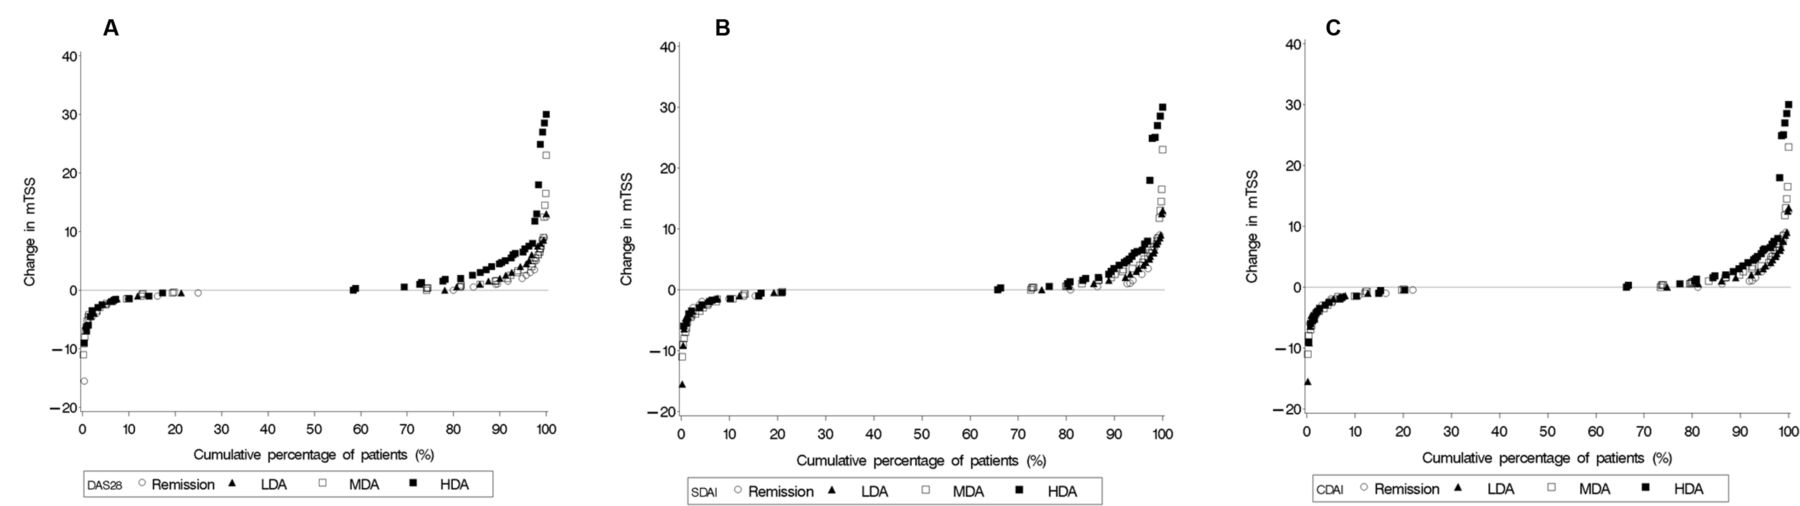
When evaluating 1-year radiographic progression based on DAS28 (ESR) at week 24/30 and in reference to remission, in all treatments combined, the OR (95% CI) of the proportion of radiographic non-progressors was lowest in the HDA group (0.35 (0.23 to 0.54); p<0.0001), followed by the MDA (0.72 (0.50 to 1.05); p=0.0860) and LDA (0.90 (0.55 to 1.48); p=0.6851) groups (figure 3A). Similar results were obtained based on DAS28 at week 12/14 in all treatments combined group (figure 3B). Results in different combinations of treatment groups were generally consistent based on DAS28 at week 24/30 (online supplementary figure 1A) and at week 12/14 (online supplementary figure 1B) with those described above for all treatments combined group. Cumulative probability plots of 1-year radiographic progression showed that many patients in the MDA and HDA groups by DAS28, SDAI and CDAI still had a high progression rate (figure 4A–C).
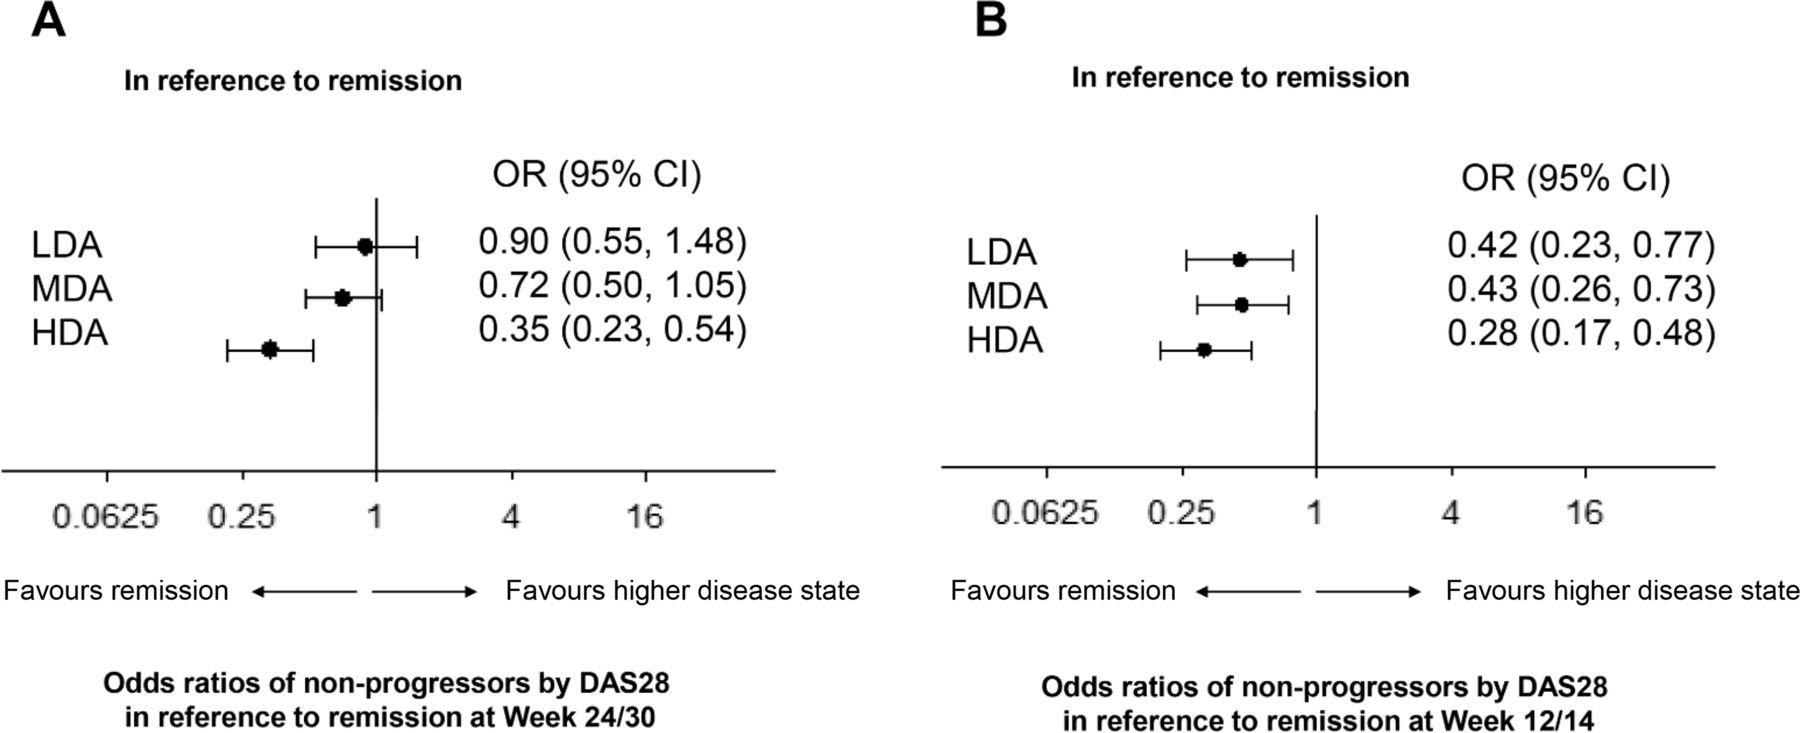
ORs of radiographic non-progressors in reference to remission by disease activity score based on 28-joint count (per erythrocyte sedimentation rate) at (A) week 24/30 and (B) week 12/14 in all treatments combined group. DAS, disease activity score; HDA, high disease activity; LDA, low disease activity; MDA, moderate disease activity.

Cumulative probability plot of 1-year radiographic progression based on (A) DAS using 28-joint count (per erythrocyte sedimentation rate), (B) SDAI scores and (C) CDAI scores. CDAI, Clinical Disease Activity Index; DAS, disease activity score; HDA, high disease activity; LDA, low disease activity; MDA, moderate disease activity; mTSS, modified Total Sharp Score; SDAI, Simplified Disease Activity Index.
In terms of the OR (95% CI) of the proportion of radiographic non-progressors, the similar trend was shown for SDAI and CDAI at week 24/30 (supplementary figure 2A) and at week 12/14 (online supplementary figure 2B); although for SDAI and CDAI, the OR was significant when comparing both HDA and MDA with remission at week 12/14 and week 24/30, not HDA alone as based on DAS28 at week 24/30.
As an exploratory analysis, HAQ-DI, PhGA, PGA scores at week 52/54 were obtained according to the disease activity status at week 24/30 and scores increased as disease activity worsened (online supplementary table 4).
Discussion
This pooled analysis demonstrated that disease activity correlates with radiographic progression even in anti-TNF-treated patients. These observations were evident regardless of how disease activity was evaluated (DAS28 (ESR), SDAI or CDAI) and across the multiple treatment groups that were assessed.
In general, it has been reported that treatment with TNF inhibitors or other bDMARDs inhibits the progression of joint damage.10–18 The results of our study show that even with TNF inhibitor therapy, the progression of joint damage is only arrested when patients achieve remission. Consistent with the treat-to-target recommendations,5 6 44 our findings suggest that LDA is, indeed, closely related to remission since progression of joint damage was not significantly different in patients with LDA versus those in remission, whereas significantly greater progression was observed in patients with MDA or HDA after 6 months of TNF inhibitor therapy. In CDAI and SDAI remission, progression rates were significantly lower compared with MDA and HDA, supporting the stringency of this remission cut-point.45
Thus, our findings support the importance of a treat-to-target approach; that is, when the treatment target of LDA (especially when using CDAI or SDAI) is not met between weeks 12 and 24, advancing to the next line of therapy is recommended.4–6 44
Increased disease activity at baseline is also associated with disease activity at 6 months and radiographic progression. This was shown by the ASPIRE, OPTIMA and PREMIER post hoc analysis, which revealed that baseline disease activity by composite measures was the strongest predictor of insufficient response to MTX and radiographic progression at 6 months as well as at 1 year.10 46 47 Taken together with our results, it is suggested that a significant portion of the progression occurs in the first few months, and baseline disease activity plays a role in clinical and radiographic response.
An exploratory analysis showed that disease activity is associated with radiographic progression and with patient functional outcomes and PhGA. This again confirms the importance of treat-to-target approach.
At the individual level, some patients may still have large extents of progression, up to 30 mTSS points in HDA. This finding has also been seen in other studies with bDMARDs examining the association of radiographic progression and disease activity states. Patients with HDA levels had less radiographic progression if treated with TNF inhibitors compared with MTX alone.11 33–35
Our study has some limitations. First, there were differences between studies in disease duration and baseline mTSS. Baseline mTSS scores are known to correlate with radiographic progression,48 while disease duration has been observed to be associated with total radiographic score.49 However, since the populations were pooled, this allowed inclusion of a broader range of baseline data.
In terms of radiographic evaluation, X-rays of each study were read centrally. Originally, these studies were not designed to be combined, and the readers and centres differed by product. However, X-rays were all read by qualified readers, and obtaining the mean from these two qualified readers reduces some of the inter-reader variability between the studies. Indeed, the fact that progression was low across all types of TNF inhibitors is in line with the low progression seen in the previously studies of each originator product11 34 35 37 and further supports the validity of the presents results.
Differences in radiographic progression by product or between biosimilars and reference products were not explored, but there were similar progression rates for reference products and biosimilars in all originating studies.21–23 Additional limitations that may confound interpretation of our findings include the lack of a placebo group. Although the overall study designs and baseline patient characteristics were similar across the three phase III clinical trials, they were not designed with a combined analysis in mind.
In conclusion, our pooled radiographic assessment data from three different phase III TNF inhibitor clinical trials of biosimilar versus reference products showed that radiographic progression is minimal overall but increases as disease activity worsens, despite using TNF inhibitors. Thus, in line with the treat-to-target recommendations, MDA or HDA are unacceptable states when treating patients with TNF inhibitors, even from the standpoint of radiographic progression of joint damage.
Acknowledgments
Medical writing assistance was provided by C4 MedSolutions, LLC (Yardley, Pennsylvania), a CHC Group company, and was funded by Samsung Bioepis Co, Ltd.
References
Footnotes
Funding This work was supported by Samsung Bioepis Co, Ltd.
Competing interests JSS has received personal remuneration from AbbVie, Amgen, Astra-Zeneca, Astro, Bristol-Myers Squibb, Celgene, Celltrion, ILTOO, Janssen, Lilly, MSD, Novartis-Sandoz, Novo-Nordisk, Pfizer, Roche, Samsung, Sanofi and UCB and research funding from AbbVie, Janssen, Lilly, Novartis-Sandoz, Pfizer and Roche. MEW has received research funding from Bristol-Myers Squibb, Crescendo Bioscience and Sanofi/Regeneron; has served as a consultant and/or advisory board member for AbbVie, Amgen, Bristol-Myers Squibb, Crescendo Bioscience, Corrona, GSK, Gilead, Lilly, Lycera, Merck, Novartis, Pfizer, Roche, Samsung Bioepis and Set Point; and has financial interests/stock ownership in Lycera, Canfite, Scipher and Vorso. PE has been a clinical trials investigator and advisor to Pfizer, MSD, AbbVie, Bristol-Myers Squibb, UCB, Roche, Novartis, Samsung, Sandoz and Lilly and has received consulting fees from Bristol-Myers Squibb, AbbVie, Gilead, Pfizer, MSD, Novartis, Roche and UCB; his employer has received research grants from AbbVie, Bristol-Myers Squibb, Pfizer, MSD and Roche. EK has received research funding from AbbVie, Amgen, Lilly, Gilead, Pfizer, PuraPharm, Sanofi and Merck; has served as a consultant and/or advisory board member for AbbVie, Amgen, AstraZeneca, Bristol-Myers Squibb, Celltrion, Crescendo Bioscience, Roche, Genentech, Gilead, Janssen, Lilly, Merck, Pfizer, Sandoz, Sanofi and Samsung Bioepis; and has received speaker honoraria for Amgen, AbbVie, Bristol-Myers Squibb, Roche, Janssen, Merck, Pfizer, Sanofi and UCB. MCG has received research funding from AbbVie; has received consulting fees from Samsung Bioepis, Merck, Abbvie, Amgen and FKB. GM, EH, IB and JG are employees of Samsung Bioepis.
Patient consent for publication Not required.
Provenance and peer review Not commissioned; externally peer reviewed.
Data availability statement Upon request, and subject to certain criteria, conditions and exceptions, Samsung Bioepis will provide access to individual deidentified participant data. The deidentified participant data will be made available to researchers whose proposals meet the research criteria and other conditions and for which an exception does not apply. To gain access, data requestors who intend to obtain data should send the proposals to the corresponding author. To gain access, data requestors must enter into a data access agreement with Samsung Bioepis.