Article Text

Abstract
Objectives To evaluate the sensitivity to change of ultrasound structural gout lesions, as defined by the Outcome Measures in Rheumatology (OMERACT) ultrasound group, in patients with gout during urate-lowering therapy (ULT).
Methods Ultrasound (28 joints, 26 tendons) was performed in patients with microscopically verified gout initiating or increasing ULT and repeated after 3 and 6 months. Joints and tendons were evaluated by ultrasound for presence of the OMERACT structural gout lesions—double contour sign (DC), tophus, aggregates and erosion—scored binarily. A sum score was calculated at patient and lesion level. Changes at 3 and 6 months in patient sum scores and lesion scores at different locations were evaluated.
Results 50 patients (48 men), mean age 68.9 (range, 30–88) years, were included. Ultrasound showed a statistically significant decrease in DC and tophus sum scores from 0 months (3.16 and 2.68, respectively) to 3 months (2.33 and 2.43) and 6 months (1.34 and 1.83) (all p<0.002). The aggregate sum score only decreased significantly from 3 to 6 months (6.02 to 5.02, p=0.002), whereas erosion sum score remained almost unchanged. All four structural lesions were most commonly found in metatarsophalangeal (MTP) 1 joints (>1 lesions bilaterally), and furthermore MTP2–4 and knee joints were common sites especially for DC. Likewise, these regions were the locations with most pronounced changes in scores.
Conclusion Ultrasound assessment of the OMERACT structural gout lesions scored binarily seems to be a useful tool for monitoring urate depositions during ULT. Particularly DC and tophus showed sensitivity to change after only 3 months of treatment.
- ultrasound
- gout
- OMERACT
- double contour sign
- tophus
This is an open access article distributed in accordance with the Creative Commons Attribution Non Commercial (CC BY-NC 4.0) license, which permits others to distribute, remix, adapt, build upon this work non-commercially, and license their derivative works on different terms, provided the original work is properly cited, appropriate credit is given, any changes made indicated, and the use is non-commercial. See: http://creativecommons.org/licenses/by-nc/4.0/.
Statistics from Altmetric.com
Key messages
Gout lesions can be visualised by ultrasound.
The consensus-based and validated OMERACT ultrasound structural gout lesions show sensitivity to change.
The double contour sign and tophus show statistically significant decreases during urate-lowering therapy—as early as after 3 months of treatment.
Ultrasound is a promising tool for monitoring urate crystal deposits in patients during urate-lowering therapy in clinical trials and in practice.
Introduction
Gout is the most common inflammatory joint disease in Western developed countries.1 If treated properly, gout flares can be prevented, joint damage related to tophi formation can be minimised, further crystal formation can be prevented and existing crystal deposits can be dissolved.1 If poorly controlled, gout may lead to renal failure, cardiovascular disease, increased morbidity and mortality and poorer quality of life.2 3 Therefore, appropriate management of gout is essential.
Monitoring of patients with gout has traditionally been based on clinical assessment combined with p-urate levels. Studies indicate that ultrasound is a useful tool when diagnosing gout,4–7 but little is known about its ability to monitor treatment effect.
Monosodium urate crystals reflect ultrasound beams more strongly than surrounding tissues such as unmineralised hyaline cartilage or synovial tissue. Crystalline material can therefore be detected by ultrasound as a bright, hyperechoic signal independent of the insonation angle. Furthermore, ultrasound can visualise potential concomitant inflammatory aspects of gout such as synovitis and tenosynovitis. In 2015, the Outcome Measures in Rheumatology (OMERACT) Ultrasound Working Group developed definitions of structural lesions in gout.8 These included double contour sign (deposits of crystals on the surface of cartilage), tophus (larger hyperechoic collection of crystals), aggregates (small hyperechoic crystal deposits) and erosion (cortical damage),8 and the visualisation of double contour sign (DC) in joints has been included in the newest gout classification criteria.9 A few small studies have evaluated the sensitivity to change of ultrasound visualised urate deposits before validated definitions of lesions existed10–12 and two recent studies have evaluated decreases in DC and tophus—as defined by the OMERACT group—during urate-lowering therapy (ULT).13 14 However, a systematic follow-up evaluating the sensitivity to change for all four structural lesions has not yet been performed in patients receiving ULT.
The primary aim of this study was to evaluate sensitivity to change of both ultrasound structural gout lesions and inflammatory changes in patients during ULT using the OMERACT Ultrasound Working Group 2015 definitions for gout lesions. The secondary aim was to assess potential correlations between changes in clinical, laboratory and ultrasound variables.
Patients and methods
Patients
The study was a 6-month prospective, observational study performed at Rigshospitalet, Glostrup, Denmark. Eligible for inclusion were adult patients (≥18 years) with microscopically verified gout who initiated or increased ULT (allopurinol, benzbromarone or febuxostat). For the latter group, crystal deposits at time of intensification served as their baseline values. Patients were excluded if they had received recent (<6 weeks) glucocorticoid (GC) injection or oral intake of GC, or if ultrasound did not show signs of urate crystal deposits.
Comprehensive examinations including clinical, laboratory and ultrasound assessments besides patient-reported outcomes (PROs) were performed at baseline and after 3 and 6 months.
Clinical and laboratory assessments
Clinical and medical history including comorbidity, smoking history and alcohol consumption were obtained at baseline. Disease duration (time since first gout attack) and the joint and tendon regions ever involved in gout attacks were recorded.
Clinical joint examination was performed at all visits. Thirty joints were evaluated bilaterally in the clinical joint examination including all small joints at both hands and feet (distal and proximal interphalangeal joints at both hands and feet, metacarpophalangeal (MCP) and metatarsophalangeal (MTP) joints) and larger joints (wrist, elbow, tarsometatarsal, tibiotalar and knee joints). Clinical joint examination was at all visits performed by an independent assessor blinded to the ultrasound findings.
Routine laboratory tests including p-urate level and C reactive protein (CRP) were performed at all visits.
Patient-reported outcomes
PROs regarding pain (visual analogue scale (VAS)) and physical function (Health Assessment Questionnaire (HAQ)) were obtained at all visits as were numbers of gout attacks within the last 4 and 12 weeks.
Patient and public involvement was not included in this study.
Ultrasound examination
All ultrasound examinations were performed using a GE Logiq E9 (Milwaukee, Wisconsin, USA) machine and ML6-15 MHz linear array transducer. Doppler settings were adjusted to slow flow according to published recommendations.15
The ultrasound examination of patients 1–10 were evaluated by two ultrasonographers in collaboration (SNC+LT) to establish consensus about structural gout lesions. The rest of the ultrasound examinations (patients 11–50) were performed by one sonographer (SNC). Intra-reader and inter-reader reliability were tested by evaluating still images on 10 patients (280 joints and 260 tendons) among patients 11–50 (440 sites for greyscale (GS) synovial hypertrophy and colour Doppler (CD) activity, 540 sites for aggregates and tophi and 280 sites for erosions and DC).
All patients were examined bilaterally by ultrasound evaluating joints (MCP1–5, wrist, elbow, MTP1–5, tibiotalar and knee), tendons (extensors of the wrist—scored as individual compartments 1–6, peroneus—longus and brevis scored as one—and tibialis posterior) and tendon insertions (triceps, quadriceps, patella—proximal and distal—and Achilles). All regions were evaluated by standard positions16 covering all parts of the joints and tendons by sweeping the regions. The four structural OMERACT gout lesions8—DC, tophus, aggregates and erosion—were scored separately using a binary scoring system (present/absent). In addition, synovial hypertrophy was graded semiquantitatively by GS and hyperaemia by CD according to the OMERACT scoring system.17 The tendons around the wrist and ankle—extensors of the wrist, peroneus and tibialis posterior scanned bilaterally—were also evaluated for tenosynovitis (GS and CD) using the OMERACT tenosynovitis scoring system.18 Synovitis and tenosynovitis were defined as a GS score ≥1 with or without CD score ≥1.19
For each patient, sum scores of structural ultrasound lesions were calculated as a sum of each individual lesion across all scanned sites. A crystal sum score was calculated for each patient by adding tophus, DC and aggregate sum scores. Furthermore, GS synovial hypertrophy sum scores and CD activity sum scores were calculated by adding scores from all joints and tendon sheaths (range, 0–132).
The duration of the ultrasound examination was approximately 60 min per visit.
Statistical analysis
Descriptive statistics were used to summarise the baseline data. Patients’ baseline characteristics were presented as means with SD for normally distributed variables and as medians with ranges and IQRs for non-normally distributed variables.
The inter-observer and intra-observer reliability of scoring images were assessed according to kappa (κ) statistics on static images. Intra-observer coefficients were evaluated on pairs of measures performed by the same sonographer at each site on static images. Kappa values of 0–0.20 were considered poor; 0.20–0.40, fair; 0.40–0.60, moderate; 0.60–0.80, good; and 0.80–1, excellent, as proposed by Landis and Koch.20
Changes in both clinical, laboratory and ultrasound findings were presented as means and medians with ranges and IQRs. Changes over time in quantitative results within groups were analysed using Wilcoxon signed-rank test.
Correlation analyses were performed using Spearman’s rank-order correlation assessing individual relations between changes in biochemical (most importantly p-urate), clinical and ultrasound findings.
No data imputation was used. P values <0.05 were considered statistically significant. All statistical analyses were performed based on a statistical analysis plan and analysed using SAS Enterprise Guide V.7.15.
Results
A total of 50 patients were included in the study, and of these 46 (92%) completed 3 months’ follow-up and 41 (82%) 6 months’ follow-up. Baseline characteristics of the cohort are shown in table 1.
Demographic and baseline characteristics (n=50)
Baseline characteristics, except for body mass index (BMI), did not differ statistically significantly between patients completing versus not completing the 6 months’ follow-up (all p values >0.05, data not shown). The BMI was higher in the drop-out group compared with the completing group (mean BMI 32.5 vs 27.8, p=0.02).
Reliability
Inter-reader and intra-reader reliabilities were excellent for both DC (κ 0.81 and 0.95, respectively) and tophus (κ 0.81 and 0.91, respectively). The inter-reader reliability was good for aggregates (κ 0.71), erosion (κ 0.68) and CD activity (κ 0.72), whereas the intra-reader reliability for these findings were excellent (κ 0.84, 0.83 and 0.92, respectively). For GS synovial hypertrophy, both inter-reader and intra-reader reliability was good (κ 0.75 and 0.79, respectively).
Sensitivity to change
The data for clinical and laboratory assessment, the PROs and the ultrasound findings at baseline, 3 months’ and 6 months’ follow-up are summarised in table 2.
Course of ultrasound, laboratory and clinical parameters during the 6 months’ follow-up period
Laboratory and clinical parameters
P-urate and CRP both showed a statistically significant decrease at 6 months’ follow-up (table 2). Mean p-urate decreased from 0.49 mmol/L at baseline to 0.36 mmol/L at 3 months’ follow-up and 0.33 mmol/L at 6 months’ follow-up (p<0.001). A p-urate level <0.36 mmol/L was obtained by 24/46 (52%) at 3 months’ follow-up and 32/41 (78%) at 6 months’ follow-up.
The clinical parameters including numbers of affected joints, numbers of gout attacks and patients’ VAS pain decreased statistically significantly from baseline to follow-up at 3 and 6 months and, furthermore, VAS pain—as the only parameter of these—showed a continuous decrease from 3 to 6 months’ follow-up (table 2). HAQ showed only a numerical decrease during follow-up. Figure 1A summarises the course of clinical parameters and PROs during follow-up.
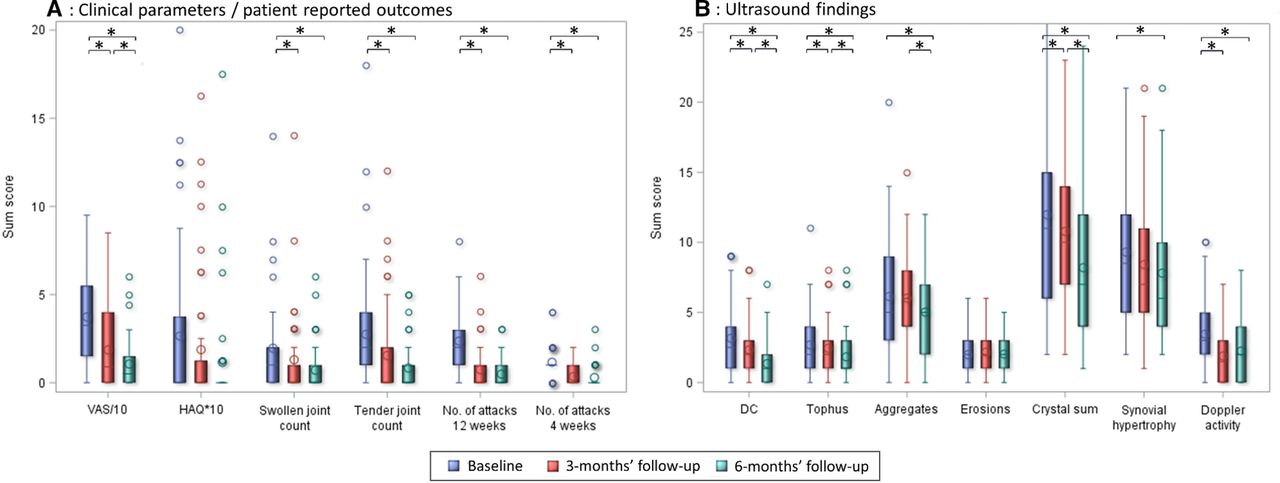
Course of clinical parameters including patient-reported outcomes (A) and ultrasound findings (B) during the 6 months’ follow-up period. Box plot explanation: 75th percentile, upper edge of box; 25th percentile, lower edge of box; median, line inside box; mean, circle inside box. *Wilcoxon signed-rank test showing p values <0.05. DC, double contour sign; HAQ, Health Assessment Questionnaire; VAS, visual analogue scale pain.
Ultrasound parameters
The course of both structural (DC, tophus, aggregates and erosion) and inflammatory (GS synovial hypertrophy and CD activity in joints and tendon sheaths) ultrasound findings during follow-up are shown in table 2 and figure 1B.
Structural lesions
The DC and tophi sum scores decreased statistically significantly from 0 to 3 and from 3 to 6 months’ follow-up, whereas the decreased in aggregate sum score only occurred late in the follow-up (3–6 months). The summarised crystal score—DC, tophi and aggregates added—decreased statistically significant from both 0–3 and 3–6 months’ follow-up. The erosion sum score did not change significantly during follow-up. Figure 2 shows examples of the changes in DC and tophi in patients during follow-up.
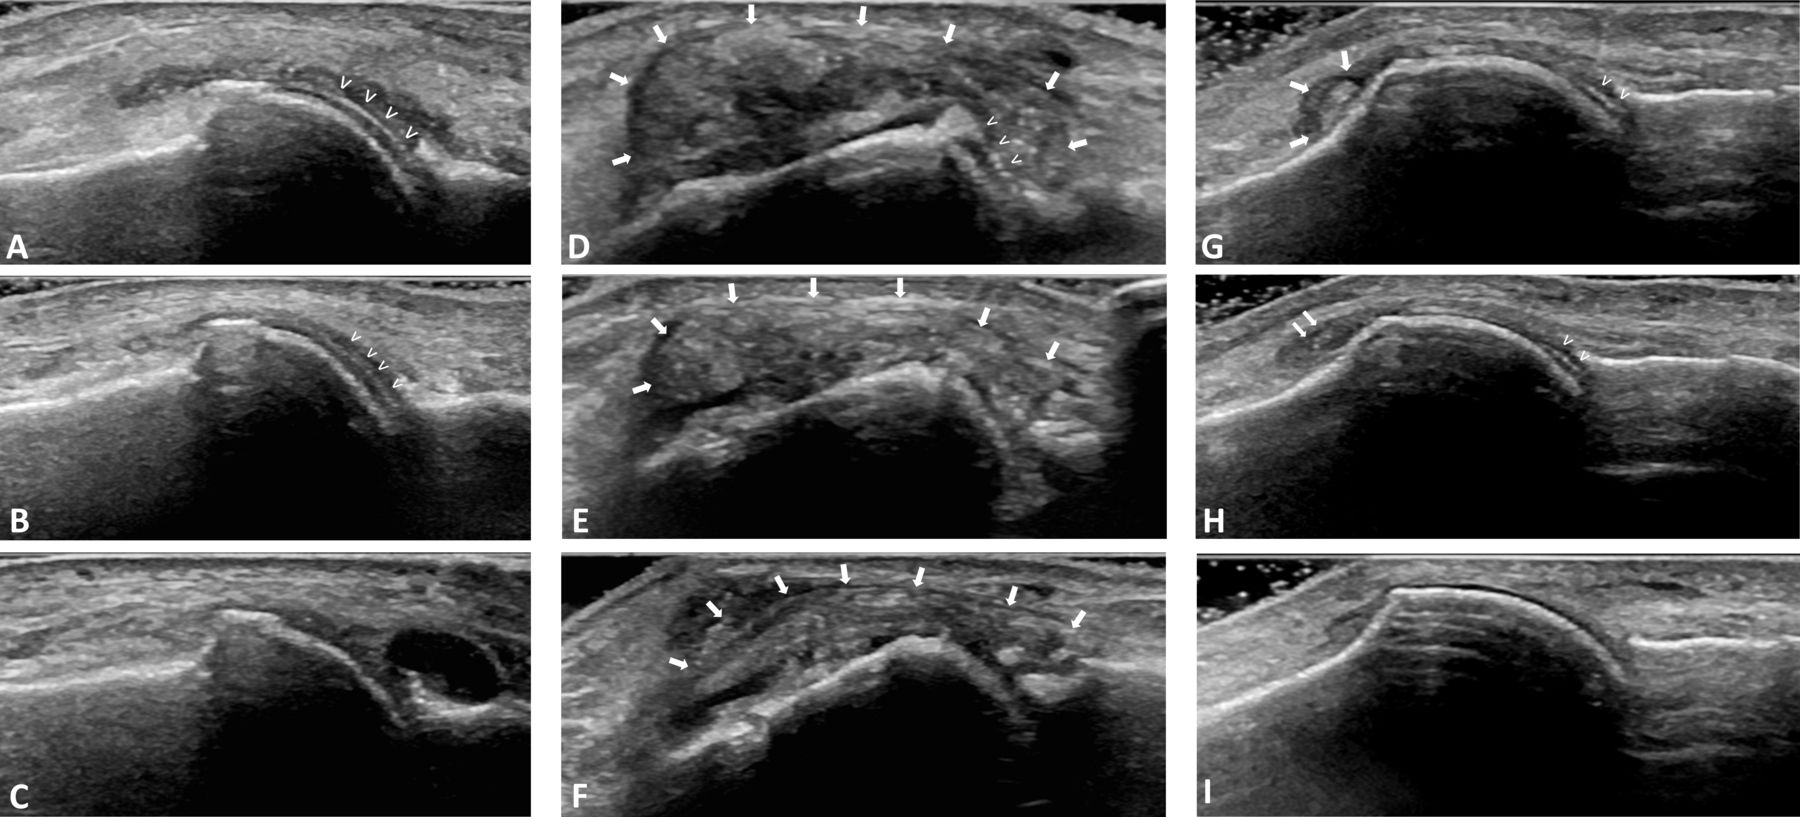
Sequential ultrasound investigations in patients during urate-lowering therapy. Left column (A–C): ultrasound of the first metatarsophalangeal joint. Longitudinal dorsal view. Ultrasound shows regression of double contour sign (arrowheads) when observed from baseline (A) to 3 (B) and 6 (C) months’ follow-up. Mid column (E–F): ultrasound of the first metatarsophalangeal joint. Longitudinal medial view. Ultrasound shows reduced tophus size (arrows) from baseline (D) to 3 months’ (E) and 6 months’ (F) follow-up. A double contour sign is observed at baseline (D, arrowheads), but is no longer visible at 3 and 6 months’ follow-up (E–F). Right column (G–I): ultrasound of the first metatarsophalangeal joint. Longitudinal dorsal view. Ultrasound shows reduction in urate deposits from baseline (G), where deposits are seen as a small tophus (large arrows), to 3 months’ follow-up (H), where deposits are reduced to aggregates (small arrows). In addition, a double contour sign is observed at both baseline and 3 months’ follow-up (arrowheads). At 6 months’ follow-up (I), no urate deposits can be observed in the joint.
Inflammatory lesions
GS synovial hypertrophy and CD activity (in joint and tendon sheaths) both decreased statistically significantly at 6 months’ follow-up; CD activity already at 3 months’ follow-up.
Distribution of lesions
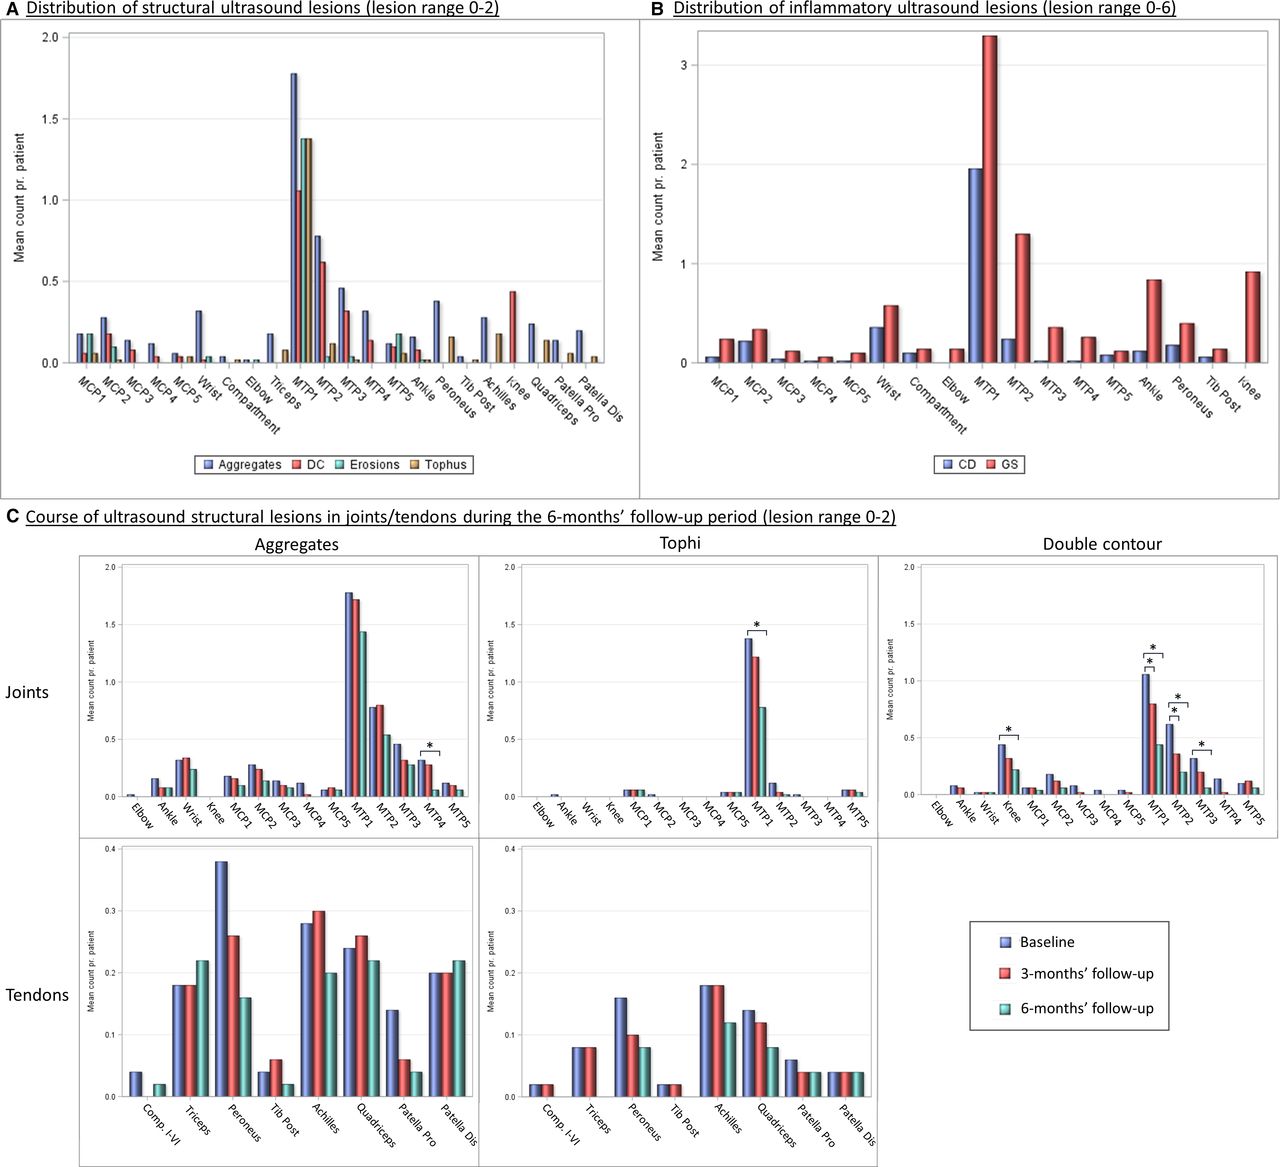
The distribution of structural and inflammatory ultrasound lesions in joints and tendons are shown in figure 3A,B.

Distribution and course of ultrasound lesions in patients with gout during the 6 months’ follow-up period. Bilateral assessment of joint and tendon sites. Within-group changes over time were analysed using Wilcoxon signed-rank test. *p<0.05. CD, colour Doppler activity; Comp. I–VI, compartments I–VI; DC, double contour sign; GS, greyscale synovial hypertrophy; MCP, metacarpophalangeal joint; MTP, metatarsophalangeal joint; Patella Dis, distal patella insertion; Patella Pro, proximal patella insertion; Tib Post, tibialis posterior tendon.
The MTP1 joints were the most common location for all four structural lesions and for both inflammatory lesions. Patients had on average 1.1 DCs and 1.4 tophi bilaterally in MTP1 joints. The second most affected joints were the MTP2 joints, where aggregates and DC were common while tophus formation less frequent, and for inflammatory lesions primarily GS synovial hypertrophy was observed. For MTP3–5 and MCP joints, involvement was less common, and if affected, urate deposits were mostly seen as aggregates. Tophus formations in these joints were almost solely found in MCP1 and MTP5 joints. The knee joints were common sites for DC.
As to the tendons, the most common sites for urate deposits were the peroneus tendons and the Achilles, quadriceps and patella (both proximal and distal) tendon insertions. Tenosynovitis was most commonly found in the peroneus tendons.
Changes in structural lesions at different locations during follow-up
Figure 3C shows the course of the structural lesions in joints and tendons. At joint level, statistically significant decreases in urate deposits were found at MTP1s for tophus formation, MTP1–3s and knees for DC formation, and MTP4s for aggregates. In tendons, a trend for a decrease in tophus formation during follow-up was observed—less pronounced for aggregates—but no statistically significant changes were observed.
Correlation between clinical, laboratory and ultrasonographic findings
The individual correlations between the course of different variables were investigated (see online supplementary table 1). In general, no strong correlations were found between the individual changes in any clinical, laboratory and ultrasound findings (r<0.50)—except between parameters which were directly related (eg, crystal sum score and its components). Weak, positive correlations were found between changes in p-urate and changes in both DC and the combined ultrasound ‘crystal sum score’ (r=0.430 and r=0.369, respectively, p≤0.02) as the only two parameters. Correlations between other investigated parameters were non-existing or weak (see online supplementary table 1).
Supplemental material
Discussion
This study evaluates the sensitivity to change of all four consensus-based and validated OMERACT ultrasound structural gout lesions. DC and tophus showed statistically significant decreases during ULT—as early as after 3 months of treatment. This indicates that these ultrasound measures of urate deposition are sensitive to change as a response to even a short-term use of ULT using the applied binary scoring system; thus, ultrasound for monitoring urate deposits during therapy is a promising tool in both clinical trials and in practice. Furthermore, ultrasound signs of inflammation decreased significantly at 6 months’ follow-up, supporting the ability of ultrasound for objective and sensitive monitoring of synovitis and tenosynovitis in gout.
The disappearance of tophi and DC as a response to ULT as seen in our study is in line with previous studies. Small cohort studies10–13 and one recent larger cohort study14 showed disappearance of DC10 11 13 14 and decrease in tophus size visualised by ultrasound12–14 in response to ULT. Also in line with our study, an improvement in clinical parameters and synovial Doppler signal was seen in parallel with dissolution of urate deposits.13 21 Previous studies have noted that it seems easier to clear the cartilage deposits than the tophi,11 13 although tophi have shown responsiveness when assessed by size after only 3 months of treatment.14 This appears also to be the case in our study since a more pronounced decrease in mean DC sum scores was observed compared with mean tophus sum scores. The fact that tophus sum score in this study decreased statistically significantly after only 3 months of therapy even when scored binarily was probably due to the large number of scanned sites—making significant results more likely to occur. As exemplified by figure 2, small tophi dissolved within the first 3 months, whereas larger tophi showed a tendency to only decrease in size as a response to the 6 months of ULT.
In our study, aggregates showed a statistically significant decrease during follow-up, but the decrease occurred later and appeared less pronounced compared with DC. The course of aggregates in patients receiving ULT can be unpredictable since tophi potentially could dissolve into aggregates in the process of disappearing (as exemplified in figure 2). Thus, even though aggregates resolve during therapy, others may be formed. Previous studies with focus on diagnostic features of ultrasound in gout4–7 have only established high specificities for DC and tophus, and the role of aggregates in the evaluation of gout patients is yet to be clarified.
The large number of scanned joints and tendons in our study allowed us to establish both the locations most commonly affected by gout and if all lesions seemed to respond equally well to ULT. Structural ultrasound lesions were by far most commonly found in MTP1 joints, where patients on average had >1 of all four structural lesions. MTP2–4s, knee joints and several lower extremity tendon regions were also commonly affected. The locations most commonly affected by urate depositions were also the locations most responsive to treatment. Upper extremities urate depositions in joints and tendons were observed, but to a much lower extent compared with lower extremity involvement, which is in accordance with previous studies.22–24
A significant correlation between changes in the structural lesions DC and crystal sum scores and changes in p-urate was found in our study, whereas p-urate changes did not correlate to either changes in tophi or aggregates sum scores. This concurs with previous studies5 13 25 also finding DC but not tophi to be correlated to p-urate levels. The lacking correlation between changes in tophi sum scores and p-urate may be explained by tophi representing larger collections of urate deposits and therefore dissolving slowly compared with DC. A more responsive assessment of crystal changes such as a semiquantitative score or a continuous measure of tophus size may potentially show a positive correlation with p-urate levels as observed in previous studies.12 14
Our data revealed significant improvements in both ultrasound, clinical and biochemical signs of inflammation during follow-up. GS synovial hypertrophy and CD activity in both joints and tendon sheaths decreased during treatment indicating a rapid fall in inflammatory activity, which is supported by a decrease in swollen and tender joint counts, improvement in PROs and a decrease in CRP. The fact that inflammatory markers and patient’s self-perceived symptoms decreased as ULT was intensified were probably related to adjuvant treatment with colchicine, which were given to all patients in this study in accordance with international guidelines.26 Otherwise, an increased rate in flares would have been expected since this is in general described when ULT is initiated alone.27
The strengths of our study is the large patient cohort compared with most previous performed studies (second largest patient population). Furthermore, lesions are scored based on well-established consensus-based definitions, optimising the reliability of the results and facilitating comparison to future studies. Finally, the scanned regions included numerous joints and tendons enabling us to evaluate the distribution of lesions.
Limitations of the study include the lack of a control group and that the operator was unblinded to the treatment of the patients. However, the operator was neither the person performing the clinical joint examination nor the person responsible for adjusting ULT. Another limitation was that ultrasound assessment was performed by only one operator. However, the inter-reader reliability between operators were found to be excellent for DC and tophus and good for the remaining lesions. These inter-reader reliabilities are—especially for DC and aggregates—considerably higher than shown in the initial validation study28; thus, our study indicates that intensive training and calibration between operators could improve the reliability of the scoring of lesions. Finally, the scoring of lesions was performed using a binary scoring system, and this limits the sensitivity to minor changes in lesions during follow-up. We chose to score lesions binarily since no consensus exists on a standardised way to score lesions either semiquantitatively or by measurements in a proven reproducible way.
The ultrasound examinations in our study were time consuming since multiple joints and tendons were scanned, and this would not be feasible in routine clinical practice. However, this extended examination was performed to help identifying predilection sites for structural gout lesions, and the study demonstrated that the areas most commonly affected were also the areas most responsive to treatment; thus, a reduced joint scan could potentially be used. This study was not designed to select proper areas for reduced joint/tendon set inclusion since this is preferably done in diagnostic settings in order to determine the minimum amount of sites to distinguish patients with gout from patients with no gout. However, the common involvement and rapid responsiveness to treatment of lesions in MTP1–3 and knee joints indicate that evaluation of these areas is presumably essential.
A potential benefit of using routine ultrasound examination in patients with gout in daily clinical practice could be as a motivational instrument for both the physician and the patient. The ability of ultrasound to visualise the disappearing of urate deposits over time could improve the motivation for both the physicians—to prescribe adequate treatment adjustments—and the patients—to increase treatment adherence. Both these aspects are compromised in many patients with gout.29–31
In conclusion, our observational study demonstrates that performing ultrasound for specific structural features of gout such as tophi and DC, defined as proposed by the OMERACT ultrasound working group, at the initiation of ULT and during follow-up seems to be a sensitive way to detect and monitor the dissolution of urate deposits. Future studies should address what sites should be included in a reduced joint/tendon set for evaluating gout lesions and whether more sensitive monitoring could be obtained by using a semiquantitative scoring system.
Acknowledgments
The Danish Rheumatism Association is acknowledged for financial support of the salary of SNC. Data from this study were presented as an oral presentation at the 2018 Annual European Congress of Rheumatology (EULAR) meeting (abstract no. EULAR18-2209).
References
Footnotes
Contributors SNC has made substantial contributions to study conception and design, acquisition of data, analysis and interpretation of data, drafting the article and final approval of the version of the article to be published. MØ has made a substantial contribution to study conception and design, analysis and interpretation of data, revising the article critically for important intellectual content and final approval of the version of the article to be published. OS and LT have made a substantial contribution to study conception and design, acquisition of data, analysis and interpretation of data, revising the article critically for important intellectual content and final approval of the version of the article to be published. HK, GB and MAD have made a substantial contribution to analysis and interpretation of data, revising the article critically for important intellectual content and final approval of the version of the article to be published.
Funding The authors have not declared a specific grant for this research from any funding agency in the public, commercial or not-for-profit sectors.
Competing interests SNC has received speaker fees from Bristol Myers Squibb (BMS) and General Electric (GE). LT has received speakers’ fees from AbbVie, MSD, Novartis, Roche, Pfizer, General Electric (GE), Bristol Myers Squibb (BMS) and Janssen. MØ has received research support and/or consultancy/speaker fees from Abbvie, BMS, Boehringer-Ingelheim, Celgene, Eli-Lilly, Centocor, GSK, Hospira, Janssen, Merck, Mundipharma, Novartis, Novo, Orion, Pfizer, Regeneron, Schering-Plough, Roche, Takeda, UCB and Wyeth.
Patient consent for publication Obtained.
Ethics approval The study was approved by the Danish ethical committee (H-16043367).
Provenance and peer review Not commissioned; externally peer reviewed.
Data availability statement All data relevant to the study are included in the article or uploaded as online supplementary information.