Article Text

Abstract
Objective Abatacept is a biological disease-modifying antirheumatic drug (DMARD) used for the treatment of rheumatoid arthritis (RA) and modulates the costimulatory signal by cluster of differentiation (CD)28:CD80/CD86 interaction required for T cell activation. Since CD28-mediated signalling regulates many T cell functions including cytokine production of, for example, interferons (IFNs), it is of interest to clarify, whether response to abatacept has an effect on the IFN inducible immunoproteasome, as a central regulator of the immune response.
Methods Effects of abatacept on the proteasome were investigated in 39 patients with RA over a period of 24 weeks. Using real-time PCR, transcript levels of constitutive and corresponding immunoproteasome catalytic subunits were investigated at baseline (T0), week 16 (T16) and week 24 (T24) in sorted blood cells. Proteasomal activity and induction of apoptosis after proteasome inhibition were also evaluated.
Results Abatacept achieved remission or low disease activity in 55% of patients at T16 and in 70% of patients at T24. By two-way analysis of variance (ANOVA), a significant reduction of proteasome immunosubunit β1i was shown only in CD4+ and CD8+ T cells of sustained responders at both T16 and T24. One-way ANOVA analysis for each response group confirmed the results and showed a significant reduction at T24 in CD4+ and CD8+ T cells of the same group. Abatacept did not influence chymotrypsin-like activity of proteasome and had no effect on induction of apoptosis under exposure to a proteasome inhibitor in vitro.
Conclusion The reduction of proteasome immunosubunit β1i in T cells of patients with RA with sustained response to abatacept suggests association of the immunoproteasome of T cells with RA disease activity.
- Abatacept
- Arthritis
- Rheumatoid
- T-Lymphocyte subsets
This is an open access article distributed in accordance with the Creative Commons Attribution Non Commercial (CC BY-NC 4.0) license, which permits others to distribute, remix, adapt, build upon this work non-commercially, and license their derivative works on different terms, provided the original work is properly cited, appropriate credit is given, any changes made indicated, and the use is non-commercial. See: http://creativecommons.org/licenses/by-nc/4.0/.
Statistics from Altmetric.com
INTRODUCTION
Rheumatoid arthritis (RA) is a chronic and systemic autoimmune disease characterised by synovial inflammation and progressive joint destruction.1 As known, activated T cells play a central role in the pathogenesis of RA.2 Full T cell activation requires at least two signals, the initial recognition of the T cell receptor to its antigen presented by major histocompatibility complex (MHC) on antigen-presenting cells (APCs), followed by a second costimulatory signal accomplished by the binding of cluster of differentiation (CD)80 and/or CD86 on the surface of APCs to the CD28 receptor on T cells.3 Shortly after activation, T cells express cytotoxic T-lymphocyte-associated protein 4 (CTLA-4), which binds to CD80 and CD86 with higher affinity and avidity than CD28 and transmits an inhibitory signal to suppress T cell activation, and thus functions as a negative regulator of T-cell-mediated immune responses.4
Abatacept is a therapeutic alternative for patients with RA refractory to conventional synthetic or biological disease-modifying antirheumatic drugs (cs-DMARDs or b-DMARDs).5 Abatacept (CTLA4-Ig—Orencia, Bristol Myers Squibb, New York, USA) is a recombinant bDMARD consisting of the extracellular domain of human CTLA4 and a fragment of the Fc portion of human IgG1 (hinge and CH2 and CH3 domains). It binds CD80/CD86 more strongly than CD28, thereby blocking interaction with CD28 and inhibiting T cell activation.6 Nevertheless, it is not yet clear why some patients do not respond to abatacept therapy or why others show a loss of response. In order to improve our therapeutic strategies in RA, it is of great importance to investigate the pathways behind these different outcomes.
Ubiquitin proteasome system (UPS) is a non-lysosomal, multicatalytic and multisubunit protease complex involved in the ubiquitin (Ub)-dependent and Ub-independent selective intracellular degradation of proteins and in the generation of peptides presented by the MHC class I receptor to the antigen receptors of cytotoxic T cells.7 UPS is a common regulatory modification system since cell proteins involved in the regulation of basic cellular processes, such as proliferation, differentiation, cell cycling and apoptosis, undergo processing and functional limitation by proteasome degradation.8 9 Proteasome complexes consist of a 20S catalytic core particle either alone or associated with one or two regulatory particles (RPs) that can be of identical or different protein composition. Four activators have been identified in mammals: 19S RP, PA28 (PA28αβ and PA28γ) and PA200.10 Enzymatically active proteasome, the 26S proteasome, is made up of a catalytic core particle 20S capped at one or both ends by 19S RPs. Hybrid proteasomes are formed when the 20S is capped with two different regulators, mainly 19S RP and PA28 (11S).The 20S proteasome is a hollow cylindrical particle consisting of four stacked heptametrical rings, two outer α-rings and two inner β-rings. The two β-rings each harbour three different constitutive subunits β1, β2 and β5, responsible for three main proteasome proteolytic activities such as caspase-like, trypsin-like and chymotrypsin-like, respectively.11
During immune response, interferon-γ (IFN-γ) partially or totally induces the substitution of the three constitutive subunits by their counterpart immunosubunits β1i, β2i and β5i, respectively, leading to the formation of the so-called immunoproteasome.12 Similarly, IFN-γ induces the synthesis of PA28 (11S) regulator (REG) which was identified as another protein activator of the latent 20S proteasome.13
During the last 20 years, our group has focused on the work regarding the involvement of the UPS in patients with rheumatic diseases with interesting novel findings.
Elevated levels of circulating proteasomes and autoantibodies against proteasomal subunits were detected in patients with autoimmune diseases including RA.14 15
Thus, we could confirm an upregulation of certain inducible catalytic subunits of proteasome as well as its immune activator PA28γ in patients with systemic autoimmune diseases including systemic lupus erythematosus, autoimmune myositis, Sjögren’s syndrome and RA.16–19 Furthermore, we found a correlation between PA28γ serum levels and disease activity in patients with RA under treatment with abatacept.20
Taken together, the proteasome is not only manifold linked to basic cellular functions including protein homoeostasis, cell cycle control and regulation of the immune system, but can be also involved in the pathogenesis of autoimmune and autoinflammatory diseases in humans. Since abatacept was also shown to modify the cytokine milieu including IFN-γ in patients with RA,21 this in vitro study will focus on the expression and function of the proteolytic core complex in patients undergoing abatacept treatment.
Patients
The study consisted of a 24-week open-label, non-interventional treatment of patients with diagnosed RA fulfiling the criteria for therapy with abatacept. Patients were treated as standard of care, receiving 500–1000 mg (body-weight-adjusted) abatacept intravenously at baseline (T0), week 2, week 4 and every 4 weeks or 125 mg subcutaneously every week. As comedications, all patients received methotrexate (MTX) with or without other synthetic DMARDs, glucocorticosteroids and/or non-steroidal anti-inflammatory drugs. The study was approved by the local ethics committee of the rheumatology and clinical immunology department at the Charité University Hospital in Berlin, and all patients gave informed consent prior to blood sample collection. At T0 and every 12 weeks, patients received routine clinic and blood examination. Additionally, at T0, at week 16 (T16) and at week 24 (T24), blood samples were taken to measure proteasome expression at the transcript level in vitro. As comparator groups, whole-blood transcriptome data of patients with RA from the open-access database Gene Expression Omnibus (http://www.ncbi.nlm.nih.gov/geo/) were investigated. The selection included RA responders treated with a first-line DMARD MTX (n=10), in addition to two responder groups treated with biological targeting tumour necrosis factor infliximab (IFX) (n=12) or interleukin 6 receptor tocilizumab (TCZ) (n=12); the transcriptomes were measured at multiple time points during 6 months of treatment (GSE93777).22
METHODS
Isolation of peripheral blood mononuclear cells (PBMCs) and cellular subsets
Peripheral blood mononuclear cells (PBMCs) from whole blood were separated through density gradient centrifugation using Ficoll separating solution with density of 1.077 g/mL (Biochrom, Berlin, Germany). For isolation of blood cell subsets, PBMCs were divided into two fractions. The first one was used for separation of dendritic cells (DCs) by magnetic cell sorting using Blood Dendritic Cell Isolation KitII (Miltenyi Biotec, Germany) and the second fraction was used for isolation of T lymphocytes (CD4+ and CD8+), B lymphocytes (CD19+) and monocytes (CD14+) by fluorescence-activated cell sorting (FACS).
For this purpose, PBMCs were incubated with allophycocyanin anti-CD3+ (clone HIT3a), PE-Cy5 anti-CD4+ (clone OKT4), PE-Cy7 anti-CD8+ (clone HIT8a), phycoerythrin anti-CD19+ (cloneHIB19) and fluorescein-isothiocyanate anti-CD14+ (clone M5E2) (all from BioLegend, Germany). In order to assess cell viability, 4ʹ, 6-diamidino-2-phenylindole (Applichem, Germany) was added to the cells. Gated CD3+ T lymphocytes were used to isolate D4+ and CD8+ T lymphocytes, while non-CD3+ cells were used to isolate CD19+ B lymphocytes and CD14+ monocytes. Cells were sorted by a FACSDiVa flow cytometer.
After sorting, collected cells were washed and two-thirds of cells were used for RNA isolation and lysed in cell lysis buffer (Macherey-Nagel, Düren, Germany) containing β-mercaptoethanol (Carl Roth, Germany), and the other third was used to estimate the proteolytic activity and apoptosis after proteasome inhibition.
Measurement of proteolytic activity and apoptosis after proteasome inhibition
Total PBMCs, CD4+ and CD8+ T lymphocytes were incubated (14 hours, 37°C, 5% CO2) with the proteasome inhibitor bortezomib at final concentrations of 5.0 and 50.0 nM in 50 µL medium (RPMI 1640 culture medium, 10% fetal calf serum (FCS)) (Biochrom). Cells without inhibitor served as negative controls.
For measurement of proteasome activity after inhibition with bortezomib, cells were lysed in 100 µL of 50 mM Tris HCL (pH 7.4), 150 mM NaCl, 5 mM MgCl2, 1 mM EDTA, 250 mM sucrose, 0.1% Triton X-100 and 1 mM DTT (all from Sigma, Germany) and incubated for 20 min on ice.
To estimate the remaining chymotrypsin-like activity of proteasome, lysates were incubated for 2 hours at 37°C with 100 μM fluorogenic substrate N-succinyl-Leu-Leu-Val-Tyr-AMC (7-amino-4-methylcoumarin) dissolved in assay buffer 25 mM HEPES (pH 7.4), 0.5 mM EDTA and 0.03% sodium dodecyl sulfate (SDS). The assay was done in duplicate in 96-well black plates (Greiner, Germany) and the released AMC was detected by fluorescence emission at 460 nm (excitation at 360 nm) using a Synergy HT microplate reader (Biotek, USA). For analysis, data were normalised based on activity from cell lysates without proteasome inhibitor, which was set as 100%.
Assessment of induction of apoptosis after proteasome inhibition was performed based on the activity of caspase-3 and caspase-7 by using the ApoOne Assay kit (Promega, Germany). For analysis, 50 µL ApoOne caspase 3/7 buffer containing 1% substrate were incubated with cells in duplicate for 2 hours at 37°C. Etoposide (100 µM, Biomol, Germany) was used as apoptosis control. Caspase activity was measured at Ex 485/Em 528 nm using Synergy HT microplate reader (Biotek). For analysis, data were normalised based on the caspase activity in cells without proteasome inhibitor, which was set as 1.00.
Investigation of proteasome expression in PBMCs and all sorted cells
RNA isolation and reverse transcription into cDNA
Isolation of RNA from blood cells was done by using NucleoSpin RNA/Protein kit (Macherey-Nagel). Quality and quantity of RNA were controlled using a NanoDrop 1000 spectrophotometer (Thermo Scientific, Germany). To synthesise first-strand complementary (cDNA) from total RNA, SuperScript III First-Strand Synthesis System for reverse transcriptase-polymerase chain reaction (RT-PCR) (Invitrogen, Karlsruhe, Germany) was used according to the instructions of the manufacturer. The cDNA was used as a template for the specific primers in real-time PCR.
Relative quantification of gene expression at the mRNA level
Real-time quantitative RT-PCR was used for relative quantification of gene expression of the proteasome system, including the three constitutive catalytic beta subunits β1, β2 and β5 and the corresponding immunosubunits β1i, β2i and β5i as well as the constitutive α3 subunit.
For relative quantification, primers were designed for three housekeeping genes (HKG), beta-actin (ACTB), glyceraldehyde-3-phosphate dehydrogenase (GAPDH) and hypoxanthine guanine phosphoribosyl transferase 1 (HPRT1). Primers for PCR were designed using the primer 3 software (Version 0.4.0, Whitehead Institute for Biomedical Research, Cambridge, Massachusetts, USA) as described elsewhere.23 SYBR Green PCR Master Mix (Applied Biosystems) was used in amplification reactions with 200 nM forward and reverse primers for each gene, in addition to the cDNA. Real-time PCR was performed by using the StepOnePlus Real-Time PCR system (Applied Biosystems).The expression of each target gene at the mRNA level was measured relative to the reliable HKG and calculated as R=ECt housekeeping gene/ECt target gene,24 with E representing the amplification efficiency of the respective primer system.
Identification of the most stable housekeeping gene
Three different statistical algorithms geNorm,25 NormFinder26 and BestKeeper27 were used according to the developer’s recommendations to evaluate the expression stability of our three candidate HKGs. For each cell subset, the mean Ct value for each HKG for each sample was calculated and used either directly to estimate its expression stability across all samples as in BestKeeper algorithm, or was first transformed to relative quantities using the comparative Ct method as in geNorm and NormFinder.
GAPDH was shown to represent the most stable reference gene in all cell subsets and therefore was selected as HKG for relative quantifications. The respective ranking order of the three candidate HKGs using the three algorithms for all cell subsets is shown in table 1. Lower M values in geNorm and lower stability values in NormFinder indicate the more stably expressed genes. In BestKeeper, higher correlation coefficient values correspond to more stable genes.
Ranking of the candidate housekeeping genes according to their expression stability values calculated by geNorm, NormFinder and BestKeeper algorithms
Evaluation of serum IFN-γ
The concentration of serum IFN-γ was evaluated using Human IFN-γ ELISA Kit (BioLegend).
Statistics
According to EULAR response criteria, 28-joint disease activity score based on erythrocyte sedimentation rate (DAS28-ESR) was used to identify disease activity for all patients at T0, T16 and T24 and DAS28≤3.2 was interpreted as low, 3.2<DAS28≤5.1 moderate and DAS28>5.1 high.28 A DAS28<2.6 corresponds to being in remission according to preliminary criteria of the American Rheumatology Association.29 A good EULAR response to treatment was defined as an improvement of DAS28-ESR>1.2 from T0 to T16 (RT16) or T24 (RT24).28 For statistical analysis, logarithmic normal distributed data were used for all PCR results that did not fully fit a normal distribution and extreme outliers were removed. To analyse the effect of time of treatment (T0, T16 and T24), response rate (responder and non-responder (NR)) and the interaction between these two factors on the expression of different proteasome subunits and on the concentration of IFN-γ, two-way (two factors) repeated measure analysis of variance (ANOVA) with Tukey’s multiple comparison test (95% CI) was used. To evaluate the effect of time on the expression of proteasome subunits for each group, paired one-way ANOVA with Tukey’s multiple comparison test (95% CI) was applied. To estimate the effect of time, response rate and interaction of both on the activity of proteasome and apoptosis after inhibition with bortezomib, unpaired two-way ANOVA was applied. Per-protocol analyses were applied; thus, only those patients who strictly adhered to the protocol were included in all statistical analyses. To evaluate the effect of MTX, IFX and TCZ on the expression of immunoproteasome subunits, paired one-way ANOVA with Tukey’s multiple comparison test (95% CI) was applied to whole-blood expression data before and during therapy. GraphPad Prism 7 software (San Diego, California, USA) was used for all statistical analysis and statistical significance was set at p<0.05.
RESULTS
A total of 40 patients (31 women and 9 men) with a mean age of 58 years (SD±12 years; median 58 years, range 26–78 years) diagnosed with RA were included in the study. One patient was enrolled in the biomarker project at T0 but did not receive abatacept treatment; therefore, the biomarker follow-up analyses were only done in 39 patients. Twenty-nine were rheumatoid factor (RF)-IgM-positive and 28 were anti-citrullinated protein antibodies (ACPA)-positive. Disease duration ranged between 3 months and 45 years (mean 7.6 years). Thirty-five patients received abatacept as the first biological therapy after failure of MTX and two patients as first line together with MTX. Previous therapy included MTX in 27 patients, leflunomide in 17 patients, sulfasalazine in 8 patients, hydroxychloroquine in 5 patients and azathioprine in 2 patients. Previous biological therapies included TCZ (three patients), rituximab, adalimumab, certolizumab and etanercept (two patients each) and anakinra (one patient).
Twenty-three patients received abatacept intravenously, while 16 patients received abatacept subcutaneously. Prednisolone was given as a comedication in 31 patients (21 up to 5 mg/day, 6 patients between 5 and 10 mg/day and 4 more than 10 mg/day). Additional concomitant DMARDs included hydroxychloroquine (seven patients), leflunomide (six patients) and sulfasalazine (five patients). Thirty-two patients reached T16, while 29 patients completed the goal of 6 months of treatment (T24).
Disease activity of RA was evaluated according to the EULAR response criteria (table 2). According to a change in DAS28-ESR of >1.2 from T0 to T16 or T24, four different groups were defined: prolonged responder at T16 and T24 (RT16RT24) (n=12), responder at T16 and NR at T24 (RT16NRT24) (n=3), responder at T24 and NR at T16 (RT24NRT16) (n=8) and NR (n=6). Eight patients discontinued intervention at T16 and three at T24, as shown in figure 1.
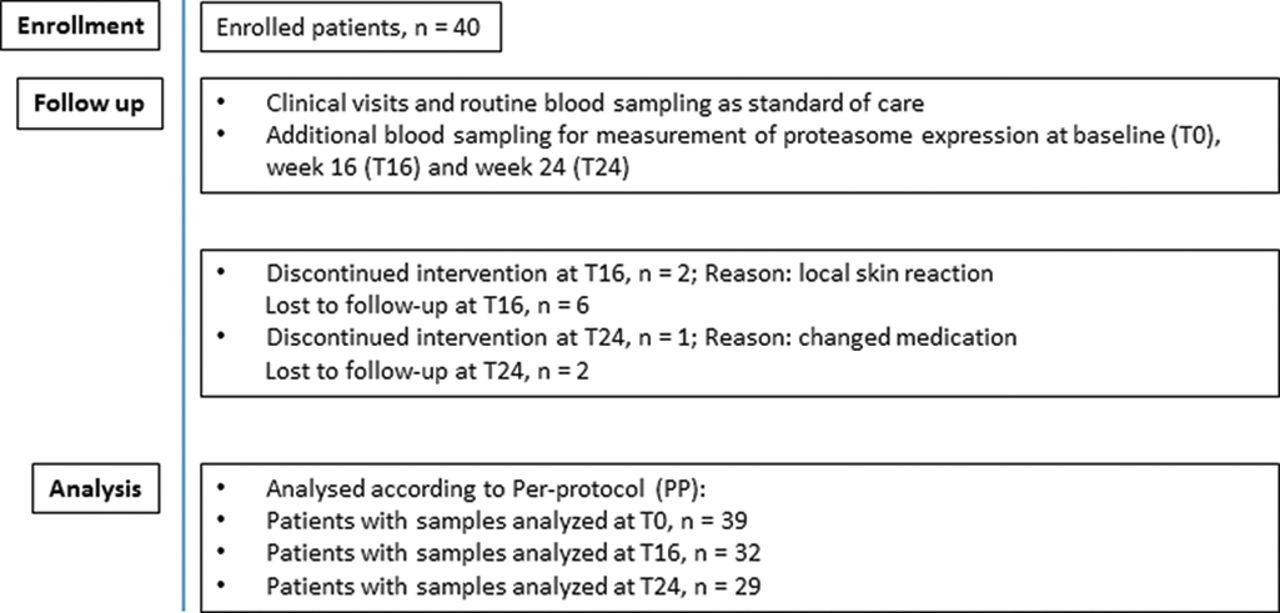
Flow of patients included in the study. Number of patients and reason for discontinuation and number of samples analysed per time point.
Patients in remission, low, moderate or high disease activities according to EULAR response criteria using DAS28-ESR
Abatacept significantly reduced the expression of proteasomal immunosubunit β1i in T lymphocytes
After sorting patients into four groups according to treatment response, we investigated the influence of abatacept on the expression of proteasome subunits by using paired two-way ANOVA.
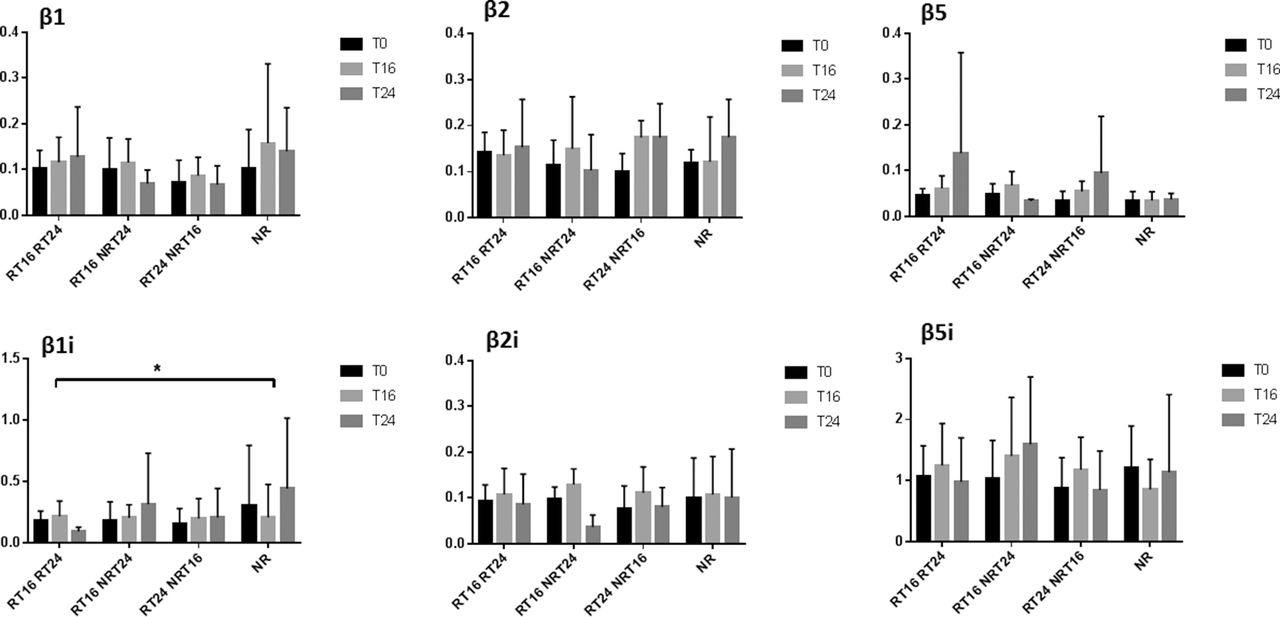
Using real-time RT-PCR, we investigated the expression of proteasomal subunits β1, β2, β5, β1i, β2i, β5i and α3 at three time points, T0, T16 and T24, in CD4+, CD8+ T lymphocytes, CD14+ monocytes, CD19+ B lymphocytes, DCs and total PBMCs of patients. To investigate if there was an effect of abatacept on the expression of proteasome subunits and if this effect depended on the degree of response, two-way repeated measure ANOVA was applied. Thus, two factors were time (T0, T16 and T24) and type of response (response at both time points week 16 and week 24 (RT16RT24), response at time point week 16 but not at week 24 (RT16NRT24), response at week 24 but non-response at time point week 16 (RT24NRT16) and non-response (NR)). After performing analysis in all cell subsets for all subunits, only CD4+ and CD8+ T lymphocytes showed significant interaction for immunosubunit β1i. In detail, in both cell subsets, neither time nor response showed solely effect on the expression of β1i; only the interaction of both factors was statistically significant with reduced expression of immunosubunit β1i in prolonged response group RT16RT24 at T24 (F(6, 42)=2.468 p=0.0390 for CD4+ (figure 2), F(6, 40)=2.882 p=0.0198 for CD8+ (figure 3).

Proteasomal immunosubunit β1i was significantly different in T lymphocytes CD4+ depending on response to therapy. Relative gene expression of proteasomal subunits normalised to GAPDH in CD4+ T lymphocytes. Patients were sorted into four groups according to response rate and the effect of abatacept on the expression of proteasomal subunits during 6 months was analysed. The bar plots represent the mean with SD. Two-way repeated ANOVA with Tukey’s multiple comparison test was performed on log-transformed data using GraphPad Prism 7. ANOVA, analysis of variance; GAPDH, glyceraldehyde-3-phosphate dehydrogenase; RT16RT24, response at both time points week 16 and week 24; RT16NRT24, response at time point week 16 but not at week 24; RT24NRT16, response at week 24 but non-response at time point week 16; NR, non-response. T0, baseline; T16, at 16 weeks; T24, at 24 weeks. *p<0.05.

Proteasomal immunosubunit β1i was significantly different in T lymphocytes CD8+ depending on response to therapy. Relative gene expression of proteasomal subunits normalised to GAPDH in CD8+ T lymphocytes. Patients were sorted into four groups according to response rate and the effect of abatacept on the expression of proteasomal subunits during 6 months was analysed. The bar plots represent the mean with SD. Two-way repeated ANOVA with Tukey’s multiple comparison test was performed on log-transformed data using GraphPad Prism 7. ANOVA, analysis of variance; GAPDH, glyceraldehyde-3-phosphate dehydrogenase; RT16RT24, response at both time points week 16 and week 24; RT16NRT24, response at time point week 16 but not at week 24; RT24NRT16, response at week 24 but non-response at time point week 16; NR, non-response. T0, baseline; T16, at 16 weeks; T24, at 24 weeks. *p<0.05.
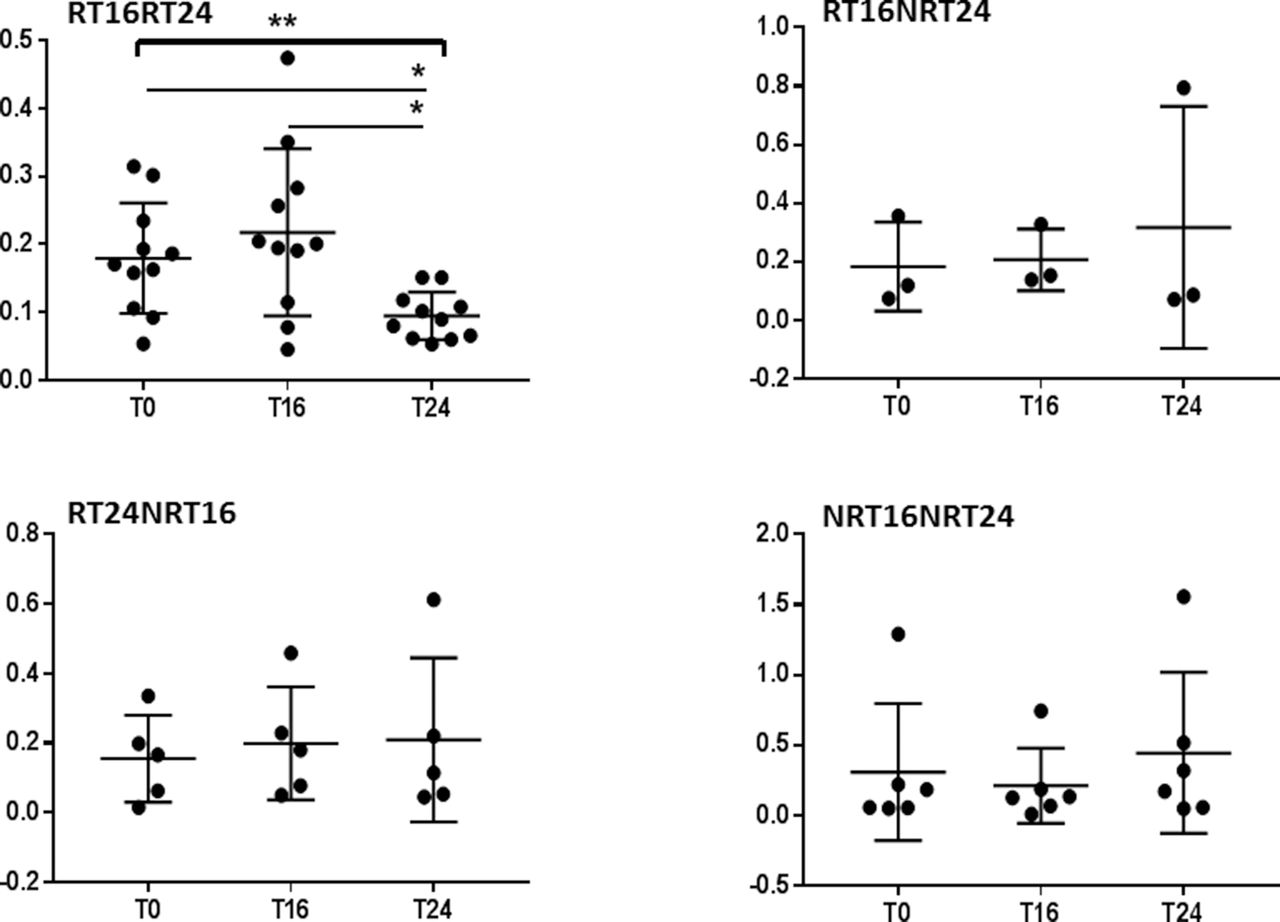
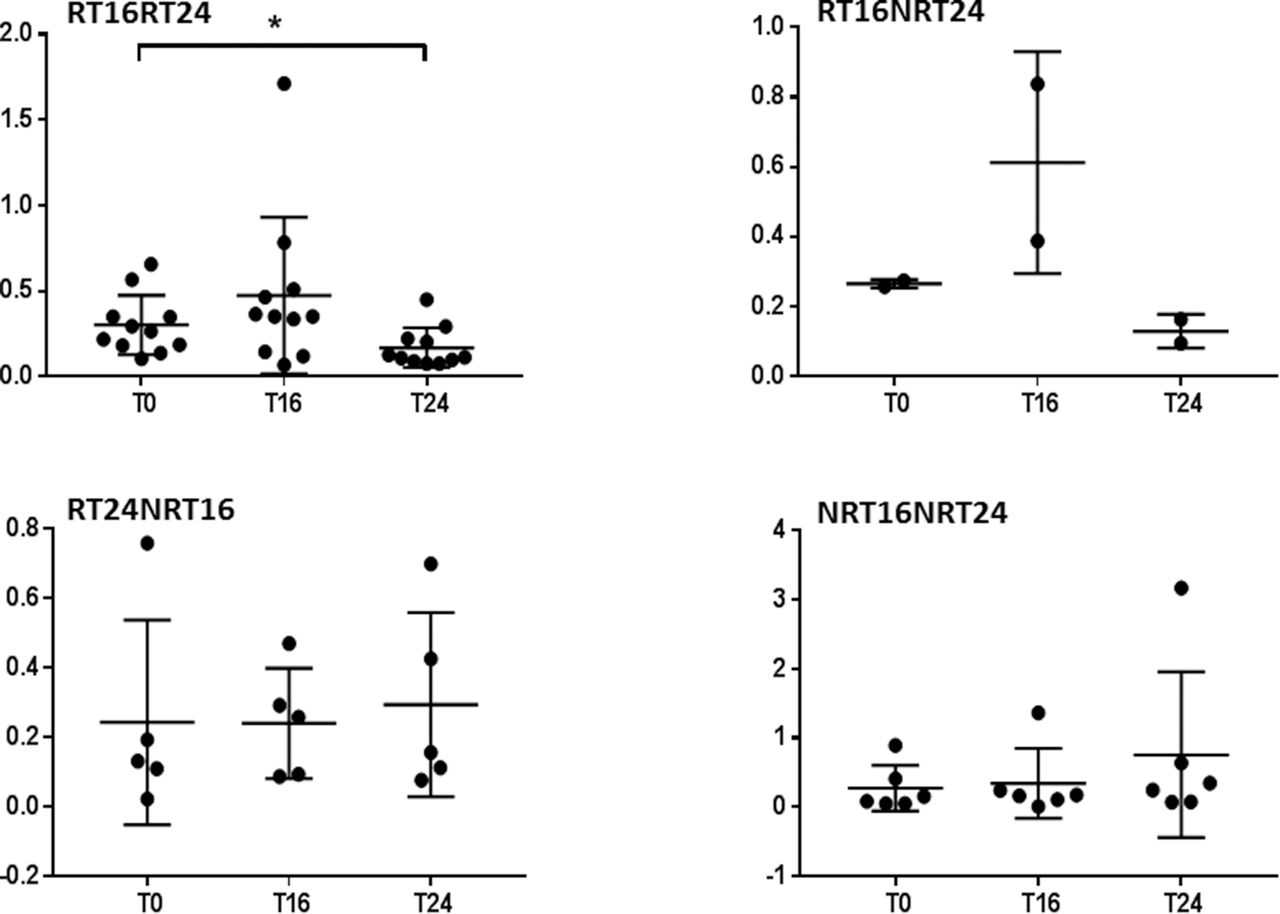
To confirm the result, we applied one-way repeated measure ANOVA for each response group separately with three time points in CD4+ and CD8+. The expression of β1i was significantly reduced in prolonged responders RT16RT24 at T24 in CD4+ (F(1.185, 11.85)=8.751 p=0.0098); in addition, Tukey’s multiple comparison test showed significant differences between T0 and T24 (p=0.0396) and between T16 and T24 (p=0.0260, figure 4). CD8+ showed also significant reduction at T24 (F(1.359, 13.59)=5.968, p=0.0215, figure 5).

Responders at T16 and T24 showed significant reduction in β1i in CD4+ T lymphocytes. Relative gene expression of immunoproteasomal subunit β1i normalised to GAPDH in CD4+ T lymphocytes. Patients were sorted into four groups according to response rate and the effect of abatacept on the expression of immunoproteasomal subunit β1i during 6 months was analysed for each group separately. The lines represent mean with SD. One-way repeated ANOVA with Tukey’s multiple comparison test was performed on log-transformed data using GraphPad Prism 7. ANOVA, analysis of variance; GAPDH, glyceraldehyde-3-phosphate dehydrogenase; RT16RT24, response at both time points week 16 and week 24; RT16NRT24, response at time point week 16 but not at week 24; RT24NRT16, response at week 24 but non-response at time point week 16; NRT16NRT24, non-response. T0, baseline; T16, at 16 weeks; T24, at 24 weeks. *p<0.05, **p<0.01.

Responders at T16 and T24 showed significant reduction in β1i in CD8+ T lymphocytes. Relative gene expression of immunoproteasomal subunit β1i normalised to GAPDH in CD8+ T lymphocytes. Patients were sorted into four groups according to response rate and the effect of abatacept on the expression of immunoproteasomal subunit β1i during 6 months was analysed for each group separately. The lines represent mean with SD. One-way repeated ANOVA with Tukey’s multiple comparison test was performed on log-transformed data using GraphPad Prism 7. ANOVA, analysis of variance; GAPDH, glyceraldehyde-3-phosphate dehydrogenase; RT16RT24, response at both time points week 16 and week 24; RT16NRT24, response at time point week 16 but not at week 24; RT24NRT16, response at week 24 but non-response at time point week 16; NRT16NRT24, non-response. T0, baseline; T16, at 16 weeks; T24, after 24 weeks. *p<0.05.
Additionally, we applied ordinary (not repeated measures) one-way ANOVA for each time with four different response groups and there was no significant difference between groups at each time point.
Abatacept does not have significant influence on serum IFN-γ
Patients were sorted into four response groups and two-way repeated measure ANOVA was applied to analyse the influence of abatacept on the concentration of serum IFN-γ during time of therapy regarding response rate. No significant interaction was detected; also the main effect of time or response rate on serum IFN-γ was not statistically significant (data not shown).
Methotrexate, infliximab and tocilizumab show no effect on immunoproteasome subunits
To estimate effects of MTX on the expression of immunoproteasome subunits and to compare the effect of abatacept on proteasome with other bDMARDs (IFX and TCZ), we investigated the open-access data (GSE93777) for expression of immunoproteasome subunits β1i, β2i and β5i in whole-blood transcriptomes, which were available from multiple time points for three groups of RA responders, who were treated with MTX, IFX or TCZ. Samples were grouped according to time points (T0, mid and end of treatment) and paired one-way ANOVA was applied to estimate the effect of each of these treatments on immunoproteasome subunits expression. No significant changes were detected in any of the treatment groups (figure 6).

Rheumatoid arthritis (RA) responders show no changes in immunoproteasome subunits under the effect of methotrexate (MTX), infliximab (IFX) or tocilizumab (TCZ) treatment. The expression of immunoproteasome subunits β1i, β2i and β5i was investigated in whole-blood transcriptome data (GSE93777) at multiple times for three groups of RA responders treated with MTX, IFX or TCZ for 6 months. Data were sorted according to time points (baseline (T0), mid (T2) and end of treatment (T3)) and paired one-way analysis of variance was applied on log-transformed data using GraphPad Prism 7. No significant changes were detected in any of the treatment groups.
Abatacept does not influence β5i chymotrypsin-like activity of proteasome
To assess the therapeutic effect on the activity of the proteasome, we measured proteasome activity at three time points using bortezomib (proteasome inhibitor) as a tool to specifically determine proteasome activity. Since only a limited amount of material was available, we focused one proteolytic activity and selected the most common chymotrypsin-like one (carried out by β5i). The activity of the lysates incubated with bortezomib (5 and 50 nM) was measured and normalised based on the activity of cell lysates without proteasome inhibitor which was set as 100%. To estimate this effect and to assess if there was a difference dependent on response state, ordinary (not repeated measures) two-way ANOVA was applied using time and response rates as two independent factors and proteasome activity as the dependent variable in the analysis. Experiments were only performed in PBMCs and CD4+ and CD8+ cells in samples with sufficient cell counts and in three groups RT16RT24, RT24NRT16 and NR. RT16NRT24 group was excluded because of limited data available due to low number of patients in this group (n=3). A dose-dependent effect just for proteasome activity was observed in all cells. After using 5 nM bortezomib, there was no statistically significant interaction between the response rate and different time points on proteasome activity in PBMCs (F(4, 54)=0.05071, p=0.9950), in CD4+ (F(4, 34)=0.4666, p=0.7598) and in CD8+ (F(4, 18)=1.32, p=0.3002). After using 50 nM bortezomib, the interaction was also not significant in PBMCs (F(4, 54)=1.006, p=0.4127) and in CD4+ (F(4, 32)=0.6064, p=0.6609). For CD8+, the available data was not enough to perform analysis.
The main effect for different times and for different response rates on proteasome activity was also not statistically significant in PMBCs, CD4+ and CD8+ after using 5 nM bortezomib and in PMBCs and CD4+ after using 50 nM bortezomib (data not shown).
Abatacept has no effect on the induction of apoptosis by proteasome inhibitor
To examine if there was any effect of abatacept on proteasome in enhancing or suppressing the role of proteasome inhibitor in inducing apoptosis, caspase activity was measured in cells incubated with 5 and 50 nM bortezomib and data were normalised based on the caspase activity in cells without proteasome inhibitor, which was set as 1.00. For analysis, ordinary (not repeated measures) two-way ANOVA was performed, time and different response groups were two independent factors and apoptosis was the dependent variable. PBMCs, CD4+ and CD8+ of samples with sufficient cell counts were used and the analyses were performed in three response groups RT16RT24, RT24NRT16 and NR. RT16NRT24 group was excluded because of limited data available due to low number of patients in this group (n=3). A dose-dependent effect just for induction of apoptosis was observed in all cells. After incubation of cells with 5 nM bortezomib, there was no statistically significant interaction between the response rate and different time points on apoptosis in PBMCs (F(4, 57)=0.544, p=0.7041), in CD4+ (F(4, 44)=0.6271, p=0.6457) and in CD8+ (F(4, 27)=1.447, p=0.2458). After using 50 nM bortezomib, the interaction was also not significant in PBMCs (F (4, 59)=1.057, p=0.3860), in CD4+ (F(4, 49)=1.712, p=0.1624) and in CD8+ (F(4, 29)=2.314, p=0.0812). The main effect for different times and for different response rates on proteasome activity was also not statistically significant in PMBCs, CD4+ and CD8+ after using 5 nM and 50 nM bortezomib (data not shown).
DISCUSSION
In this study, we were able to show that only a successful treatment with abatacept had an influence on the expression of the proteasome system in patients with RA. In fact, a significant reduction of the expression of the immunosubunit β1i was observed exclusively in CD4+ and CD8+ T lymphocytes only in patients with a prolonged response over 24 weeks of treatment. This effect is consistent with the mode of action of abatacept as a costimulation modulator and inhibitor of T cell activation. This result is of interest since the main goal in RA treatment is to achieve clinical remission or very low disease activity.30 In this context, it is important to understand also the biochemical correlation of disease remission and to characterise the involved pathways in more detail.31
In our study, 87% of patients received abatacept as the first bDMARD and 5% as first-line therapy. As a result, 55% achieved remission or low disease activity at week 16 and 70% at week 24 confirming the excellent effectiveness of abatacept especially in bDMARDs-naïve patients. In this context, our observations are in line with the results from the clinical development programme of abatacept with best results in early phases of disease and in patients without prior exposure to bDMARDs.32 33
Methodically, we used relative quantification real-time PCR to evaluate the expression of different catalytic proteasomal subunits in different cell subsets relative to HKGs used for normalisation of the target gene expression. Since the expression levels of HKGs vary between cell types and experimental conditions,34 the selection of the most stable reference gene is important to assure the accuracy of results obtained in the analysis. According to previous studies,35 we evaluate the stability of commonly used HKGs using three algorithms. Consistent with results obtained previously in PBMCs,35 GAPDH was the most stable reference gene across all cell subsets used in this analysis.
In the former study, a significant decrease in the percentage of IFN-γ-producing CD8+ T cells was detected in patients with RA administrated with abatacept for 6 months. Of note, when patients were stratified according to their clinical response, this reduction was statistically significant only in patients with good response.21 This was confirmed by another study showing a reduction of the level of IFN-γ in serum36 and a reduced expression in synovial cells37 under abatacept therapy. Obviously, in vitro treatment of synovial T cells with abatacept decreased their ability to produce IFN-γ.38 As also reported previously, the reduction of IFN-γ production can be associated with a good clinical response to abatacept.37 Our results are partly in line with these known associations; thus, on the one hand, the expression analysis did show a significant decrease for the β1i subunit only in CD4+ and CD8+ of prolonged response patients; on the other hand, no significant difference of serum IFN-γ or association between response rate and IFN-γ could be detected in our patients. This finding is in agreement with our results that neither β2i nor β5i showed a significant decrease in any cell subset. Accordingly, we could suspect that the reduction of β1i in our prolonged responders was not under the effect of IFN-γ, although the measurement of cellular IFN-γ could have confirmed the conclusion. This interesting observation supports further research on the proteasome system in patients with RA under abatacept treatment as well as in vitro cell culture experiments on the proteasome system in the presence/absence of abatacept to replicate the in vivo findings.
Analysis of whole-blood transcriptomes of RA responders to MTX, IFX and TCZ was performed as a first approach to compare with other types of therapies in RA. Although no cell subset data could be investigated, these data did not show any effect of MTX, IFX and TCZ on immunoproteasome subunits. Next, we estimated the effect of abatacept on the activity of proteasome and immunoproteasome by using bortezomib. This potent reversible proteasome inhibitor primarily targets the β5 subunits with chymotrypsin-like activity, whereas the β1 subunit and its immunoproteasome counterpart β1i with caspase-like activity are less specifically inhibited.39 Due to limited material, we applied only chymotrypsin-specific substrate to measure the remaining chymotrypsin-like activity, which is considered to represent the most important active site in protein breakdown40 and exhibits an increasing activity under the effect of IFN-γ.41 In fact, all three active sites contribute significantly to protein breakdown. Thus, simultaneous inhibition of the chymotrypsin-like and the caspase-like as well as trypsin-like sites is required to markedly decrease proteolysis.39 However, in our study, only the expression of β1i was significantly influenced in responders under abatacept. Therefore, we were unable to show an influence on the β5i-dependent proteolytic activity.
The transcription factor nuclear factor-kappa B (NF-κB) is a well-known regulator of inflammation in RA.42 In unstimulated cells, NF-κB is present in the cytoplasm in a latent form bound to inhibitory proteins known as IκB. Activation of NF-κB involves phosphorylation, ubiquitination and proteasomal degradation of IκB, allowing the transcription factor to enter the nucleus and initiate transcription.43 As known, the proteasome inhibitor bortezomib inhibits NF-κB by blocking degradation of IκB44; additionally, many studies confirmed the role of NF-κB in apoptosis mediated by proteasome inhibitors.45 46 Therefore, in this study, we tried to investigate the effect of bortezomib on apoptosis in T cells of patients with RA after exposure to abatacept. However, we did not observe any influence of abatacept on susceptibility of cells to apoptosis under the influence of bortezomib. Other studies have confirmed an association between immunosubunits and enhanced activation of the NF-κB pathway.47 In addition, a downregulation of the NF-κB cascade was shown in macrophages treated with abatacept in vivo.48 In our patients, the exclusive reduction of β1i was obviously not sufficient to introduce a strong effect, or the reduction in β1i could have been compensated via constitutive subunits as seen after β5i blocking previously.49 In this context, it is also known that immunoproteasome inhibitors can rather reduce the extracellular signal-regulated kinase (ERK) phosphorylation cascade but not the NF-κB pathway.49
CONCLUSION
In summary, treatment with abatacept showed a clear effect exclusively on the expression of the IFN-inducible proteasome immunosubunit β1i, but surprisingly not on other immunosubunits.
This finding is especially of interest since this phenomenon was only seen in CD4+ and CD8+ T cells of prolonged responding patients with RA. Taken together, we describe an association between reduced induction of β1i and sustained response to the T-cell-directed therapy with abatacept. Thus, the role of the proteasome subunit β1i in T cell activation in RA should be investigated in future studies.
Key messages
What is already known about this subject?
Excellent effectiveness of abatacept in improving the signs and symptoms of rheumatoid arthritis, especially in patients without prior exposure to biological disease-modifying anti-rheumatic drugs (bDAMRDs).
What does this study add?
A significant reduction of the expression of the proteasome immunosubunit β1i was observed exclusively in CD4+ and CD8+ T lymphocytes only in patients with a prolonged response over 24 weeks of treatment. This effect is consistent with the mode of action of abatacept as a costimulation modulator and inhibitor of T cell activation.
How might this impact on clinical practice?
The described association between reduction of IFN-inducible proteasome immunosubunit β1i and prolonged response to the T- cell-directed therapy with abatacept call the attention to the apparent link between the response to abatacept and the immunoproteasome system.
Acknowledgments
We acknowledge support from the German Research Foundation (DFG) and the Open Access Publication Funds of Charité – Universitätsmedizin Berlin.
REFERENCES
Footnotes
KG and LMG contributed equally to this work.
Contributors KG participated in performing the experiments, designed and applied the analysis and contributed to writing and reviewing the manuscript. LMG performed the experiments and contributed to analysis of the clinical data. CK and LS collected samples and clinical data of patients. UK contributed to establishment of proteasome activity protocol and data analysis. TH contributed to whole-blood transcriptome collection and analysis. GB contributed to reviewing the manuscript. EF designed the study, collected samples and clinical data, contributed to writing and reviewing the manuscript. KG and LMG contributed equally to this work.
Funding This work was supported by an unrestricted research grant from Bristol-Myers Squibb (BMS).
Competing interests None declared.
Patient consent for publication Not required.
Ethics approval The study was approved by the local ethics committee of the rheumatology and clinical immunology department at the Charité University Hospital in Berlin and all patients gave informed consent prior to blood sample collection.
Provenance and peer review Not commissioned; externally peer reviewed.
Data availability statement The datasets used and/or analysed during the current study are available from the corresponding author on reasonable request.