Article Text

Abstract
Objectives To analyse the amount, reporting and handling of missing data, approach to intention-to-treat (ITT) principle application and sensitivity analysis utilisation in randomised clinical trials (RCTs) of rheumatoid arthritis (RA). To assess the trend in such reporting 10 years apart (2006 and 2016).
Methods Parallel group drug therapy RA RCTs with a clinical primary endpoint.
Results 176 studies enrolling a median of 160 (IQR 62–339) patients were eligible. In terms of actual analysis: 81 (46%) RCTs conducted ITT, 42 (23.9%) conducted modified ITT while 53 (30.1%) conducted non-ITT analysis. Only 58 of 97 (59.8%) RCTs reporting an ITT analysis actually performed it. The median (IQR) numbers of participants completing the trial and included in analysis for primary outcome were 86% (74%–91%) and 100% (97.1%–100%), respectively. 53 (32.7%) and 65 (40.1%) RCTs had >20% and 10%–20% missing primary outcome data, respectively. Missing data handling was unreported by 58 of 171 (33.9%) RCTs. When reported, vast majority used simple imputation methods. No significant trend towards improved reporting was seen between 2006 and 2016. Sensitivity analysis numerically improved from 2006 to 2016 (14.7% vs 21.4%).
Conclusions There is significant discrepancy in the reported and the actual performed analysis in RA drug therapy RCTs. Nearly one-third of RCTs had >20% missing data. The reporting and methods of missing data handling remain inadequate with high usage of non-preferred simple imputation methods. Sensitivity analysis utilisation was low. No trend towards better missing data reporting and handling was seen.
- rheumatoid arthritis
- outcome and process assessment
- healthcare
- epidemiology
Data availability statement
Data available upon request.
This is an open access article distributed in accordance with the Creative Commons Attribution Non Commercial (CC BY-NC 4.0) license, which permits others to distribute, remix, adapt, build upon this work non-commercially, and license their derivative works on different terms, provided the original work is properly cited, appropriate credit is given, any changes made indicated, and the use is non-commercial. See: http://creativecommons.org/licenses/by-nc/4.0/.
Statistics from Altmetric.com
Key messages
What is already known about this subject?
Missing data are common in randomised controlled trials (RCTs).
Handling of missing data has implication for the results of RCTs.
Little is known about missing data reporting and its handling in RCTs of rheumatoid arthritis (RA) treatment.
What does this study add?
Missing data are a significant issue in RCTs in RA.
More importantly, missing data handling relies heavily on error-prone methods of simple imputation with no trend of improvement.
Sensitivity analysis usage remains very low.
How might this impact on clinical practice or future developments?
Increased awareness and requirement of using the preferred imputation methods is needed.
Journals should require reporting of these methods as well as sensitivity analysis.
Introduction
Randomised controlled trial (RCT) is the gold standard for comparing treatments and determining efficacy. Randomization reduces bias by balancing distribution of known and unknown confounding factors.1 The intention-to-treat (ITT) principle preserves randomisation by evaluating all participants as original randomly assigned, regardless of deviations from randomised treatment and actual interventions.1–3
Most trials have missing data due to protocol deviation, non-adherence, trial non-completion and other issues.3 The ideal analysis, a true ITT analysis, has no missing data.2 Per-protocol (PP) or complete-case (CC) analysis include only subjects who adhere to the assigned treatment and complete the study. These approaches generally introduce bias. Missing data undermine the RCT by introducing confounding, unbalancing baseline characteristics and compromising the internal validity.4 5 Moreover, compliant subjects do better than non-compliant ones, irrespective of active treatment or placebo status.6 Thus, restricting analysis to those who completed a trial as PP can lead to misleading estimates of treatment efficacy.7 Non-ITT methods may simply reflect confounding from differences of demographics, prognostic features or subject characteristics.5 8 The ITT approach reflects the real-world settings where subjects drop out, switch treatments or are non-compliant. Although ITT may underestimate the true difference, via dilution, it still represents the best unbiased estimate.9 10 However, it must be noted that ITT analysis only matters if there are missing data, otherwise ITT and CC are similar.
The term ITT is often used incorrectly11 12 as RCTs with post-randomisation exclusions are still described as using ‘ITT analysis’.13 The term modified ITT (mITT) reflects analyses where participants are excluded for different reason(s) post-randomisation.14 mITT analysis usage has increased.15 Consequently, the Consolidated Standards of Reporting Trials (CONSORT) statement requires a clear description of subject randomisation and analysis rather than simply stating the method.1
Missing data may seriously compromise inferences ascertained from RCTs,16 17 limit the ability to draw conclusions18 or lead to incorrect inferences about drug safety.19 20 Missing data can be handled by imputation. Simple imputation (SI) methods include last observation carried forward (LOCF), baseline observation carried forward, non-response imputation (NRI) or poor response imputation. SI assumes lack of temporal change, underestimates true data variability and biases treatment effect estimates.16 17 21 Multiple imputation, maximum likelihood-based methods such as expectation–maximisation algorithm, or equation-based methods such as full information maximum likelihood or mixed model regression for longitudinal data are generally preferred. These methods incorporate auxiliary information about the missing data and report SE and p values.16 17 21 Any attempt at replacing missing data makes unverifiable assumptions about the distribution of the unobserved or missing data.22 23 To test these assumption(s), sensitivity analyses with a different assumption(s) should be performed.16 17 21 24
Studies across disciplines have reported inappropriate use of the ITT principle, incorrect handling of missing data, utilisation of weak imputation methods and lack of sensitivity analyses.13 24–27 Studies in rheumatoid arthritis (RA) exploring this have either been restricted to top medical journals or have also included subjects without RA.25 27 Our study examines RA publications in all medical journals and gives temporal trends in missing data reporting and handling, before and after the publication of 2010 CONSORT statement.1 Our goal was to identify areas of improvement and create awareness about such shortcomings.
Methods
Literature search and RCT selection
MEDLINE and Cochrane Central Register of Controlled Trials databases were searched using terms “rheumatoid arthritis” and “arthritis, rheumatoid” with limits of “Clinical Trials” & years “2002–3”, “2006–7”, “2010–11” and “2016”. Inclusion criteria were original report of a single RCT in a population with RA, parallel design, drug therapy intervention and a clinical primary endpoint. Non-English language, abstract only, non-clinical endpoint, open-label extensions, population without RA, phase I studies and non-drug intervention studies were excluded. Studies with safety as the primary outcome were also excluded as safety analyses typically focus on the subgroup of trial participants who received the intervention, although such approach may be misleading by ignoring the reasons trial participants stop treatment.28
Trial selection and data acquisition
Two reviewers independently assessed each eligible RCT. Differences were resolved by consensus. Funding source, experimental agent used, study phase, study duration, study outcome, sample size calculation, participant flow description, overall subject dropout, self-reported data analysis method, actual data analysis method used (determined by study reviewers), missing data proportion and missing data handling methods were assessed.29 An adequate description of study participant flow was defined as a clear description of the number of subjects who were randomised, number completing and not completing the study with reasons, and number analysed for the primary outcome. We assessed whether participant progress through the phases of parallel RCT (enrolment, allocation, follow-up and analysed) was presented in a flow diagram, as recommended.1 30 Definitions are given in box 1.
Definitions for different methods of missing data handling
ITT analysis
All subjects analysed after randomisation. No exclusions.
Modified ITT analysis excluded the following15:
Subjects who did not receive any study intervention (treatment-related exclusion).
Subjects without a baseline assessment (baseline assessment exclusion).
Subjects without a post-baseline assessment (post-baseline exclusion).
Subjects found non-eligible after randomisation (target condition-related exclusion).
Exclusion of study centre(s) due to study conduct issues (centre-related exclusion).
Non-ITT analysis included the following:
Performed per-protocol analysis.
Performed a case completer analysis.
Included exclusions not specified in the modified ITT analysis definition.
Additional data for 2006 and 2016 trials
Additional data collected for the 2006 and 2016 studies included reporting of sample size inflation to account for anticipated dropout, mechanism of missing data, missing data in each study arm, and baseline characteristics comparison of study subjects with complete and missing data, and performance of sensitivity analysis. The 2006 and 2016 RCTs were compared for data analysis, use of ITT principle and handling of missing data.
Statistical analysis
Categorical data are described as the number (per cent), and the continuous variables are described as the median (IQR). Comparison of RCT characteristics among trials using different analysis approaches and temporal changes from 2006 to 2016 was assessed using Pearson’s Χ2 tests, Fisher’s exact test or likelihood ratio tests (for categorical variables) and Mann-Whitney U tests or Kruskal-Wallis tests (for continuous variables). SPSS V.21 was used for data analysis.
Results
Study characteristics
The 2027 reports published in 7 years (2002–2003, 2006–2007, 2010–2011, 2016) were screened to identify 176 eligible RCTs (figure 1). These RCTs enrolled a median of 160 (IQR 62–339) patients. In terms of actual analysis: 81 (46%) RCTs conducted ITT analysis, 42 (23.9%) conducted mITT analysis, while 53 (30.1%) conducted non-ITT analysis (27 RCTs conduced CC analysis, while analysis approach for 26 RCTs was unclear). Discordance was present between the reported and the actual analysis performed (figure 2). Only 58 of 97 (59.8%) RCTs reporting an ITT analysis actually performed it. Of 42 (23.9%) studies which performed mITT, only 8 (19.0%) described their analysis as mITT. RCT participant flow diagram was unreported or inadequate in 66.5% RCTs: mostly resulted from non-reporting of participants analysed for the primary outcome. A median of 86% participants (IQR 74%–91%) remained enrolled until trial completion, although 14 RCT reports did not specify number of patients completing the trial. Fifty-three (32.7%) and 65 (40.1%) of RCTs had >20% and 10%–20% missing primary outcome data, respectively. A median of 100% (IQR 97.1%–100%) patients were included in the efficacy analysis of primary trial outcome; 13 RCT reports did not specify number of patients analysed for the primary outcome. Most common missing data handling method was LOCF (69 (39.2%)), followed by NRI (49 (27.8%)) and imputing missing value by interpolation (21 (11.9%)). Only three study RCTs used preferred methods to deal with missing data for primary outcome analysis: two used linear mixed model regression,31 32 while one used expectation–maximisation algorithm to impute missing data.33 In addition, two RCTs used equation-based methods for sensitivity analyses.
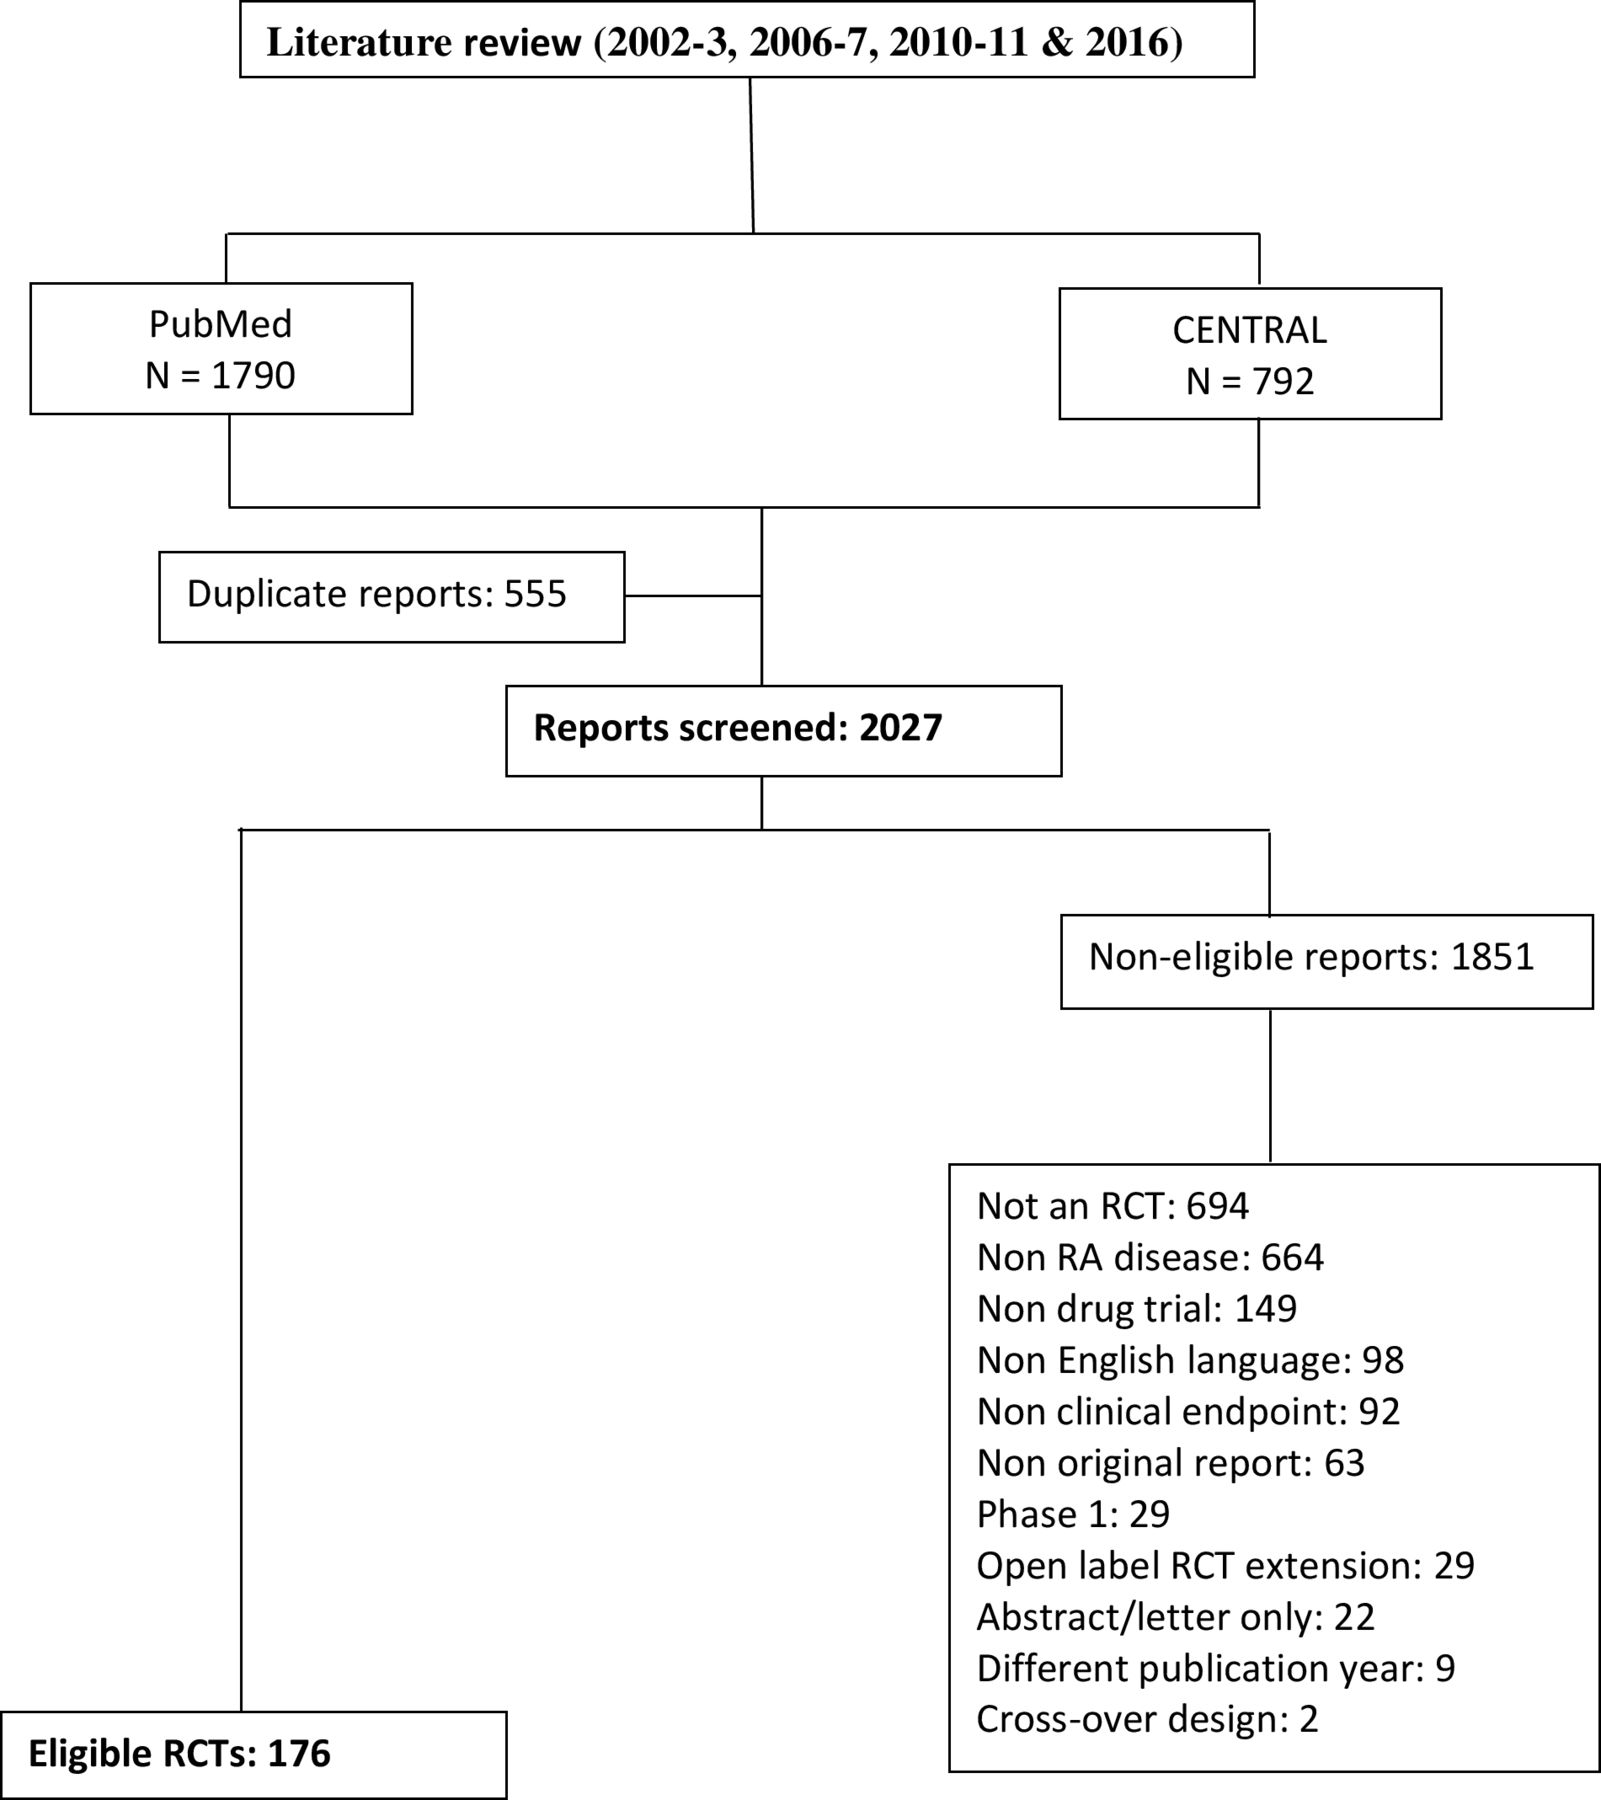
Study selection flow diagram. RA, rheumatoid arthritis; RCT, randomised controlled trial.

Discrepancy between self-reported analysis type and actual analysis performed for handling missing data. ITT, intention-to-treat; mITT, modified ITT; N, number.
Missing data handling was not reported by 58 of 171 (33.9%) RCTs; 5 RCTs had no missing data. Twelve RCTs using ITT analysis did not specify missing data handling method.
RCT characteristics associated with analysis type
Table 1 shows the characteristics of RCTs according to the analysis performed. Industry-funded RCTs were more likely to perform ITT or mITT than non-profit-funded RCTs. Trials reporting ITT or mITT analysis were more likely to enrol higher number of participants, be multicentre, describe sample size calculation, adequately report participant flow, describe missing data handling methods and include higher proportion of participants in the primary outcome analysis. However, there was no difference in proportion of participants completing the trials among the three groups. Among the mITT trials, the top two reasons for post-randomisation exclusions were no study treatment received (n=27) and no post-baseline assessment (n=17). Among non-ITT trials, the top two exclusions were study protocol deviation (n=22) and outcome absence at study completion (n=7).
Characteristics of the study RCTs according to the actual analysis type
Temporal trends in missing data reporting from 2006 to 2016
These studies, 10 years apart, were compared to assess trends in missing data reporting and handling. A total of 76 studies (34 published in 2006 and 42 published in 2016) were eligible. Baseline characteristics are given in online supplemental table 1 and were similar except for more RCTs in 2016 having a placebo arm compared with 2006. There were four RCTs of small molecules in 2016 and none in 2006.
Supplemental material
Table 2 provides a detailed description of data reporting in 2006 and 2016 RCTs. Of the 65 non-phase 2 RCTs, only 43 (66.2%) adequately reported sample size calculation. Thirteen (20.0%) RCTs inflated sample size by median of 20% (IQR 12.5%–25.5%) anticipating loss to follow-up. RCTs reporting sample size inflation numerically increased from 2006 (4 (12.9%)) to 2016 (9 (26.5%), p=0.167). Phase 2 trials were excluded as they have different sample size considerations.34 A significant increase in adequate participant flow description occurred between 2006 and 2016.
Comparison of data reporting including missing data and its handling in 2006 and 2016 RCTs
Self-reporting of ITT analysis declined from 2006 to 2016, while the actual analysis type was unchanged (table 2). Notably, 49 (68.1%) RCTs had >10% and 18 (25%) had >20% missing primary outcome data on completion. Four (5.5%) RCTs lacked information about subjects completing the RCT. The 2016 RCTs showed a trend toward higher percentage of participants completing the trials (table 2). Nearly one-third of RCTs did not report missing outcome data handling method: unimproved from 2006 to 2016. LOCF and NRI were the most common approaches to handle missing data, although a trend in decline of LOCF use was noted. No 2006 study and two 2016 studies used the preferred missing data handling methods.
Ten of 14 (17.5%) RCTs using sensitivity analysis reported results. Alternate imputation was the most used (seven RCTs) method for sensitivity testing. Sensitivity analysis usage improved from 2006 to 2016 (14.7% vs 21.4%). Only one trial each reported mechanism of missing data35 and baseline characteristics of trial completers and non-completers.36
Online supplemental table 2 gives the differential attrition between study arms. In 17 of 68 (25%) RCTs which reported number of patients completing each study arm, the comparator arm had >10% loss of patients compared with experimental arm, while three had >10% loss in the experimental arm compared with the comparator arm.
Discussion
Our review of RCTs of RA drug therapy showed that missing primary outcome data are a major issue. Reassuringly, however, almost all patients were included in the final primary outcome analysis (mostly by using SI methods for missing data). RCTs in 2016 reported the highest number of sensitivity analyses (20.5%). The 2006 and 2016 comparisons did not show any significant improvement in the parameters of missing data reporting, handling and sensitivity analysis.
Missing data handling methods were not reported by 38.0% RCTs. This is, however, improved from a previous report where 76.5% did not do so.25 When reported, non-preferred SI methods (LOCF and NRI) were used. Limited missing data handling reporting and preference for SI methods, when 67.0% of RCTs have >10% missing data, are concerning. To determine how much of missing data is problematic, some authors have reported a ‘5 and 20’ rule where <5% missing data lead to minimal bias, while >20% pose a serious validity issue.37 38
Table 3 summarises missing data reporting in four studies, including our study. The 2005 study looked at RCT data published in high-impact journals pertaining to RA, osteoarthritis and osteoporosis.25 The 2014 paper is of RCTs published in top four medical journals irrespective of medical condition.24 The 2016 study looking at phase 3 RA RCTs published in top rheumatology and medical journals is also included.27 The latter report’s RCTs may have some overlap with our study.
Trend of salient characteristics over time in RA studies and comparison with a study from top four medical journals
Misrepresentation of ITT analysis was common with only 59.8% of self-reported ITT being true ITT analysis. Overall, 46.0% actually performed an ITT analysis, which is slightly higher as compared with some other reports of 37%–40%24 26 and improved from older RA studies at 7.4%.25 mITT analysis excludes subjects which violate the ITT principles. However, the number of patients actually analysed for the primary outcome was high: 100% for ITT (as expected) and 98.8% for mITT. Thus, the absolute patient exclusions in mITT RCTs are small. Exclusion of such subjects, especially with small numbers, does not always violate the ITT principle.9 15 27 39 40 Recently, the treatment effect estimation in RA trials was shown to be similar between mITT and ITT analysis.39
For the 2006 and 2016 studies, only 20% adjusted the sample size for dropouts despite a quarter having >20% missing outcome data. Sample size inflation accounts for dropout data loss but it does not remedy missing data and any differences between the observed and missed data.16 Differential attrition can be a source of bias in RCTs.37 In our analysis, >10% attrition in the placebo or comparator arm versus the experimental arm was seen in 25% of trials which may artificially increase treatment effect in favour of experimental intervention if using SI. The use of SI in differential attrition biases results.41 A sensitivity analysis is required to assess the impact of such possible bias, but was performed in <20% trials. Impact of differential attrition in RA is unexplored. A small study of musculoskeletal RCTs found differential attrition rates ranging from 1% to 14%42 without impacting the results. The authors suggested reporting of baseline characteristics of both the analysed and randomised subjects.
Only one study reported a missing data mechanism.35 Another review reported this number at 7.8% RCTs.27 Three missing data mechanisms exist: missing completely at random (MCAR), missing at random (MAR) and missing not at random (MNAR) and are discussed elsewhere.43 44 It is important to obtain data on study completers and the non-completers. It is possible to distinguish between MCAR and MAR by studying the available data. If the completers and the non-completers differ (for example, if older participants have more missing data than younger participants, the data are not MCAR but possibly MAR). It is not possible to distinguish between MAR and MNAR by studying the available data.24 Only one RCT in our analysis reported data on completers and dropouts.36 In one study, this was 11.6%24 and 16.7% in older RA trials.25 Generally, MAR is a reasonable starting point.16 21 In our study, LOCF was the most common method (53.7%) to handle missing data in the 95 RCTs that used ITT or mITT. This is different from a prior report of RA trials where NRI was the most common (75%) imputation method.27 The US Food and Drug Administration as well as the European Medicines Agency used to recommend LOCF method, assuming that it could provide conservative effect estimates. This may have contributed to its widespread use. However, it generally introduces bias even if data are missing completely at random.45 In an RCT with longitudinal data, it is generally recommended to use a mixed model analysis excluding any systematic treatment effect at baseline. This is called ‘constrained analysis’.46 It is also recommended to adjust for baseline value of the outcome variable.47 In particular, this is a good way to handle missing data in an RCT with longitudinal data.48 None of our study RCTs used this approach.
A sensitivity analysis to test a range of plausible mechanisms responsible for the missing data is generally recommended.7 A sensitivity analysis should be performed with a different mechanism of missingness.44 Agreement of different sensitivity analyses is reassuring. Sensitivity analysis was reported by 17.5% RCTs in our review. These numbers are similar (21%–27%) for recent studies reviewing sensitivity analysis in RA trials26 27 but lower than numbers (37% and 27%) from top medical journals.24 27
Our study has limitations. The RCTs in our study were time and language restricted. Results may not be applicable to non-RA trials. Some of the deficiencies may result from poor reporting (not mentioning relevant details) and not necessarily poor execution.49 On the other hand, we have looked at a large number of trials over several years. We have compared the trend in reporting at two time points separated by a decade. We have not restricted our analysis to high-impact journals increasing representation.
Major gaps exist between statistical analysis recommendations and actual reporting. Many papers and recommendations have addressed these deficiencies from a statistical perspective.16 23 44 50 51 These issues are seemingly better handled in papers published in high-ranking journals signifying greater attention to missing data handling during peer review might improve such reporting.
In conclusion, our study has found significant shortcomings in the reporting and handling of missing data in RA trials: there is wide variability in reporting and performance of ITT analysis, SI methods remain popular despite shortcomings, sensitivity analysis usage is low, there is inadequate explicit reporting of participants with missing outcomes and methods used to handle them, baseline comparisons of completers versus dropouts are deficient. Lack of a significant trend in improved reporting 10 years apart remains a major concern.
Data availability statement
Data available upon request.
Ethics statements
References
Supplementary materials
Supplementary Data
This web only file has been produced by the BMJ Publishing Group from an electronic file supplied by the author(s) and has not been edited for content.
Footnotes
Twitter @faslammd
Presented at This study has been partially presented as a poster at the 2017 American College of Rheumatology annual meeting as a poster and as an oral presentation at the 2018 American College of Rheumatology annual meeting. References are the following: 2017 conference reference: Aslam F, Torralba K, Khan NA. Handling of Missing Data, Protocol Violation and Performance of Intention-to-Treat Analysis in the Randomized Controlled Trials of Drug Therapy of Rheumatoid Arthritis (abstract). Arthritis Rheumatol. 2017; 69 (suppl 10). https://acrabstracts.org/abstract/handling-of-missing-data-protocol-violation-and-performance-of-intention-to-treat-analysis-in-the-randomized-controlled-trials-of-drug-therapy-of-rheumatoid-arthritis/. Accessed 11 March 2020. 2018 conference reference: Aslam F, Torralba K, Khan NA. Comparison of Missing Data Reporting and Handling in Randomized Controlled Trials of Rheumatoid Arthritis Drug Therapy: A Snapshot Ten Years Apart (abstract). Arthritis Rheumatol. 2018; 70 (suppl 10). https://acrabstracts.org/abstract/comparison-of-missing-data-reporting-and-handling-in-randomized-controlled-trials-of-rheumatoid-arthritis-drug-therapy-a-snapshot-ten-years-apart/https://acrabstracts.org/abstract/comparison-of-missing-data-reporting-and-handling-in-randomized-controlled-trials-of-rheumatoid-arthritis-drug-therapy-a-snapshot-ten-years-apart/. Accessed 11 March 2020.
Contributors All authors contributed to the drafting, writing, editing and review of the manuscript. NAK and KDT conceived the idea. FA and NAK collected the data. NAK ran the analysis.
Funding The authors have not declared a specific grant for this research from any funding agency in the public, commercial or not-for-profit sectors.
Competing interests None declared.
Provenance and peer review Not commissioned; externally peer reviewed.