Article Text

Abstract
Background Low back pain (LBP) is a leading cause of disability worldwide, but the aetiology remains poorly understood. Finding relevant biomarkers may lead to better understanding of disease mechanisms. Patients with vertebral endplate bone marrow lesions visualised on MRI as Modic changes (MCs) have been proposed as a distinct LBP phenotype, and inflammatory mediators may be involved in the development of MCs.
Objectives To identify possible serum biomarkers for LBP in patients with MCs.
Methods In this case control study serum levels of 40 cytokines were compared between patients with LBP and MC type 1 (n=46) or type 2 (n=37) and healthy controls (n=50).
Results Analyses identified significantly higher levels of six out of 40 cytokines in the MC type 1 group (MC1), and five in the MC type 2 group (MC2) compared with healthy controls. Six cytokines were moderately correlated with pain. Principal component analyses revealed clustering and separation of patients with LBP and controls, capturing 40.8% of the total variance, with 10 cytokines contributing to the separation. Macrophage migration inhibitory factor (MIF) alone accounted for 92% of the total contribution. Further, receiver operating characteristics analysis revealed that MIF showed an acceptable ability to distinguish between patients and controls (area under the curve=0.79).
Conclusions These results suggest that cytokines may play a role in LBP with MCs. The clinical significance of the findings is unknown. MIF strongly contributed to clustering of patients with LBP with MCs and controls, and might be a biomarker for MCs. Ultimately, these results may guide future research on novel treatments for this patient group.
- cytokines
- low back pain
- inflammation
Data availability statement
Data are available upon reasonable request.
This is an open access article distributed in accordance with the Creative Commons Attribution Non Commercial (CC BY-NC 4.0) license, which permits others to distribute, remix, adapt, build upon this work non-commercially, and license their derivative works on different terms, provided the original work is properly cited, appropriate credit is given, any changes made indicated, and the use is non-commercial. See: http://creativecommons.org/licenses/by-nc/4.0/.
Statistics from Altmetric.com
Key messages
What is already known about this subject?
Low back pain (LBP) is the leading cause of disability worldwide, but the aetiology remains poorly understood.
Vertebral endplate bone marrow lesions visualised on MRI as Modic changes (MCs) may be associated with LBP and there is evidence for inflammatory mediators being involved in the development of MCs.
What does this study add?
These results suggest that proinflammatory cytokines play an important role in MCs.
How might this impact on clinical practice or further developments?
The cytokine macrophage migration inhibitory factor strongly contributed to clustering of patients with LBP with MCs, and is a promising biomarker of LBP subgroups.
Our results can guide research on potential treatment options for this patient group.
Introduction
Low back pain (LBP) poses a substantial burden on patients and society.1 However, the aetiology remains poorly understood,2 and treatment options offer only small to moderate effects.3 4 A current research focus is identifying subgroups among patients with non-specific LBP that could benefit from specific treatments.5 6
Modic changes (MCs) are common MRI findings in patients with chronic LBP (cLBP).7 They are defined as three subsets; MC1 (oedema type), MC2 (fatty type) and MC3 (sclerotic type),8 with MC1 especially linked to LBP,9 but the association is inconsistent.10 In spite of the inconsistencies, MCs have been suggested a relevant cLBP phenotype.9 11 12
To refine clinical cLBP phenotypes and understand the underlying mechanisms leading to cLBP, one approach is to study the molecular signature of suggested subgroups. Finding relevant biomarkers could be a fast and inexpensive method to diagnose and predict prognosis, understand the underlying pathogenesis and guide future research on targeted therapeutic interventions.
Inflammatory mediators like cytokines may play a role in the development of MCs.13 14 As cytokines can reflect the local or systemic inflammatory state, they may serve as clinical biomarkers. Few studies have investigated systemic cytokine profiles (plasma or serum levels) in patients with cLBP with MCs. A case-control study found no difference in serum markers of inflammation between patients with cLBP with MC1 and without MCs.15 Biomarkers related to disc resorption and bone marrow fibrosis have been correlated with the presence of MCs.16 A recent study comparing serum biomarkers between patients with cLBP with MCs and healthy controls reported that several cytokines were suppressed in serum among patients with MC.17 Some studies report upregulation of cytokines in the disc in MCs,14 18–20 but no serum biomarker is established for MCs.
The primary purpose of this exploratory study was to evaluate systemic levels of proinflammatory cytokines in patients with cLBP and MC1 or MC2 compared with levels in healthy controls. We also wanted to assess differences in serum cytokine profiles between people with cLBP and MC1 and MC2 and associations between specific cytokines and pain
Materials and methods
Study population
This case control study uses baseline data on a subsample of patients from the Antibiotics in Modic Changes (AIM) study, a randomised, placebo-controlled trial investigating the effect of antibiotics in patients with cLBP and MC1 or MC2.21 Patients were recruited to the AIM study from outpatient clinics at six participating hospitals in Norway between June 2015 and September 2017. Eligible participants were 18–65 years with LBP lasting for more than 6 months, had MC1 or MC2 verified on MRI and LBP intensity score (on a Numerical Rating Scale (NRS) 0–10) of ≥5. A standardised 1.5 T baseline MRI had to confirm MCs with height ≥10% of vertebral height and diameter >5 mm at the level of a previous lumbar disc herniation (index level). Patients were excluded if a specific diagnosis could explain their cLBP (eg, tumour, fracture, spondyloarthritis, infection, spinal stenosis) or they had undergone former low back surgery (L1–S1) for other than disc herniation or surgery for disc herniation <12 months before inclusion. Full details of the AIM study and the MRI evaluations have been published elsewhere.21 22
For the cytokine study, MC1 had to be the most extensive MC type at two or more index level endplates (MC1) or MC2 but not MC1 had to be present at the index level (MC2). A total of 83 patients (MC1 (n=46) or MC2 (n=37)) were found eligible for this study.
Sex and age-matched healthy controls (n=50) were recruited from blood donors at Oslo University Hospital. Subjects with previous back surgery or any history of back pain or stiffness lasting for >3 months the last year were excluded from participation. Patients and controls were included after written informed consent.
Clinical procedures
Questionnaires filled out at baseline in the AIM study were used to assess LBP and psychological factors; for example, NRS, Roland Morris Disability Questionnaire, Oswestry Disability Index, EuroQol-5D, Fear-Avoidance Beliefs Questionnaire, Hopkins symptom checklist.23–26 The LBP intensity was measured as a mean of three NRS (0–10) assessments; current LBP, the worst LBP within the last 2 weeks, and usual/mean LBP within the last 2 weeks.
Blood sampling
Venous blood was collected from AIM participants at screening, and from healthy controls when donating blood. Blood was collected in BD vacutainer® tubes with no additives and stored in room temperature for 45 min before centrifugation at 2000g for 10 min at room temperature. Serum was immediately aliquoted and stored at −80°C prior to cytokine analysis.
Cytokine analysis
Duplicate serum analysis by a 40-plex Pro Human Chemokine multi-bead assay (Bio-Rad, Norway) was used to assess the concentrations of 40 cytokines in patients and control subjects (table 1). The panel was chosen as it included cytokines that previously has been linked to MCs as interleukin (IL)1-β), tumor necrosis factor alpha (TNF-α), C-X-C Motif Chemokine Ligand 5 (CXCL5), granulocyte-macrophage colony-stimulating factor (GM-CSF), IL-6, IL-8 and macrophage migration inhibitory factor (MIF).18 20 27 28 Data were recorded with a Luminex IS 100 instrument (Bio-Rad, Hercules, California, USA) and protein concentrations were determined using recombinant standard curves. The following cytokines were analysed: (TNF-α), interferon gamma (IFN-γ), IL-1β, IL-2, IL-4, IL-6, IL-8, IL-10, IL-16, GM-CSF, MIF, C-C motif ligand(CCL)1, CCL2, CCL3, CCL7, CCL8, CCL11, CCL13, CCL15, CCL17, CCL19, CCL20, CCL21, CCL22, CCL 23, CCL24, CCL25, CCL26, CCL27, CXCL1, CXCL2, CXCL5, CXCL6, CXCL9, CXCL10, CXCL11, CXCL12, CXCL13, CXCL16 and C-X3-C Motif Chemokine Ligand 1 (CX3CL1). Only cytokines with less than 20% missing values were included in further analyses. CXCL5 was below the limit of quantification for more than half of the samples and excluded from further analysis.
Serum cytokine concentrations among patients with Modic change (MC1), MC2 and healthy controls
Statistics
All analyses were done using SPSS V.27, STATA V.16 and the R programming language (http://www.r-project.org/).
For descriptive analyses, categorical variables were reported with absolute and relative frequencies and continuous variables with mean and SD. To assess differences we used χ2 test for categorical variables and t-test or analysis of variance for continuous variables.
Normal distribution of cytokines was assessed by the Shapiro-Wilk test. All cytokine values were standardised using log transformation to enable comparable data in the downstream analyses. We used Bonferroni correction to adjust for multiple testing when comparing cytokine levels between groups, leading to a marginal level of 0.001.
Correlations between cytokines and LBP intensity score (NRS) were assessed by the Spearman rank test (correlation coefficient 0.00–0.19 ‘very weak correlation’, 0.20–0.39 ‘weak correlation’, 0 .40–0.59 ‘moderate correlation’, 0.60–0.79 ‘strong correlation’, 0.80–1.0 ‘very strong correlation’).29
Clustering analyses were performed using the complex heatmap R package to identify potential clustering of individuals and cytokines.30 To identify grouping of patients based on serum cytokine levels, we splitted the heatmap using k-means partitioning of patients and hierarchical clustering of cytokines. We used complete linkage of Euclidean distance for individuals and Pearson correlation for cytokines. The clustering was performed separately on all data (patients and controls, n=133), and on patients only (n=83) to explore potential clustering of subgroups among patients. Differences in clinical features between identified clusters were explored by Kruskal-Wallis test for continuous variables and χ2 test for categorical variables.
Principal component analysis (PCA) was computed using the prcomp function in the stats V.3.6.2 R package. Visualisation and interpretation of the PCA were done using functions implemented in the factoextra R package. The cumulative proportion of the variance was explored by ordering the eigenvalues in scree plots. The contribution to the principal components (PCs) and the quality of the representation of the individual cytokines were assessed using the loadings and the cos2 (square cosine, squared coordinates), respectively.
Receiver operating characteristics (ROC) analyses were performed to evaluate performance and the summary of accuracy calculated as the area under the curve (AUC) of identified cytokines.
Results
Clinical characterisation of the samples
Data from 83 cases (n=46 MC1 and n=37 MC2) and 50 controls were included in the analyses. Baseline characteristics of patients are shown in table 2. In the control group 44% were men, and the average age was 44 (±9.9) years.
Characteristics of patients with Modic change (MC1) and MC2
Comparison of individual cytokine levels
Comparison of serum cytokine levels between MC1, MC2 and healthy controls is presented in table 1. We found that six cytokines (CCL27, CX3CL1, IL-6, IL-16, CCL20 and MIF) were statistically significantly elevated in serum in the MC1 group compared with the healthy control group (p=<0.001). Five of these were also increased in the MC2 group; CCL27, CX3CL1, IL-6, IL-16 and MIF. We found no significant differences between MC1 and MC2.
Correlations between cytokines and pain
Six cytokines showed a moderate association (r=0.40–0.59) with LBP intensity (NRS), IL-6 (r=0.41, p<0.001), CCL22 (r=0.41, p<0.000), CCL20 (r=0.41, p<0.000), CCL27 (r=0.45, p<0.000), CX3CL1 (r=0.44, p<0.000) and IL-16 (r=0.49, p<0.000). Four had a weak correlation: (r=0.20–0.39); CCL26 (r=0.31, p<0.000), CCL19 (r=0.30, p=0.001), CXCL13 (r=0.32, p<0.000) MIF (r=0.38, p<0.000).
Clustering analyses
Patients and controls formed three distinct clusters as shown in figure 1. Cluster 1 contains a predominance of patients, cluster 2 includes both patients and controls, whereas cluster 3 mainly controls. The heatmap reveals an overall higher level of cytokine serum levels in patients (clusters 1 and 2). We found no distinct clusters of cytokines. The heatmap with patients only formed four distinct clusters, where clusters 1 and 2 showed higher serum levels of cytokines (figure 2). There is no significant difference in distribution between clusters when it comes to age (p=0.11), body mass index (BMI) (p=0.65), sex (p=0.34), LBP intensity (p=0.52), duration of LBP (p=0.44), emotional distress (Hopkins symptom checklist) (p=0.72), quality of life score (EQ-5D) (p=0.96) nor non-steroidal anti-inflammatory drugs (NSAIDs)-use (p=0.73). However, there was a significant difference in distribution of smokers (p=0.002) and C reactive protein (CRP) (p=0.02), with a larger proportion of smokers in cluster 2 compared with cluster 3. Cluster 1 has a significant higher baseline CRP than the other three clusters.
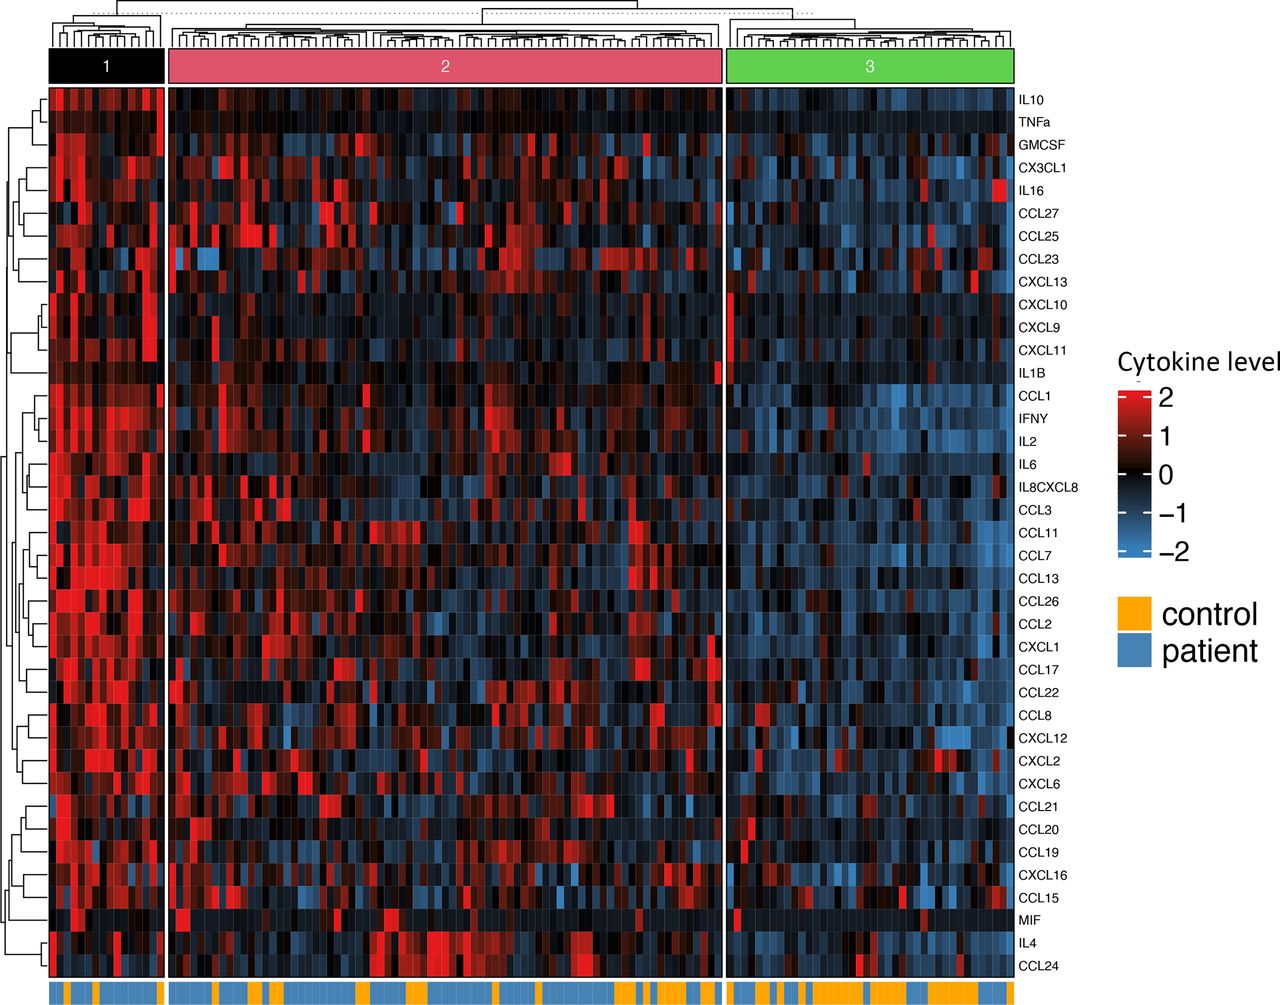
Heatmap of cytokine serum concentrations including patients and controls. Rows representing cytokine levels and columns representing individuals. Cells are colour scaled according to the cytokine concentration (Blue=low, red=high).

Heatmap of cytokine serum concentrations including patients only. Rows representing cytokine levels and columns representing individuals. Cells are colour scaled according to the cytokine concentration. (Blue=low, red=high). Modic change (MC) types are coloured black (MC1) and grey (MC2).
Principal component analysis
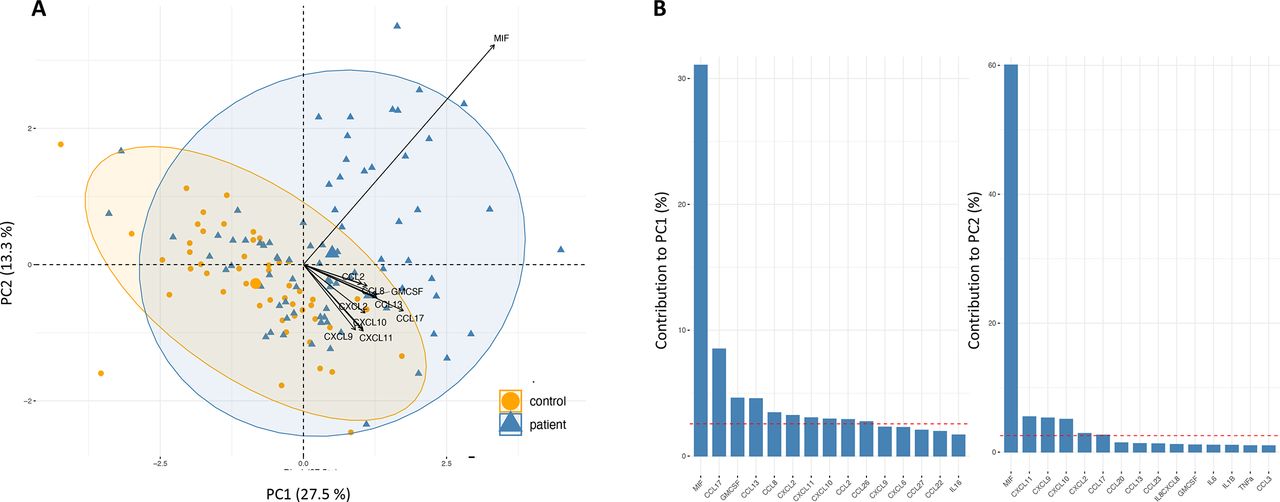
PCA of the total data (n=133 samples and n=39 cytokines) revealed separation of patients and controls (figure 3A), where a proportion of the patients and controls overlap. The clustering of patients and controls capture 40.8% of the overall variance explained by the first two PCs (figure 3A). Ten cytokines contributed to this separation of patients from controls (figure 3B). Interestingly, the MIF cytokine alone accounted for 92% of the total contribution (figure 3B) represented with high quality (cos2 close to 1).

(A) Principal component analysis biplot of serum cytokine levels in HCs (n=50) and Modic change (MC) type 1 (n=37) and MC type 2 (n=46) showing the healthy controls' individual scores as orange circles, and patients’ individual scores as blue triangles in the first principal component (PC1) and second principal component (PC2), as well as cytokine loadings as black arrows. (B) The two first PCs are plotted with the proportion of variance explained by each component indicated next to the axis label.
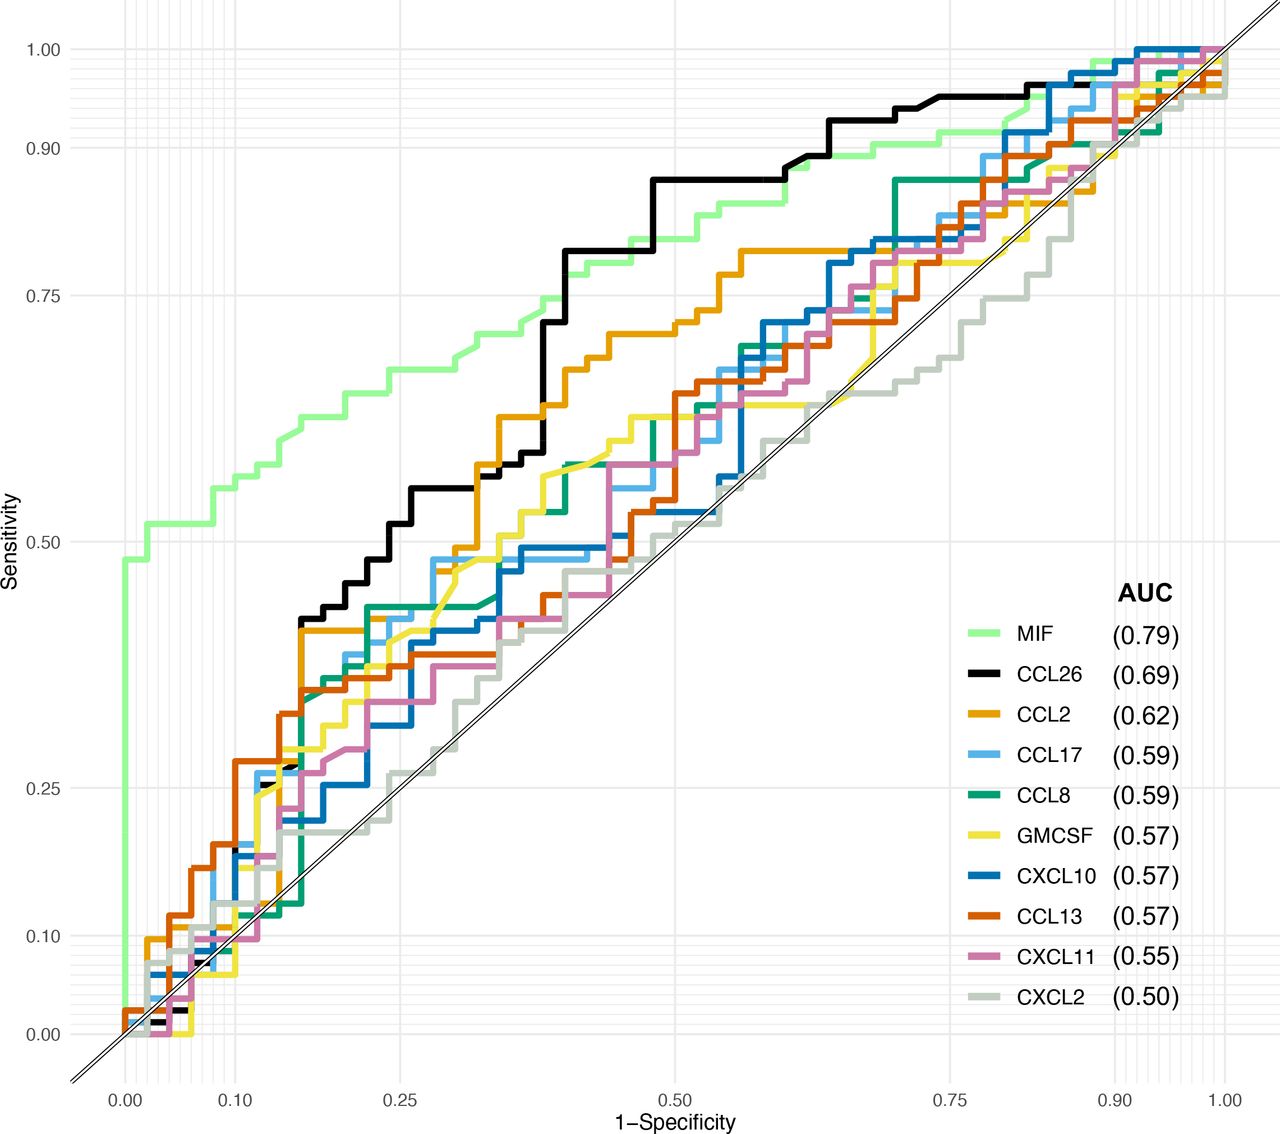
Receiver operating characteristics
ROC analyses showed that MIF has an acceptable ability (0.7–0.8) to distinguish between patients and controls with an AUC of 0.79 (0.71–0.86) (figure 4). None of the other cytokines that contribute to separation of patients from controls in the PCA demonstrate ability or accuracy as a predictive biomarker.
Receiver operating characteristic analyses of the 10 cytokines that contribute to the separation of patients and control. AUC, area under the curve; MIF, macrophage migration inhibitory factor.
Discussion
In the present study, we found elevated serum levels of several cytokines in patients with MCs, some previously linked to MCs, degenerative disc or LBP. Our results support that inflammatory mediators play a role in cLBP with MCs.
There were, however, no significant differences between the MC groups, and serum cytokine profiling could not distinguish between the two groups. This finding is in accordance with a recent study of cytokine profiles in patients with MC.17 Biopsies of MCs have indicated that inflammatory changes may be present in both MC types27; hence, elevated levels of proinflammatory cytokines may be present in both MC1 and MC2. Also, patients classified as MC1 group in our study could have concomitant MC2, which may explain why there was no difference between the groups. Furthermore, as we did not have MRI of the upper spine, we cannot rule out that both MC types are present also for patients categorised as MC2. Other explanations for not finding specific MC1 and MC2 serum cytokine profiles could be insufficient statistical power.
We found significantly higher serum concentration of MIF in patients with MC1 or MC2 than healthy controls, and MIF was weakly correlated with pain. MIF is a proinflammatory cytokine previously associated with MCs,31 and our findings underscore the role this cytokine may play in MCs. Interestingly, the results from the PCA show that MIF contributes with most of the variation in the cytokine dataset between patients and controls. MIF has been linked to autoimmune diseases including axial spondyloarthritis,32 osteoarthritis (OA)33 and rheumatoid arthritis.34 MIF has also been implicated in the development of osteoporosis.35 36 Although the role of MIF in bone resorption is not fully understood, other inflammatory mediators like TNF-α have important effects, and MIF has been identified as an upstream regulator of TNF-α.36 Both MC1 and MC2 demonstrate active bone lesions,13 and previous studies have related expression of pro-osteoclastogenic biomarkers to MCs.19 27 The known role of MIF in inflammation and bone turnover makes this cytokine highly relevant for MCs. Another interesting aspect is that MIF expression plays an important role in T-cell regulation and is necessary in the pathway leading to T-cell activation.37 This is relevant as T-cells have been implicated in animal models of MC1.38 39 Our results point to MIF as a promising candidate for a future panel of MC biomarkers as MIF is the major contributor to the separation of patients and controls, and the ROC analysis indicates that it has an acceptable ability to differentiate between healthy controls and MCs. However, MIF is not specific for MCs as elevated serum levels of this cytokine have been linked to several other diseases.40 41
The serum concentration of IL-6 and CX3CL1 was also increased in the MC groups. Both cytokines also showed a moderate positive correlation with LBP intensity. IL-6 is increased in LBP,42 has been implicated in the pathogenesis of MCs,13 38 43 and pain models link IL-6 to rapid excitatory signalling in dorsal root ganglion neurons,44 45 nociceptor sensitisation, central sensitisation and pain generation.46–48 Our results support a link between IL-6, MCs and pain. CX3CL1 plays an important role in induction and maintenance of inflammatory pain.49 It has to our knowledge not been linked to MCs but to sciatica.50 Interestingly, CX3CL1 has recently been reported to hold a key role in osteoclastic recruitment and subsequent bone resorption.51 52 Hence, CX3CL1 could be involved in the pain generation in MCs, but also stimulate vertebral osteoclasts.
CCL20 was significantly increased in serum from patients with MC1 in our study. CCL20 induces proinflammatory and matrix degradative responses in cartilage, and may play a role in the pathogenesis of OA.53 The finding of this cytokine in serum in patients with OA may be relevant as the bone marrow lesions in knee OA share characteristics with MC lesions.13
When comparing cases with healthy controls we did not find a significant difference between the levels of CCL17 or GM-CSF. However, the PCA analyses show that these cytokines contribute to the separation of patients and controls. GM-CSF and CCL17 interact and the GM-CSF-CCL17-axis plays a role in models of arthritis and OA development54 and increased levels of GM-CSF has been reported in intervertebral discs with MCs.18
In the analyses comparing patients with MC and healthy controls, we found that the serum levels of IL-16 and CCL27 was significantly higher in MC1 and MC2 compared with controls. The PCA revealed that CXCL9, CXCL10 and CXCL11 contributed to the separation of patients and controls. These cytokines have not been associated with MCs or LBP; however, CXCL10 is linked to the development of neuropathic pain.55 56
We found small to moderate correlations between some cytokines and LBP intensity. These correlations could be reduced by a narrow spectrum of LBP intensity in our sample (eg, inclusion criteria >5).57 The findings should be interpreted in light of the multiple factors associated with non-specific LBP and the usual heterogeneity of patients with LBP.58
In the clustering analysis, we did not observe clustering according to MC groups. This is compliant with the results of no difference in serum cytokine profiling between the MC groups, and may underscore that there is no difference between the two groups. These results may also suggest that the difference in cytokine profiles between cases and controls is due to cLBP and not to MCs. For the clustering analysis only including patients and cytokines, we explored the differences between clusters to understand how patients with overall higher serum cytokine concentrations differed from those with lower levels. Several factors like age, BMI, gender, NSAIDs-use, smoking habits and comorbidities could influence cytokine levels. We found a higher proportion of smokers in cluster 2; otherwise, there was no difference in demographical or clinical features between clusters. Also, we found higher levels of CRP in cluster 1, compared with clusters 2, 3 and 4 that might indicate a more inflammatory subgroup, which is in accordance with a study reporting higher levels of high-sensitivity CRP in some patients with MC1.59 The four clusters could be linked to underlying aetiologies of MCs. The PCA showed that levels of the MIF-cytokine explained most of the overall variation separating patients with MC from controls. However, there could also be other unmeasured factors (lifestyle, environmental causes or others) contributing to the clustering and separation between healthy controls and MCs.
Identifying a single biomarker predictive of MCs seems unlikely. However, finding a biomarker panel for MCs could help guide clinical decision making for this patient group and guide future research on therapies. We have found potential novel serum biomarkers for MCs, where MIF especially is a promising candidate together with CX3CL1. Our results strengthen the hypothesis that MCs are related to inflammation. MIF’s role in the pathogenesis of MCs, and its ability to predict MCs and possible role as a future biomarker would be interesting to explore in other populations and further studies.
Strengths of our trial are that we have a large sample size compared with previous studies, and all analyses were done using established, validated measurement assays. However, interpretation of our results is limited as we have not replicated the findings in a second cohort. Another major limitation to our study is that we did not have MRI of the control group, or a control group with cLBP without MCs. Previous studies have shown that about 6% of the population not suffering from LBP have MCs. Furthermore, proinflammatory cytokines have previously been linked to disc herniation and LBP and subsequently our results’ specificity for MCs is uncertain. Unfortunately, we only have information about sex and age for the control group, and could not adjust for other known confounders such as BMI, comorbidities or smoking that may influence the results. Also, cytokines have a diurnal variation, while blood sampling was not set to a certain time point, which is not ideal. Another limitation is that we have used a standard proinflammatory panel for analyses of cytokines. There might be other cytokines implicated in the pathogenesis of MCs that were not measured, possibly with the ability to differentiate MC1 and MC2. The strict significance level at 0.001 when comparing cytokine levels between groups increases the possibilities of type 2 errors. However, not restricting the analyses to cytokines previously linked to MCs may expand the understanding of underlying pathomechanisms.
In conclusion, the results from the present study indicate that inflammatory mediators play a role in the development of MCs and point to MIF as a potential biomarker.
Supplemental material
Data availability statement
Data are available upon reasonable request.
Ethics statements
Ethics approval
Regional Committees for Medical Research Ethics in South East Norway Reference number 2014/158.
Acknowledgments
We would like to thank all participants from the AIM study and blood donors at Oslo University Hospital, the AIM study group and Klinbeforsk (#2017201) for funding.
References
Supplementary materials
Supplementary Data
This web only file has been produced by the BMJ Publishing Group from an electronic file supplied by the author(s) and has not been edited for content.
Footnotes
Contributors All authors read and approved the final manuscript. EG has made substantial contributions to conception, design, statistical analysis and drafting the work. KG has made substantial contributions to design of the work, statistical analysis and revision of the article. GG has made substantial contributions to design of the work and revision of the article. LCHB has made substantial contributions to conception, design and revision of the article. MW has contributed with blood sampling and substantively revised the work. HCDA has made substantial contributions by doing cytokine analysis and revision of the article. MDV has substantively revised the work. ES has substantively revised the work. LMP has substantively revised the work. AHP has contributed with statistical expertise and has substantively revised the work. KS has contributed to conception, design and has substantively revised the work. KKS has contributed to design and has substantively revised the work. JAZ has made substantial contributions to design of the work and revision of the article.
Funding This study was funded by KLINBEFORSK (Grant number: 2017201); Helse Sør-Øst RHF (Grant number: 2015090); Helse Vest (Grant number: 911938 and 911891).
Competing interests LG has received honoraria from AbbVie, Boehringer Ingelheim, Celltrion, Novartis, Lilly, Orion Pharma, Pfizer, and Sandoz, outside the submitted work.
Provenance and peer review Not commissioned; externally peer reviewed.