Article Text

Abstract
Objectives To describe the relations between baseline clinical characteristics of the Applied Public-Private Research enabling OsteoArthritis Clinical Headway (IMI-APPROACH) participants and their predicted probabilities for knee osteoarthritis (OA) structural (S) progression and/or pain (P) progression.
Methods Baseline clinical characteristics of the IMI-APPROACH participants were used for this study. Radiographs were evaluated according to Kellgren and Lawrence (K&L grade) and Knee Image Digital Analysis. Knee Injury and Osteoarthritis Outcome Score (KOOS) and Numeric Rating Scale (NRS) were used to evaluate pain. Predicted progression scores for each individual were determined using machine learning models. Pearson correlation coefficients were used to evaluate correlations between scores for predicted progression and baseline characteristics. T-tests and χ2 tests were used to evaluate differences between participants with high versus low progression scores.
Results Participants with high S progressions score were found to have statistically significantly less structural damage compared with participants with low S progression scores (minimum Joint Space Width, minJSW 3.56 mm vs 1.63 mm; p<0.001, K&L grade; p=0.028). Participants with high P progression scores had statistically significantly more pain compared with participants with low P progression scores (KOOS pain 51.71 vs 82.11; p<0.001, NRS pain 6.7 vs 2.4; p<0.001).
Conclusions The baseline minJSW of the IMI-APPROACH participants contradicts the idea that the (predicted) course of knee OA follows a pattern of inertia, where patients who have progressed previously are more likely to display further progression. In contrast, for pain progressors the pattern of inertia seems valid, since participants with high P score already have more pain at baseline compared with participants with a low P score.
- knee osteoarthritis
- outcome and process assessment
- health care
- epidemiology
Data availability statement
Data are available on reasonable request. In order to gain and govern access to the central APPROACH databases, tranSMART and XNAT, access has to be approved by the APPROACH Steering Committee.
This is an open access article distributed in accordance with the Creative Commons Attribution Non Commercial (CC BY-NC 4.0) license, which permits others to distribute, remix, adapt, build upon this work non-commercially, and license their derivative works on different terms, provided the original work is properly cited, appropriate credit is given, any changes made indicated, and the use is non-commercial. See: http://creativecommons.org/licenses/by-nc/4.0/.
Statistics from Altmetric.com
Key messages
What is already known about this subject?
The Applied Public-Private Research enabling OsteoArthritis Clinical Headway (APPROACH) cohort study is a 2-year observational study using a unique, multistep selection of participants, to include people with an increased likelihood of structural progression and/or pain progression.
What does this study add?
This study provides the clinical characteristics (demographics, radiographic features and pain severity) of the selected patients in the IMI-APPROACH prospective cohort in relation to their scores for predicted structural progression and pain progression.
How might this impact on clinical practice or further developments?
In the IMI-APPROACH cohort, patients who have experienced structural progression previously are less likely to display further structural progression, whereas participants that already have more pain are more likely to have progressive pain.
Introduction
One of the major challenges in knee osteoarthritis (OA) clinical trials is the selection of patients. Because actual cure is not anticipated, patients who will sufficiently progress without intervention are needed to provide an opportunity to observe arrest or reduction of disease progression. The Food and Drug Administration and European Medicines Agency still define OA progression by radiographic joint space narrowing (structural progression) and by progressive or sustained significant pain (pain progression).1 2 Since progression in OA is on average (very) slow, without preselection of fast progressive patients, clinical trials require large group sizes and long follow-up. The course of knee OA might follow a pattern of inertia, meaning that knees that are progressing are more likely to continue to progress, and stable knees are more likely to remain unchanged.3 Unfortunately, at the moment of inclusion in a clinical trial, it is usually not known how the OA progressed in the years previous to inclusion and with that progression during the trial period is difficult to predict.
Despite efforts over the past decades to develop markers of disease, imaging procedures and biochemical marker analyses need to be improved and possibly extended with more specific and sensitive methods to reliably describe disease processes, to diagnose the disease at an early stage, to classify patients according to their prognosis and to follow the course of disease and treatment effectiveness. The Innovative Medicines Initiative - Applied Public-Private Research enabling OsteoArthritis Clinical Headway (IMI-APPROACH) consortium has set up a broad database of different OA patients and a longitudinal cohort to combine conventional and new disease markers, and identify different OA phenotypes. The APPROACH cohort study is a 2-year observational study using a unique, multistep selection of participants, to include people with an increased likelihood of structural progression and/or pain progression.4 Structural progression was defined as a reduction in Joint Space Width (JSW) of ≥0.3 mm per year over a period of 2–3 years (0.7 mm has been described as the minimal detectable difference in radiographic JSW).5 Pain progression was defined as at least one of the three following: Knee Injury and Osteoarthritis Outcome Score (KOOS) pain (on a 0–100 point scale; 100 being the worst) increase ≥5 points/year with a pain level ≥40 at 2 years, or KOOS pain increase ≥10 points/year with a pain level ≥35 at 2 years or a pain level ≥40 at both baseline (BL) and 2 years. The participants were selected from existing OA cohorts (CHECK (Cohort Hip & Cohort Knee),6 HOSTAS (Hand OSTeoArthritis in Secondary care),7 MUST (Musculoskeletal pain in Ullensaker STudy),8 PROCOAC (PROspective COhort of A Coruña)9 and DIGICOD (DIGItal COhort Design)),10 or from outpatient departments (in case the original cohort did not provide sufficient participants. As a first step, historical data were used to train machine learning (ML) models to provide a S(tructural) and P(ain) progression score for each individual, reflecting the probability to become a ‘progressor’ on these outcomes.4 So the S and P progression score represent throughout the manuscript the predicted progression, not the actual progression. These predicted progression scores were combined into one ranking score which orders patients by the likelihood of progression in general, throughout the manuscript described as ranking score. Participants with the highest rank were selected for a screening visit and ranked again using collected up-to-date information on disease status (demographics, radiographs and questionnaires). Then 75% of the screened participants with the highest rank (most likely to progress) were included in the study. As a consequence, each included participant was assigned a S progression score, P progression score and a ranking score.
The predictions of the final ML model are based on cross-sectional data of patients at the moment of or shortly before inclusion in the cohort, viz. BL data. Participants are subsequently followed for 2 years which is at present ongoing, to study actual progression with the use of a large number of conventional and exploratory measures. Irrespective of the actual progression, this analysis provides the clinical characteristics (demographics, radiographic features and pain severity) of the selected patients in the IMI-APPROACH prospective cohort in relation to their S progression, P progression and ranking score. The present study provides insight in the actual values of these BL parameters, and with that the clinical characteristics of predicted S and/or P progressors.
Methods
Patient selection
In this analysis, all included participants (n=297) of the IMI-APPROACH study were used. The study protocol and the general cohort profile have been described previously.11 Age (mean 66.5 years, SD 7.1), body mass index (BMI) (mean 28.1, SD 5.3), sex (female/male ratio 230/67, and ethnicity (Caucasian/white, black/African American, Asian or other) as well as structural damage and pain were included in the current analyses.
Evaluation of structural damage
Posterior–anterior weight-bearing semiflexed knee radiographs were obtained according to the protocol of Buckland-Wright et al.12 These radiographs were graded according to Kellgren and Lawrence (K&L grade)13 and evaluated by Knee Image Digital Analysis.14 Minimum JSW (minJSW) in mm, osteophyte area (mm2), and subchondral bone density (mm Aluminium Equivalents; Alu Eq.) were used for analyses.
Pain evaluation
Pain was evaluated using a Numeric Rating Scale (NRS) and the pain subscore of the KOOS.15 This subscore is calculated from nine questions, each with a 5-point Likert scale. It is normalised to a 0–100 range, where 0 means maximal limitations (maximal pain) and 100 means no limitations (no pain).
Statistical analysis
IBM SPSS Statistics V.25.0.0.2 was used for statistical analysis. BL data are presented in relation to the S progression, P progression and final ranking score. Pearson correlation coefficient was used to determine correlations between progression/ranking scores and clinical, structural and demographic variables. Correlations were considered weak when r<0.3, moderate when 0.3≥r <0.5, and strong when r≥0.5. Additionally, patients were partitioned into three equal size groups (tertiles) with low, medium, and high values of the scores. BL clinical, structural and demographic characteristics were compared between patients with lowest (one-third) or highest (one-third) scores using T-test (continuous variables) or χ2 test (categorical variables). For all tests, a p<0.05 was considered statistically significant.
Results
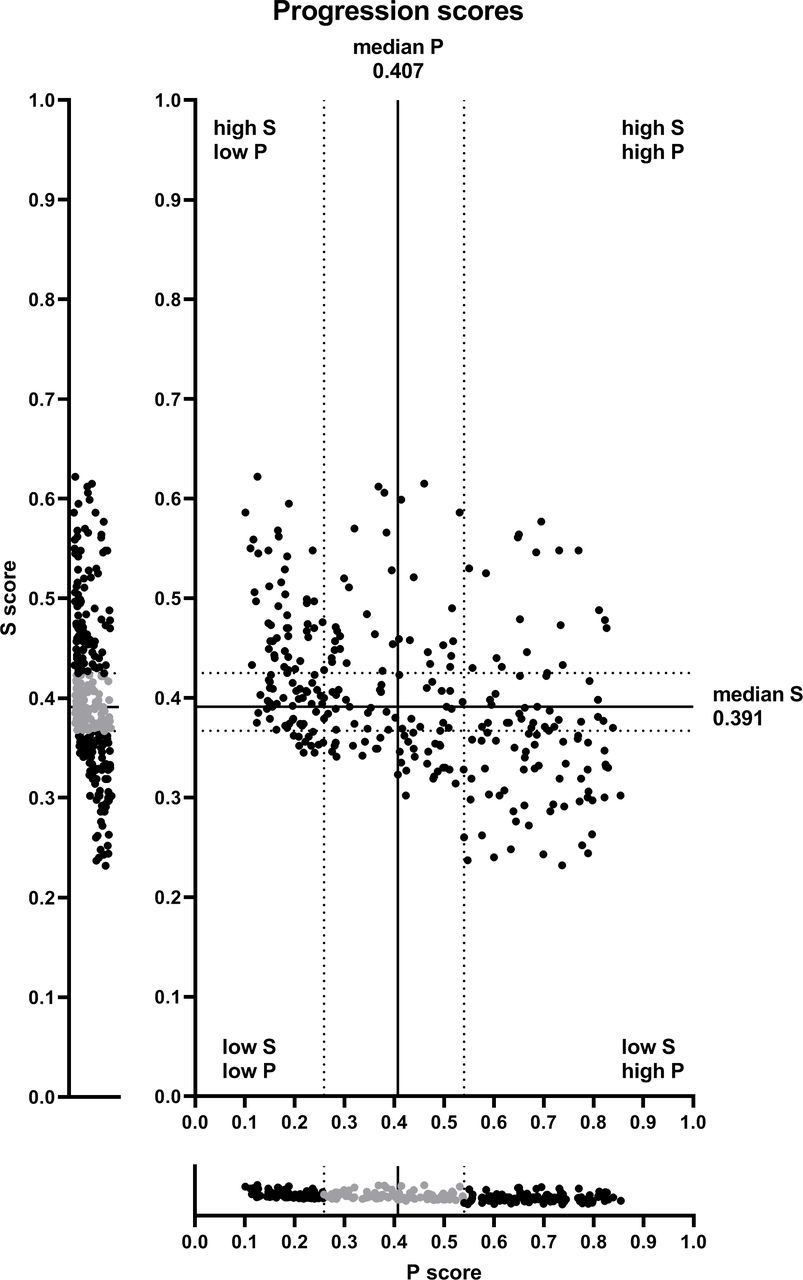
Figure 1 shows the individual S and P progression scores of all 297 participants.

Combined distribution of the S progression and P progression scores of all participants.Solid lines indicate median values of S progression score (0.391) and P progression score (0.407). Dotted lines indicate tertile borders (0.367 and 0.425 for S score, 0.259 and 0.540 for P score). Part of the distribution, coloured grey, is the middle tertile.
BL characteristics of participants with lowest and highest S progression, P progression or ranking scores are presented in table 1. Additional graphical representation of the relationships between S progression, P progression and ranking score and age and BMI are shown in online supplemental figure S1 (age) and online supplemental figure S2 (BMI). For majority of the characteristics, the differences between participants with the highest and lowest S progression, P progression or ranking scores are statistically significant. Age was higher in participants with the lowest S progression scores compared with participants with the highest S progression scores (p=0.029). The same trend was found for P progression scores, although not statistically significant. There was no difference in BMI for the S progression scores. The difference in osteophyte area was statistically significant different only for the P progression scores.
Supplemental material
Supplemental material
Baseline characteristics of the one-third of participants with the lowest and one-third of participants with the highest ranking, S progression or P progression score
Figure 2 shows the correlations between different progression scores (S progression, P progression and ranking score) and BL minJSW. A moderate positive correlation of the ranking score with minJSW was observed (r=0.395, p<0.001). The S progression score strongly positively correlated with minJSW (r=0.646, p<0.001), whereas the P progression score only weakly negatively correlated with minJSW (r=−0.197, p=0.001). The participants with the highest ranking scores had a statistically significant higher minJSW compared with participants with the lowest ranking scores (3.08 mm vs 2.14 mm, p<0.001). The same was observed for the S progression scores (3.56 mm vs 1.63 mm, p<0.001). In contrast, participants with the highest P progression scores had a statistically significant lower minJSW compared with participants with the lowest P progression scores (2.29 mm vs 2.99 mm, p<0.001).

Relationship between minJSW and progression/ranking scores. The middle panels of each plot show correlation between minJSW and ranking score (A), S progression score (B), and P progression score (C). Each dot represents a single participant; dots in grey show the middle tertile of the score. Left and right boxplots show the score distribution (median value with 95% CIs) of the participants in the lowest (left) and highest (right) tertile of ranking score (A), S progression score (B) and P progression score (C). minJSW, minimum Joint Space Width.
Figure 3 shows the correlations between the different progression scores (S progression, P progression and ranking score) and BL KOOS pain. A moderate positive correlation between ranking score and KOOS pain was observed (r=0.451, p<0.001). The P progression score correlated strongly positively with KOOS pain (r=0.697, p<0.001), whereas S progression score correlated weakly and negatively with KOOS pain (r=−0.212, p<0.001). Participants with the highest ranking scores had statistically significant more pain compared with participants with the lowest ranking scores (57.87 vs 75.87, p<0.001). The same was observed for P progression scores (51.17 vs 82.11, p<0.001). In contrast, participants with the highest S progression scores had statistically significant less pain compared with participants with the lowest S progression scores (69.21 vs 60.23, p<0.001).

Relationship between KOOS pain and progression/ranking scores. The middle panels of each plot show correlation between KOOS pain and ranking score (A), S progression score (B) and P progression score (C). Each dot represents a single participant; dots in grey show the middle tertile of the score. Left and right boxplots show the score distribution (median value with 95% CIs) of the participants in the lowest (left) and highest (right) tertile of ranking score (A), S progression score (B) and P progression score (C). KOOS, Knee Injury and Osteoarthritis Outcome Score.
Distribution of K&L grades is presented in figure 4. In accordance with the correlation between the S progression score and minJSW, participants with the highest S progression scores had statistically significant lower K&L grades, compared with participants with the lowest S progression scores. For ranking score and P progression score K&L grade was not statistically significantly different between groups (p=0.347 and p=0.106, respectively).

Relationship between Kellgren and Lawrence (K&L) grade and progression/ranking scores. P value was calculated using the χ2 test. Thick black line in the middle separates K&L grade 0–1 (no or doubtful radiographic damage) and K&L grade 2–4 (certain radiographic damage). APPROACH, Applied Public-Private Research enabling OsteoArthritis Clinical Headway.
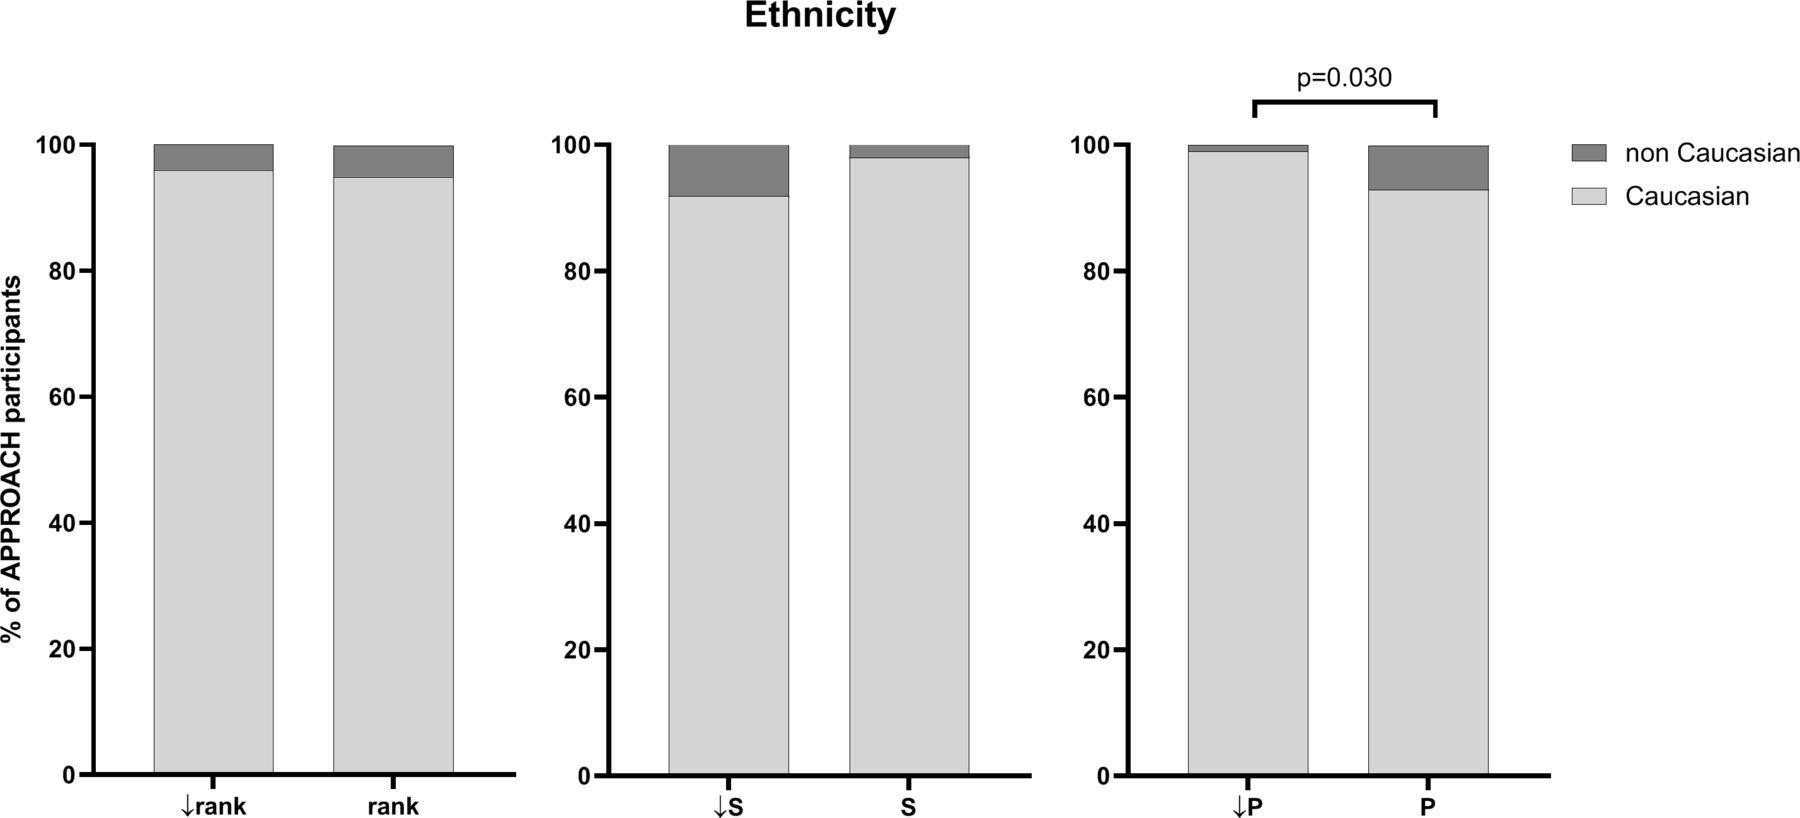
The analysis of ethnicity is presented in figure 5. The difference was statistically significant only for P progression scores (7.1% vs 1.0%). For ranking score and S progression score, ethnicity was not statistically significantly different between groups (p=0.733 and p=0.052, respectively).

Relationship between ethnicity and progression/ranking scores. P value was calculated using the χ2 test. APPROACH, Applied Public-Private Research enabling OsteoArthritis Clinical Headway.
Discussion
Within the IMI-APPROACH cohort study, a higher S progression score implicates a higher likelihood for structural progression. According to the general perception that the course of knee OA follows a pattern of inertia, participants with a higher S score were expected to have lower minJSW (since progression already happened before inclusion). However, in our analysis, the opposite was observed and participants with a high S progression score, had a statistically significantly higher minJSW and lower K&L grade, compared with participants with a low S progression score. In contrast, Halilaj et al found no differences in BL characteristics, including JSW, between fast-progressors and non-progressors within the OA Initiative (OAI) incidence cohort.16 17 The higher minJSW and lower K&L grade implicate presence of more cartilage that still can deteriorate, and therefore, provide an opportunity for structural progression. The ranking from the ML model reflects this.
For KOOS and NRS pain, the contrary was found. Participants with a high P progression score had more pain at BL compared with participants with a low P progression score. Again, in the OAI incidence cohort the contrary was found. Patients with improving WOMAC scores had more pain at BL, compared with patients with stable pain or patients with pain progression.17 The OAI incidence cohort included patients who were at high risk of developing OA during the study, while patients in the APPROACH cohort already had OA and were selected based on a high change for progression.
The likely explanation for our result lies in the definition of pain progression. While structural progression is solely based on JSW narrowing, the definition for pain progression was more complex, not only including progression but also high sustained pain over the past years. Although still speculative, most participants with a high P progression score may have been provided by patients with a high sustained score. Indeed, low pain scores reduced the probability of being a P progressor,4 supporting the idea of a pattern of inertia, but contrasting the window for change as observed for structure progression.
The ranking score, on which the patient selection was based, combines both progression scores using normalisation of the individual progression scores.4 Participants with a high ranking score had statistically significantly higher minJSW, lower K&L grade (contrasting inertia but providing a window for change), and more pain (according to the inertia concept but without the window for change regarding progression) compared with participants with a low ranking score. Although these BL characteristics seem to be counterintuitive, this combination provides potentially the best patient selection for treatment modalities that decrease pain (initially low KOOS score) and prevent, stop or slow-down structural progression (initially large JSW). With all present knowledge on treatment modalities thus far, this supports testing treatment modalities that are able to halt tissue structure damage and decrease pain. As cartilage structure repair is still challenging, this may turn out to be the best approach to patient selection for clinical trials.
The limited number of participants included in the study, made the IMI-APPROACH cohort difficult to compare different ethnicities within the non-Caucasian group. However, differences in pain severity were previously described between Non-Hispanic blacks and Non-Hispanic whites,18 19 and Asians and Caucasians.20
The main limitation of this analysis is the availability of only BL data. The predicted S, and P progression, and ranking scores used in this manuscript only represent the likelihood of becoming a progressor. The actual progression can only be evaluated when all 2-year follow-up data are available, and may enable fine-tuning or, when needed, correction of the BL predictive parameters. Nevertheless, the relationships between BL and the predicted progression, provides insights on clinical characteristics of this unique cohort.
In conclusion, the selected IMI-APPROACH cohort consists of patients with high pain levels and low structural damage, suitable for evaluation of treatment modalities that decrease pain and arrest or slow-down tissue structural damage.
Data availability statement
Data are available on reasonable request. In order to gain and govern access to the central APPROACH databases, tranSMART and XNAT, access has to be approved by the APPROACH Steering Committee.
Ethics statements
Ethics approval
The study is being conducted in compliance with the protocol, Good Clinical Practice (GCP), the Declaration of Helsinki and applicable ethical and legal regulatory requirements (for all countries involved). All participants have received oral and written information and provided written informed consent.
Acknowledgments
We thank M. Melief for performing the KIDA analysis on all radiographs.
References
Supplementary materials
Supplementary Data
This web only file has been produced by the BMJ Publishing Group from an electronic file supplied by the author(s) and has not been edited for content.
Footnotes
Contributors EMvH, MK, FJB, IKH, and FB were responsible for acquisition of data. EMvH and PMJW were responsible for all analyses. EMvH, CL, SM, JB, PW, PMJW, and FL contributed to interpretation of data and were responsible for the first draft, all authors critically revised the content. All authors approved the final version.
Funding This work was supported by the Innovative Medicines Initiative Joint Undertaking under grant agreement no 115770, resources of which are composed of financial contribution from the European Union’s Seventh Framework Programme (FP7/2007-2013) and EFPIA companies’ in kind contribution. See www.imi.europa.eu and www.approachproject.eu.
Competing interests The IMI-APPROACH project received a grant from Innovative Medicines Institute, grant agreement 115770. Outside the submitted work: CL reports other from Merck KGaA, during the conduct of the study; MK reports grants from IMI-APPROACH, grants from Dutch Arthritis Association, during the conduct of the study; other from GlaxoSmithKline, Pfizer, Merck-Serono, Kiniksa, Abbvie, outside the submitted work; FJB reports grants from Gebro Pharma, grants from BIOIBERICA, grants from AB Science, grants from Abbvie, grants from Ablynx N.V., grants from Amgen, grants from Archigen Biotech Limited, grants from Boehringer, grants from Bristol-Myers, grants from Celgene Int., grants from Eli Lilly and Company, grants from F. Hoffmann- La Roche, grants from Galapagos, grants from Gedeon, grants from Genentech, grants from Gideal Sciences, NC, grants from Glaxosmithkline, grants from Hospira, grants from INC Research UK, grants from Inventiv Health Clinical, grants from Janssen, grants from Lilly, grants from Nichi-IKO Pharmaceutical, grants from Novartis, grants from ONO Pharma, grants from Pfizer, grants from Pharmaceutical Research, grants from Regeneron, grants from Roche, grants from SA UCB Pharma, grants from Sanofi, grants from TRB Chemedica, grants from UCB Biosciences GMBH, outside the submitted work; In addition, FJB has a patent Molecular block-matching method for gel image analysis issued, a patent Targeting A Specific Receptor On Cells With A Specific Compound For Use In The Treatment And/Or The Prevention Of Osteoarthritis And Rheumatoid Arthritis pending, a patent Genetic markers for osteoarthritis issued, a patent Method for the diagnosis of osteoarthritis issued, a patent Genetic markers for osteoarthritis pending, a patent Method for the diagnosing Arthrosis pending, a patent Method for diagnosing Arthrosis pending, a patent Method for the diagnosis of osteoarthritis pending, and a patent Anti-connexin compounds for use in the prevention and/or treatment of degenerative joint diseases. pending; IKH reports personal fees from AbbVie, grants from Pfizer, outside the submitted work; FB reports personal fees from Boehringer, Bone Therapeutics, Expanscience, Galapagos, Gilead, GSK, Merck Sereno, MSD, Nordic, Novartis, Pfizer, Regulaxis, Roche, Sandoz, Sanofi, Servier, UCB, Peptinov, TRB Chemedica, 4P Pharma.
Provenance and peer review Not commissioned; externally peer reviewed.