Article Text

Abstract
Objectives Cell-free DNA is involved in the pathogenesis of systemic lupus erythematosus (SLE) but the clinical value of cell-free DNA measurements in SLE is unknown. Our aim was therefore to examine the utility of mitochondrial (mt) DNA and nuclear (n) DNA quantification in SLE.
Methods EDTA plasma was drawn from 103 consecutive patients with SLE and from 56 healthy blood donors. mtDNA and nDNA copy numbers were quantified by PCR from cell-free plasma. Clinical parameters were recorded prospectively.
Results Circulating mtDNA copy numbers were increased 8.8-fold in the plasma of patients with SLE (median 6.6×10⁷ /mL) compared with controls (median 7.6×10⁶ /mL, p<0.0001). Among all 159 individuals, a cut-off set at 1.8×10⁷ mtDNA copies in a receiver operated curve identified patients with SLE with 87.4% sensitivity and 94.6% specificity; the area under the curve was 0.95 (p<0.0001). mtDNA levels were independent of age or gender, but correlated with Systemic Lupus Erythematosus Disease Activity Index (SLEDAI) on multivariable analysis (p=0.004). Conversely, SLEDAI was associated with prednisone dose (p<0.001), anti-double stranded DNA-titres (p=0.003) and mtDNA levels (p=0.005), but not nDNA copy numbers. In 33 patients with SLE with available follow-up, the changes of mtDNA, but not those of nDNA concentrations, robustly correlated with the evolution of the SLEDAI (r=0.55, p=0.001).
Conclusions Circulating mtDNA unlike nDNA molecules are markedly increased in SLE plasma. Regardless of disease activity, circulating mtDNA levels distinguish patients with SLE from healthy controls with high sensitivity and represent an independent marker of SLE activity.
- inflammation
- autoimmune diseases
- lupus erythematosus
- systemic
Data availability statement
Data are available upon reasonable request. Data are planned to become available publicly at the Harvard Dataverse Repository.
This is an open access article distributed in accordance with the Creative Commons Attribution Non Commercial (CC BY-NC 4.0) license, which permits others to distribute, remix, adapt, build upon this work non-commercially, and license their derivative works on different terms, provided the original work is properly cited, appropriate credit is given, any changes made indicated, and the use is non-commercial. See: http://creativecommons.org/licenses/by-nc/4.0/.
Statistics from Altmetric.com
Key messages
What is already known about this subject?
Cell-free DNA is involved in the pathogenesis of systemic lupus erythematosus (SLE) but the origin of the DNA—mitochondrial (mt) or nuclear (n)—as well as the clinical value of cell-free DNA assessment in SLE are unknown.
What does this study add?
Circulating mtDNA, unlike nDNA copy numbers are markedly increased in SLE plasma, distinguish patients with SLE from controls with high sensitivity and even identify patients with quiescent SLE.
In the present study mtDNA levels unlike nDNA levels correlate tightly and better than current markers (complement levels, double stranded DNA-antibody titres) with SLE activity cross sectionally and longitudinally.
How might this impact on clinical practice or further developments?
Circulating mtDNA levels may evolve as a sensitive biomarker of SLE and a clinically useful and independent biomarker for the monitoring of SLE activity.
Introduction
Systemic lupus erythematosus (SLE) is a chronic multifactorial autoimmune disease, characterised by autoantibody formation against double stranded (ds)DNA, nucleosomes and other, predominantly nuclear antigens.1 2
There is an increasing body of evidence supporting a fundamental role of cell-free (cf)DNA in the pathogenesis of SLE.3–5 Chromosomal nuclear (n) DNA is externalised into the extracellular space by neutrophils during the formation of neutrophil extracellular traps (NETs).6 NET structures are observed in cutaneous lesions7 and renal biopsies of affected patients with SLE.8 Extracellular NET material promotes inflammation as it stimulates plasmacytoid dendritic cells (pDCs) to produce type I interferon (IFN), thereby contributing to the breakdown of peripheral tolerance and promoting the activation of autoreactive T-cells and B-cells.9 10
Mitochondrial (mt)DNA is a dsDNA molecule which is phylogenetically derived from bacteria and also rich in hypomethylated CpG sequences. mtDNA can also trigger a broad range of proinflammatory signalling pathways,7–10 using endosomal toll-like receptor (TLR)9 and cytosolic sensors.3 4 6 mtDNA can like chromosomal DNA be released into the extracellular space during NET formation where it can contribute to the type Ι IFN signature of patients with SLE, promote lupus flares and systemic immune-mediated organ injury.10 The mechanisms governing the differential release of nDNA or mtDNA by NETosis into the circulation of patients with SLE are not defined.
The pathogenesis of SLE may therefore be driven by circulating cf nDNA or cf mtDNA, or both cfDNA ‘species’.8 11 12 As the clinical value of cfDNA quantification in SLE is still unknown, the aim of the present study was to examine the abundancy of mtDNA and nDNA in plasma of patient with SLE and to assess if cf nucleic acid quantification is useful in the diagnosis and monitoring of SLE and the understanding of its pathogenesis.
Methods
Study design
The present study used individual patient-level clinical and biological data from adult patients consecutively recruited at the tertiary care centres in Basel and Freiburg in order to prospectively evaluate the potential use of mtDNA and nDNA copy numbers as potential biomarkers in SLE. Clinical information and reference standard results were available to the performers of the quantitative PCR (qPCR) testing. The Standards for Reporting of Diagnostic Accuracy (STARD) checklist for this study is provided in online supplemental table S1.13
Supplemental material
Study subjects
After ethics committee approval, adult patients classified as SLE14 and attending our tertiary care centres at the University Hospital Basel, Department of Rheumatology and the Medical Center of the University of Freiburg, Department of Rheumatology and Clinical Immunology, were consecutively recruited from August 2019 to May 2021, provided that written informed consent was obtained. Active systemic infections, recent major trauma or surgery, malignancy and concomitant systemic inflammatory autoimmune diseases were excluded as potential confounders of circulating DNA levels.15 16 Patients’ arterial blood pressure was measured. SLE activity was scored by means of the Systemic Lupus Erythematosus Disease Activity Index (SLEDAI-2k).17 We also prospectively collected patient plasma at follow-up visits. Healthy adult volunteer blood donors were recruited from the Basel University Hospital blood bank and the personnel of our departments. They served as controls.
All procedures were in accordance with the Helsinki Declaration of Good Clinical Practice.18 All patients and healthy controls provided written informed consent.
Isolation of total DNA from plasma and quantification of circulating DNA copy numbers
In all subjects, 7 mL of venous peripheral blood was collected in an EDTA tube and processed in accordance with previously established guidelines.19 Briefly, platelet poor plasma was obtained within 4 hours after blood collection by means of two consecutive centrifugation steps: a first at 1200 g for 10 min and a second at 16 000 g for another 10 min at room temperature. The platelet poor plasma was carefully collected without disturbing or aspirating the buffy coat, aliquoted and placed in a −80°C freezer until further processing. In parallel, a serum sample was taken for the quantification of C-reactive protein (CRP), dsDNA antibodies and complement factors C3 and C4. Proteinuria was quantified using the protein/creatinine-ratio in a spot urine sample.
Total DNA was extracted from 500 µL of platelet poor plasma using the QIAamp DNA Blood Mini kit (QIAGEN, Hilden, Germany). The concentration and purity of the obtained total cfDNA was spectrophotometrically quantified with a NanoDrop ND‐1000 (Nano Drop Technologies, Wilmington, Delaware, USA). Eluates were stored at −20°C prior to analysis by qPCR.
mtDNA and nDNA copy numbers were quantified by quantitative real-time PCR using SYBR Green DNA intercalating dye on an Applied Biosystems StepOne Plus Real Time PCR system (Thermo Scientific, Wilmington, Delaware, USA) in 96 well plates with optical adhesive covers (Applied Biosystems). The mtDNA ATP-6 gene was amplified between nucleotide positions 8981 and 9061 with the forward primer 5′-ACCAATAGCCCTGGCCGTAC-3′ and the reverse primer 5′-GGTGGCGCTTCCAATTAGGT-3′. For the detection of nDNA we selected exon number 8 of the glyceraldehyde 3-phosphate dehydrogenase gene between nucleotide positions 4280 and 4342 and used the forward primer 5′-CGGGGCTCTCCAGAACATC-3′ and the reverse primer 5′ATGACCTTGCCCACAGCCT-3′. Each 10 µL PCR reaction contained 5 ng of plasma DNA, 250 nM primers and 5 µl PowerUp SYBR Green Master Mix (Thermo Scientific). The PCR reaction programme consisted of an initial uracil-DNA glycosylase activation step of 2 min at 50°C, a Dual-Lock Taq DNA polymerase activation step of 2 min at 95°C, followed by 40 cycles of 3 s of template denaturation at 95°C, alternating with 30 s of annealing and extension at 60°C. The specificity of the amplified PCR products was assessed with a melting curve analysis by increasing the temperature from 60°C to 90°C and plate read every 0.3°C.
Amplifications of mitochondrial and nuclear products were performed in triplicates. A negative ‘no-template’ control, two standard curves generated by amplifying mtDNA-containing and nDNA-containing vectors with known copy numbers and a DNA control sample from the same specific healthy donor were included in each set of runs to enable the assessment of the inter-assay coefficient of variation (CV). Absolute mtDNA and nDNA copy numbers in the PCR template were calculated using the obtained standard curves. In order to calculate the cfDNA copy numbers per millilitre of incoming plasma, PCR results were adjusted taking into consideration the initial volume of plasma from which DNA was extracted, the elution volume, the DNA concentration in the eluate and the amount of DNA template used in each qPCR reaction.20
Statistical analysis
The required sample size was evaluated as previously described,21 and for reaching a specificity of 0.9 it was calculated at a minimum of 109 tested samples, with the condition that 65% of the cohort are patients with SLE. Our current cohort exceeded our calculated requirements.
GraphPad Prism software for macOS, V.9.0 (GraphPad Software) was used for statistical analysis. Data were expressed as the median and IQR. One-way analysis of variance combined with Mann-Whitney U test or unpaired t-test were used to evaluate statistically significant differences between groups, as appropriate. Spearman’s rank tests were applied to analyse correlations. Within groups, variables were evaluated for their predictive power by means of linear regression analysis using Matlab R2018a (The Mathworks). Multiple variable analysis was performed by applying all variables with a p value below 0.1 into a generalised linear regression model.
Results
Study subjects
One hundred and three patients with SLE were recruited. Their median age was 47 years (range: 26–84 years) and their median disease duration was 12 years (range: 1–40 years), 96 patients were women. The median SLEDAI at the time of blood collection was 3.0. In four patients (2.9%), the SLE was highly active at the time of blood sampling, as indicated by an SLEDAI above 10. Thirty-nine patients (37.9%) were on prednisone therapy, these were receiving a median dose of 5 mg (range: 1–80 mg; IQR: 2.5 mg). Only three patients with SLE had a prednisone dose above 10 mg/day. At the time of plasma collection, 30 patients (29.1%) had elevated anti-dsDNA IgG antibodies (>40 IU/mL). Complement C3 concentrations were below the normal range in 52 patients (50.1%) and C4 concentrations in 22 patients (21.6%). Serum creatinine was elevated (>107 µmol/L) in three patients (2.9%). Details about the study subjects’ demographics, disease characteristics and laboratory parameters are given in table 1.
Demographics and disease characteristics of the study subjects
Circulating DNA concentrations
In control samples, the median total cfDNA plasma concentrations measured by spectrophotometry was 2.3 ng/mL (IQR: 1.5), ranging from 1.2 ng/mL to 9.3 ng/mL. In the patients with SLE, the median cfDNA concentration was 3.6 ng/mL plasma (IQR: 3.0; range: 0.3 ng/mL – 14.3 ng/mL), 57% higher than those in the healthy controls, (p<0.0001, figure 1A).
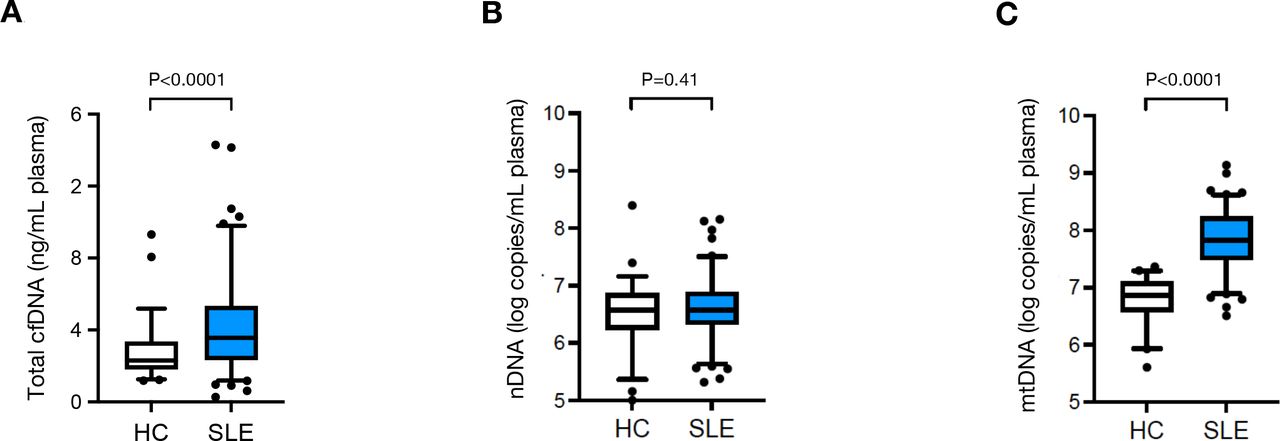
Circulating mtDNA copy numbers (C), as well as total cfDNA levels (A), but not nDNA copy numbers (B) are elevated in patients diagnosed with SLE (n=103) compared with HC individuals (n=56). Boxes represent IQR, whiskers represent the 5th and 95th percentile and individual dots represent outliers. ****, p<0.0001; ns, not significant (p=0.41). cfDNA, cell-free DNA; HC, healthy controls; mtDNA, mitochondrial DNA; nDNA, nuclear DNA; SLE, systemic lupus erythematosus.
In order to gain information about the nature of the cfDNA, we determined circulating nDNA and mtDNA copy numbers. The intra-assay CV for nDNA copy number determination was 0.9%, while the inter-assay CV was 4.8%. Conversely the intra-assay CV of mtDNA copy number quantification was 0.9% and the inter-assay CV was 2.1%. The median nDNA copy numbers in SLE plasma (3.7×10⁶ copies/mL, IQR: 3.2×10⁶) were almost identical to those in healthy controls (3.6×10⁶ copies/mL, IQR: 5.7×10⁶, p=0.41, figure 1B). mtDNA copy numbers however were on average 8.8 times higher in SLE plasma (median 6.6×10⁷ mtDNA copies /mL, IQR: 1.5×10⁸) than in control plasma (7.6×10⁶ /mL, IQR: 9.5×10⁶, p<0.0001, figure 1C).
Diagnostic potential of quantifying plasma DNA concentrations
We next examined in our total study population of 159 subjects the utility of circulating plasma DNA quantification to discriminate between patients with SLE and healthy persons.
The receiver operating characteristic (ROC) curve analysis of total plasma cfDNA concentrations revealed an area under the curve (AUC) of 0.70 (p<0.0001, figure 2A), the AUC of nDNA copy numbers was 0.54 (p=0.41, figure 2B). For mtDNA quantification, the ROC curve analysis determined an AUC of 0.95 at an optimal cut-off value of 1.8×10⁷ mtDNA copies/mL plasma (figure 2C). Using this cut-off, 90 out of 103 patients were classified as SLE, while only 3 out of 56 healthy controls were classified as such (online supplemental figure S1). This analysis exhibited a sensitivity of 87.4%, and a specificity of 94.6% (online supplemental figure S2), performances that were notably superior to those of the total plasma cfDNA concentrations and nDNA copy numbers (figure 1).
Supplemental material
Supplemental material
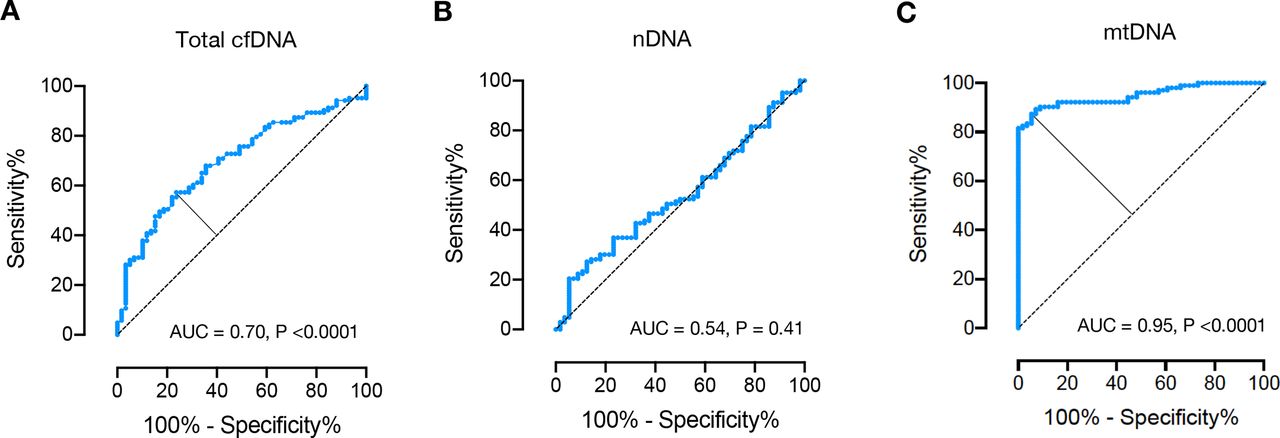
Receiver operating characteristic curve for total cfDNA (A), nDNA (B) and mtDNA (C) plasma concentrations for discrimination between healthy controls (n=56) and patients with systemic lupus erythematosus (n=103). AUC, area under the curve; cfDNA, cell-free DNA; mtDNA, mitochondrial DNA; nDNA, nuclear DNA.
Clinical factors associated with total cfDNA plasma concentration and nDNA or mtDNA copy numbers
We subsequently analysed the clinical factors associated with the elevated DNA plasma concentrations. Within both healthy controls and patients’ groups, there were no differences in total plasma cfDNA concentrations, nDNA or mtDNA copy numbers between sexes, age or neutrophil counts (data not shown). Furthermore, the concentrations of all DNA species did not correlate with systolic or diastolic blood pressure of controls and patients with SLE.
At univariable analysis, plasma total cfDNA concentrations as measured by spectrophotometry in patients with SLE correlated with the SLEDAI (r=0.45; p<0.0001), prednisone dose (r=0.37; p<0.001) and proteinuria (r=0.31; p<0.001). At multivariable analysis, the positive correlation of cfDNA concentration with disease activity persisted (adjusted r=0.50; p=0.03).
At univariable analysis of nDNA copy numbers in patients with SLE, there was a weak correlation with CRP (r=0.26; p=0.007). nDNA copy numbers also correlated with the SLEDAI (Spearman’s r=0.24; p=0.014). At multivariable analysis the correlation with SLE activity was no longer present and no other association between nDNA concentrations and any other parameter, except for cfDNA (r=0.40; p=0.04).
mtDNA copy numbers showed a strong univariable and multivariable association with the SLEDAI, but were not predicted by any other parameter in the patients with SLE group (table 2).
Univariable and multivariable predictors of circulating mtDNA copies in patients with SLE (n=103)
Predictors of SLEDAI
We next analysed if the quantification of plasma DNA concentrations could assist in predicting SLE activity. In univariable comparisons (table 3), the SLEDAI was positively correlated with corticosteroid dose (r=0.67), proteinuria (r=0.53), anti-dsDNA autoantibody titres (r=0.33), neutrophil counts (r=0.30) and hypocomplementaemia (r=−0.24). The associations with serum CRP concentrations and the history of serositis were also marginally significant, but with considerably lower r values. Of note, a significant and high correlation coefficient was observed for the association between SLEDAI and total cfDNA (r=0.45; p<0.0001) and also between SLEDAI and mtDNA (r=0.33; p<0.001). nDNA concentrations were however not correlated with the SLEDAI (table 3).
Univariable and multivariable predictors of SLEDAI in patients with SLE (n=103)
A multivariable evaluation of all variables with a p value below 0.1 in the univariable analysis was conducted. Only mtDNA concentrations (p<0.0001), prednisone dose (p<0.0001) and anti-dsDNA-antibody titres (p=0.002), but not total cfDNA, remained covariates of SLE disease activity, generating an adjusted r value of 0.78 (table 3). Even when comparing healthy controls with patients with SLE without any SLE activity (SLEDAI 0), the ability of mtDNA quantification to identify patients with SLE was high (sensitivity 81.8%, specificity 83.9%, AUC=0.89, p<0.0001).
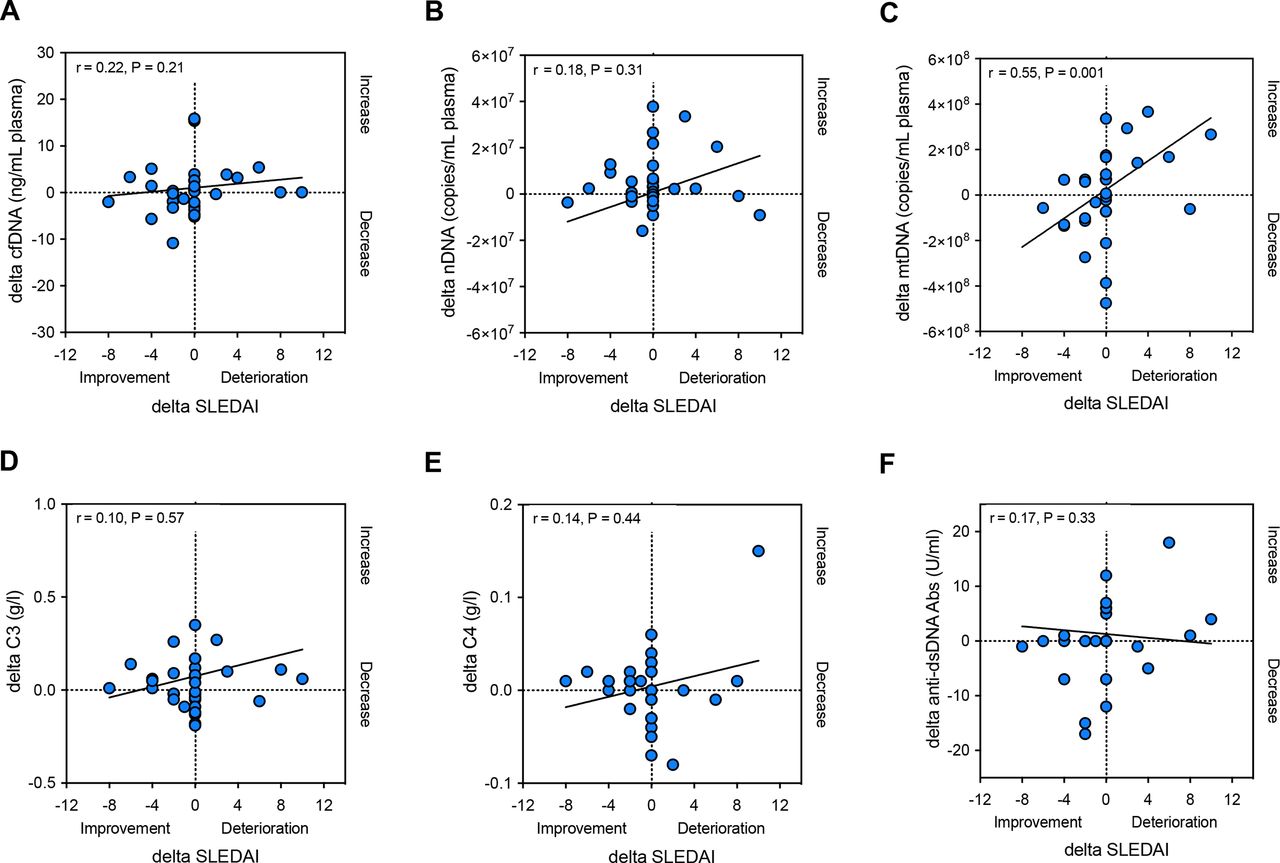
Thirty-three patients with SLE had follow-up visits (median time of follow-up: 8.0 months; IQR: 6.5 months). We therefore examined if the longitudinal changes in plasma mtDNA levels in patients with SLE also correlated with the evolution of the SLEDAI at follow-up. A robust correlation was noted (r=0.55, p=0.001); cfDNA and nDNA in contrast did, however, not correlate with the evolution of SLEDAI over time (figure 3A–C). Moreover, there was neither a correlation between the longitudinal evolution of C3 and C4 levels and SLEDAI changes, nor between auto-dsDNA antibody titre and SLEDAI changes (figure 3D–F).

Changes (delta) in total cfDNA (A) or nDNA (B) levels in plasma in patients with SLE (n=33) do not correlate with the evolution of disease activity at follow-up (delta SLEDAI); Delta-mtDNA levels (C), in contrary, correlate significantly with delta SLEDAI at follow-up. Moreover, changes (delta) in C3 (D), C4 (E) or auto-dsDNA antibody titres (F) in plasma in patients with SLE do not correlate with the evolution of disease activity at follow-up (delta SLEDAI). r, Spearman’s rank correlation coefficient; cfDNA, cell-free DNA; dsDNA, double stranded DNA; mtDNA, mitochondrial DNA; nDNA, nuclear DNA; SLE, systemic lupus erythematosus; SLEDAI, Systemic Lupus Erythematosus Disease Activity Index.
We lastly assessed, if the calculation of the ratio of mtDNA and nDNA copy numbers in each plasma sample provides clinically useful information. The median mtDNA/nDNA ratio was 1.8 (IQR: 4.4) in control individuals, and 15.4 (IQR: 27.6) in patients with SLE (p<0.001). Although the mtDNA/nDNA ratio distinguished patients with SLE from healthy persons with a sensitivity of 78.6% and a specificity of 87.5% at ROC analysis, the mtDNA/nDNA ratio did not correlate univariably and multivariably with any of the patients with SLE disease characteristics and laboratory parameters. These results indicate that the simultaneous determination of mtDNA and nDNA does not provide a diagnostic advantage over measuring mtDNA copies alone.
Discussion
This study identifies an increased abundancy of cfDNA in the circulation of patients with SLE and suggests that this is largely accounted for by mtDNA, rather than nDNA. Our data is compatible with the premise that mtDNA is released from neutrophils as a structural component of NETs.22 23 Unlike NETosis leading to cell death, neutrophils may also undergo vital NETosis, a process in which they only extrude a small amount of DNA, preferentially mtDNA, allowing for the neutrophil to remain alive and continue exerting antimicrobial actions.22 24 25 Recent studies have also linked trauma, malignancy, infections and pre-eclampsia with circulating mtDNA elevations, the extent of which was however comparably moderate.11 24–26 Importantly, some of these reports are confounded by the use of serum instead of plasma, with serum however being an inadequate analyte due to the in vitro release of mtDNA from platelets during coagulation. Moreover, platelets are a source of mtDNA in SLE, while mtDNA levels, but not NETs, are increased in patients with SLE with low disease activity, which is consistent with our findings.26 27 The platelet poor plasma isolation procedure used in our study removes platelets, mitochondria and microaggregates; it however does not remove microparticles and exosomes. Therefore, it is unclear if some mtDNA may also originate from extracellular vesicles.
Recent work has demonstrated that impairment of deoxyribonuclease (DNase) 1, an endonuclease responsible for DNA degradation in plasma, is strongly correlated with anti-dsDNA antibody titres and lupus activity.28 29 It is however unlikely that compromised DNase activity could account for our finding of a selective upregulation of mtDNA in SLE, as DNase acts also on both nDNA and mtDNA.
While only a relatively minor proportion of patients in our cohort had high SLE activity, mtDNA-levels strongly and independently of other markers corresponded to disease activity, both at inclusion and at follow-up. These observations support a direct involvement of circulating mtDNA in the pathogenesis of SLE. mtDNA is a ligand of both TLR9 and cyclic GMP-AMP synthase (cGAS), which appear to trigger the type I IFN signature and autoantibody formation in SLE.11 30–33 Neutrophils can themselves be activated by circulating mtDNA via TLR9 and the cGAS-STING-pathway to release DNA, closing a vicious circle that perpetuates the delivery of mtDNA,2 33 eliciting systemic inflammation and organ injury.31 34 Last, an increased availability of endogenous nucleic acids due to inherited defects in their catabolism has been identified in select patients with SLE28 35 and in Aicardi-Goutières syndrome which presents with a lupus like phenotype.36–38 All these observations support a direct proinflammatory role of circulating mtDNA in SLE.
The observations in this study further suggest that plasma mtDNA quantification may have particular utility in the diagnosis of patients with SLE. The used quantification assay is simple to implement, reliable and with solid intra-run and inter-run characteristics. Plasma mtDNA is rather unlikely to be a specific marker for SLE because elevated plasma mtDNA levels were also found in other interferonopathies and even after trauma.31 34 Plasma mtDNA however distinguishes patients with SLE from healthy individuals with high sensitivity, even in patients with quiescent lupus. Furthermore, variation of clinical severity seems to be associated with variation of mtDNA levels, suggesting that circulating mtDNA levels may become a useful adjunct in the monitoring of SLE activity. Larger studies in both patients with SLE and patients with other rheumatic diseases are however required to further evaluate the diagnostic value of circulating mtDNA levels.
Although the present study has limitations due to its small sample size and the lack of other autoimmune disease comparators, it identifies mtDNA rather than nDNA as the major component of increased nucleic acids in SLE plasma. Regardless of disease activity, circulating mtDNA levels distinguish patients with SLE from non-inflammatory controls with high sensitivity and represent an independent marker of SLE activity. Future work is hence needed to determine and evaluate the origin of mtDNA.
Data availability statement
Data are available upon reasonable request. Data are planned to become available publicly at the Harvard Dataverse Repository.
Ethics statements
Patient consent for publication
Ethics approval
The study was approved by the ethic committee of Northwest and Central Switzerland (N° 2019–01693) and by the ethic committee of the University of Freiburg (N° 507/16).
Acknowledgments
We would like to thank all enrolled patients, the medical teams and supporting personnel of the Rheumatological Polyclinic of the University of Basel and the Immunology-Rheumatology Biobank (IR-B) of the Department of Rheumatology and Clinical Immunology of the University Medical Centre Freiburg, and the Basel Blood Donation Centre for sample provision, collection and storage.
References
Supplementary materials
Supplementary Data
This web only file has been produced by the BMJ Publishing Group from an electronic file supplied by the author(s) and has not been edited for content.
Footnotes
Twitter @StavrosGiaglis
NV and UAW contributed equally.
Contributors SG performed experiments and the data analysis required for this study, and also read and approved the final manuscript. DD performed statistical analyses, and also read and approved the final manuscript. DK and REV contributed samples, and also read and approved the final manuscript. UAW and NV conceived the study, helped design the experiments, interpret clinical data and read and approved the manuscript. In addition, SG and UAW wrote the manuscript. UAW is the guarantor for this manuscript.
Funding This work is supported by the Swiss National Science Foundation (Project N°: 185300).
Competing interests Freiburg University holds a patent for mitochondrial DNA quantification in the diagnosis and follow-up of autoimmune diseases.
Provenance and peer review Not commissioned; externally peer reviewed.