Article Text

Abstract
Objectives To estimate the relationship between EQ5D (three levels, UK version) and the Ankylosing Spondylitis Disease Activity Score (ASDAS) for use in the economic evaluation of health technologies for people with axial spondyloarthritis (axSpA). To compare against the relationship with the Bath Ankylosing Spondylitis Disease Activity Index (BASDAI).
Methods An electronic, prospective, Portuguese, nationwide, rheumatic disease register (Reuma.pt) provided data on 1140 patients (5483 observations) with a confirmed diagnosis of axSpA. We estimated models of EQ5D as a function of ASDAS, alone or in combination with measures of functional impairment, using bespoke mixture models which reflect the complex distributional features of EQ5D. The SPondyloArthritis Caught Early cohort provided data from 344 patients (1405 observations) in four European countries and was used for validation. A previously published model of BASDAI/Bath Ankylosing Spondylitis Functional Index (BASFI) was also used to generate predicted EQ5D scores and model performance compared.
Results A non-linear relationship exists between EQ5D from ASDAS. The final model included ASDAS, ASDAS squared, age and age squared and demonstrated close fit in both datasets except where data were sparse for patients with very high levels of disease activity (ASDAS >4). This finding held in the validation dataset. Models that included BASFI improved model fit. The ASDAS based models fit the data marginally less well than models using BASDAI.
Conclusions Mapping models linking ASDAS to EQ5D allow results from clinical studies to be used in economic evaluation of health technologies with confidence. There is some loss of information compared with BASDAI but this has only a marginal impact.
- economics
- patient reported outcome measures
- spondylitis
- ankylosing
Data availability statement
Data may be obtained from a third party and are not publicly available. Data from the SPACE and reuma.pt registries can be obtained by contacting the investigators of those studies.
This is an open access article distributed in accordance with the Creative Commons Attribution Non Commercial (CC BY-NC 4.0) license, which permits others to distribute, remix, adapt, build upon this work non-commercially, and license their derivative works on different terms, provided the original work is properly cited, appropriate credit is given, any changes made indicated, and the use is non-commercial. See: http://creativecommons.org/licenses/by-nc/4.0/.
Statistics from Altmetric.com
Key messages
What is already known about this subject?
Results from clinical studies can be translated to cost-effectiveness reliably when outcomes are measured using Bath Ankylosing Spondylitis Disease Activity Index and Bath Ankylosing Spondylitis Functional Index. There is a need to do the same using Ankylosing Spondylitis Disease Activity Score (ASDAS).
What does this study add?
ASDAS score can predict EQ5D with confidence across all levels of disease severity in axial spondyloarthritis. Models that include measures of functional impairment and disease activity predict EQ5D best.
How might this impact on clinical practice or further developments?
Economic evaluation is a key consideration in formulating policies that impact patient care. This study allows a broader clinical evidence base to be incorporated into economic evaluation.
Introduction
Access to innovative health technologies is often determined, at least in part, by evidence of cost effectiveness. In particular, high cost biologic drugs for the treatment of axial spondyloarthritis (axSpA) are natural candidates for such analyses.
An essential part of economic evaluation is the estimation of health benefits in terms of quality-adjusted life years (QALYs). These require preference-based weights for the different degrees of health impairment patients may experience. One way to achieve this is for clinical studies to include appropriate outcome measures, such as the commonly used EQ5D. This is a simple, five-question outcome measure that is preferred by the National Institute for Health and Care Excellence (NICE) in England.
However, while many clinical trials include clinical measures and disease specific outcomes they often fail to include preference-based measures. In order to link outcomes observed in clinical studies to those required for economic evaluation, the process of ‘mapping’ can be used. This uses an external dataset to estimate the relationship between the different outcomes measures.
Mapping has previously been used to relate the Bath Ankylosing Spondylitis Disease Activity Index (BASDAI) and the Bath Ankylosing Spondylitis Functional Index (BASFI) to EQ5D.1–3 However, the Ankylosing Spondylitis Disease Activity Score (ASDAS) is increasingly used in clinical studies and recommended internationally as the preferred disease activity measure for axSpA.4–8 Therefore, there is a pressing need for EQ5D to be estimated from ASDAS to allow a growing body of clinical evidence to inform future cost-effectiveness studies of health technologies for people with axSpA. Only one such model has been estimated previously, but it used simple statistical methods that have been shown in previous applications to be prone to bias.2 Furthermore, both this and the previous BASDAI/BASFI to EQ5D mapping study did not include patients with non-radiographic axSpA, and therefore the population was not representative of the entire spectrum of axSpA patients but only of patients with radiographic axSpA (ie, ankylosing spondylitis (AS)).
In this study, in a population covering the entire axSpA spectrum of patients, we estimate a method for mapping from ASDAS to EQ5D, for use in cost-effectiveness analyses. We compare the performance of this approach to approaches that estimate EQ5D from ASDAS and BASFI, and from BASDAI and BASFI.
Methods
Outcome measures
The EQ5D (three levels, 3L) is a quality of life instrument intended for use across a wide range of disease areas. It asks respondents to indicate their current status in five health domains (pain, mobility, usual activities, self-care, anxiety/depression), each using a three point scale covering no problems, some problems or extreme problems. This version is referred to as the 3L variant, to distinguish it from the newer 5-level variant. We focus here on 3L, since 5L is not yet established in use in clinical study design to the extent that the 3L version has been, and there is some controversy about the available UK tariffs associated with the 5L instrument. NICE does not recommend the 5L value set for England.9
The 3L system permits the classification of 243 (corresponding to 35) health states. There is also a scoring set which assigns a value to each of these states on the health utility scale, where 1 is considered equal to full health and 0 a state equivalent to being dead. These scores, calculated based on the preferences of the general population,10 are critical for the use of EQ5D-3L as an outcome measure to inform economic evaluation since they permit the calculation of Quality Adjusted Life Years (QALYs). The UK value set ranges between scores of 1 for full health (no impairment on any of the 5 health domains) to −0.594 (for extreme problems on all five domains).
ASDAS is a newer composite index assessing disease activity in axSpA.6 11–13 There are five variables used to calculate an overall score: back pain (BASDAI question 2), duration of morning stiffness (BASDAI question 6), patient global assessment, peripheral joint complaints (BASDAI question 3) and C reactive protein (CRP) (2). The ASDAS has been endorsed by the Assessment of SpondyloArthritis international Society (ASAS) and by the Outcome Measures in Rheumatology groups. ASDAS domains are weighted and include an acute phase reactant, contrary to BASDAI, which is a fully patient-oriented measure that does not weight each variable, does not take into account redundancy between variables and lacks specificity for inflammatory processes. Accumulating evidence supports the utility of ASDAS in axSpA and BASDAI has been progressively being replaced by ASDAS.4 6 Scores <1.3 indicate inactive disease, between 1.3 and 2.1 ‘low disease activity’, between 2.1 and 3.5 ‘high disease activity’ and >3.5 ‘very high disease activity’.11 13 ASDAS scores range from 0.6 to ≈6 (mathematically there is no upper limit) and higher scores indicating higher disease activity.
BASDAI is one of the most commonly used instrument to measure disease activity in axSpA.14 It comprises six patient-reported questions relating to five major symptoms: fatigue, axial pain, peripheral pain, tendon and ligament inflammation and morning stiffness. The domain morning stiffness is calculated using the average of two separate questions about stiffness (level and duration). Responses are recorded on a 10 cm Visual Analogue Scale or an 11-point numerical rating scale, with higher scores indicating higher disease activity. All domains are given equal weight and the resultant 0–50 scores divided by 5 to given a final score of 0–10.
BASFI is a measure of physical function.15 16 It is a patient-assessed, validated, composite index made up of 10 questions that address function and the patient’s ability to manage his or her axSpA. As with the BASDAI, responses are recorded on a 10 cm Visual Analogue Scale or an 11-point numerical rating scale. The mean of the scores gives an overall BASFI range of 0–10, with higher scores indicating a greater degree of functional impairment. These scores are widely applied in clinical practice and studies.17
Data
The primary dataset used for estimation of models is the Rheumatic Diseases Portuguese Register (Reuma.pt).18–21 Reuma.pt is an electronic prospective nationwide rheumatic disease register implemented in 2008 with standardised data collection for patients with rheumatic and musculoskeletal diseases from all Rheumatology Departments of mainland Portugal, Madeira and the Azores Islands. The frequency of assessments is as per clinical practice according to local recommendations. Protocolised assessments include a large number of measures spanning imaging, clinical and self-reported assessments. We obtained information from 1140 patients with a rheumatologist-confirmed diagnosis of axSpA. Reuma.pt was approved by National Data Protection Board and by the local Ethics Committees. Patients sign an informed consent form for data research use and applications.
A smaller dataset for out-of-sample comparison from the SPondyloArthritis Caught Early (SPACE) cohort was used.22 23 SPACE is a prospective cohort that includes patients aged ≥16 years referred to the rheumatology outpatient clinics of participating centres in four European countries (the Netherlands, Norway, Sweden and Italy) with chronic back pain (almost daily; duration ≥3 months but ≤2 years; age of onset <45 years). Patients could be referred by general practitioners as well as other specialists such as orthopaedic surgeons, ophthalmologists, gastroenterologists, dermatologists and rheumatologists from other centres. Scheduled visits are at baseline, after 3, 12 and 24 months, and at an annual basis thereafter for patients with axSpA. Data from 344 patients with a diagnosis of axSpA with a level of confidence of at least 6 (on a 0–10 scale) were used in this study. SPACE was approved by the Medical Ethical Committees of the participating centres. All patients gave written informed consent. It should be noted that SPACE enrols patients with earlier disease than Reuma and therefore serves to provide a degree of validation for the mapping across the spectrum of axSpA.
Statistical methods
The primary aim of this study is to estimate the relationship (“mapping”) between the ASDAS instrument and the EQ5D.
The distributions of EQ-5D health utility scores demonstrate several non-normal features that raise challenges for standard statistical approaches. The range is bounded above and below, is multimodal and there is a large gap in the feasible values (between full health at 1 and the next health state 0.883—moderate problems with usual activities and no other impairment).
These characteristics raise challenges for standard statistical methods. We applied a range of statistical model types including those developed specifically to deal with these challenges including the Adjusted Limited Dependent Variable Mixture Model (ALDVMM) approach reported by Hernández et al,24 beta distribution-based mixtures as well as simple linear models. ALDVMM and beta based mixture models have repeatedly been shown to perform well in the context of mapping studies.25
We considered mixture models with different numbers of components, using the Bayesian Information Criterion (BIC) to help inform choices about the optimal number of components. Alternative model specifications were estimated using the ASDAS score (divided by 10), age (also divided by 10), sex and their squared terms as potential explanatory variables.
All models used the summary ASDAS, BASDAI and BASFI scores as explanatory variables, not the scores to individual components or questions. This is in line with how mapping functions tend to be used for economic evaluation.
Models were compared using a range of summary fit statistics such as mean absolute error (MAE) and root mean squared error (RMSE) as well as plots considering performance over the range of disease severity. Robust standard errors are reported to account for the repeated observations supplied by respondents.
Results
Descriptive statistics from the two study datasets are provided in table 1. Reuma.pt included data from 1140 patients providing 5483 observations in total. It included patients across a wide range of adult ages, with a maximum of 83 years. The mean ASDAS score is in the low disease activity range (2.02) but scores spanned from 0.6 to 6.3. Note that scores below 1.3 constitute ‘inactive disease’ and over 3.5 is considered ‘very high disease activity’. Patients spanned the entire range of disease activity as measured by BASDAI and almost the entire range of BASFI scores, from 0 to 9.88. The mean EQ5D score was 0.7 with the entire range of severity encompassed by patients in the study. There were 1136 observations at full health in Reuma.pt (21%). Only four observations were at the worst health state (<1%). The distribution of EQ5D-3L scores exhibited all the expected features, as shown in figure 1.
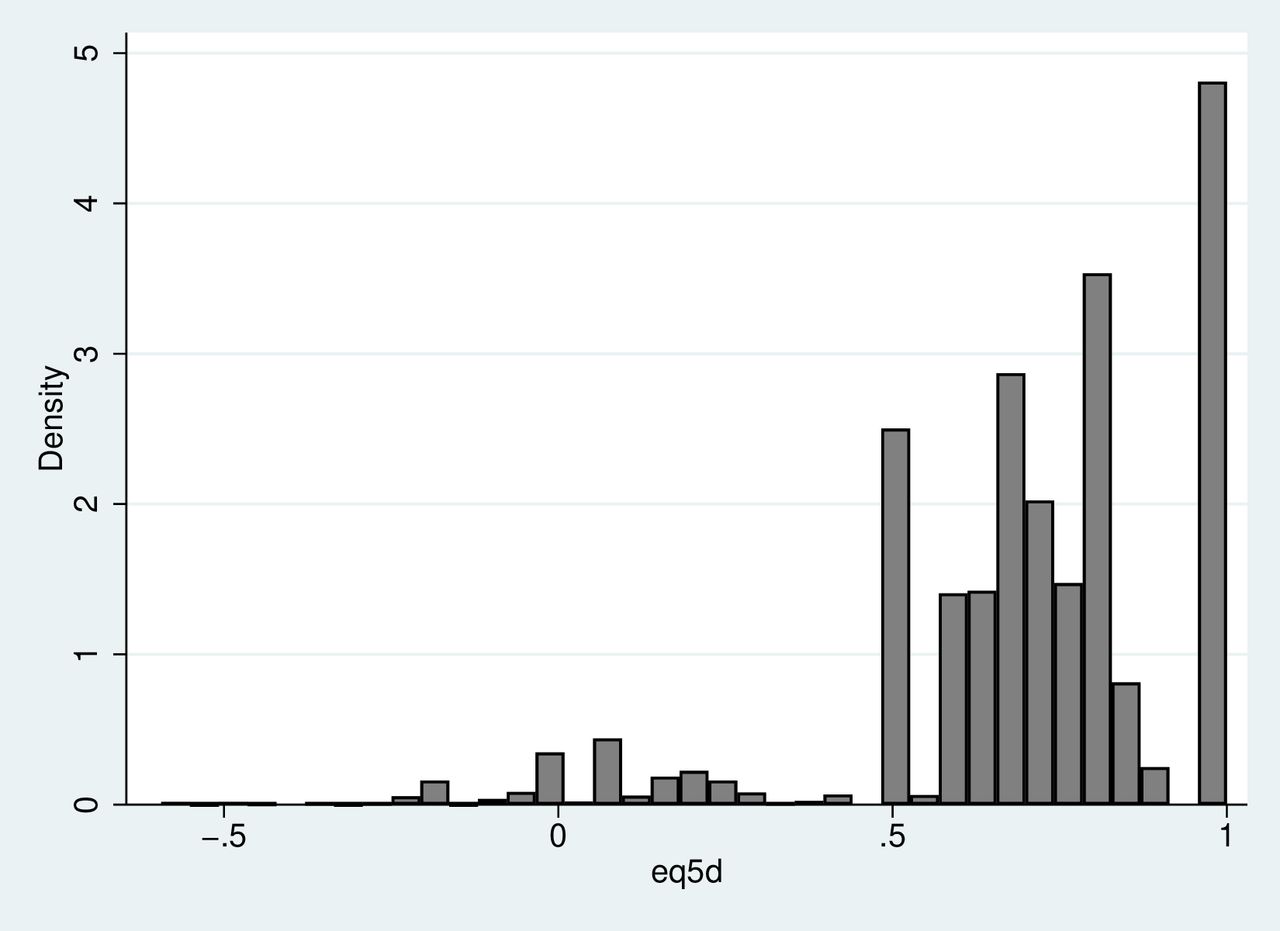
Distribution of EQ5D-3L in the Reuma.pt registry.
Characteristics of patient observations from the Reuma.pt and space datasets
There were 1405 observations available from the SPACE dataset. SPACE enrols patients with earlier disease than Reuma.pt so differences are expected. Excluding missing data, more patient met the ASAS classification criteria in Reuma.pt than SPACE (94% vs 66%, p<0.001). There were a greater proportion of patients with radiographic disease (87% vs 17%, p<0.001). Mean patient age was lower in SPACE than Reuma.pt (31.5 years vs 46.6 years, p<0.001). There were similar mean ASDAS (2.1. vs 2.0, p=0.014) and BASDAI scores (3.2 vs 3.0, p<0.001), though differences were statistically significant. Mean BASFI score was lower in SPACE than Reuma.pt (1.9 vs 2.8, p<0.001). Mean EQ5D was near identical in both studies (0.69 vs 0.70, p=0.26).
ASDAS model
ALDVMM type models outperformed all other model types. We selected a four-class ALDVMM, with a mass point at full health (1), as the best fitting specification. The model includes ASDAS/10, (ASDAS/10)2, age (in years) /10 and (age/10)2 as within component variables. Only ASDAS/10 was required within the component probabilities. Full model coefficients are reported in online supplemental table 1 and an online excel calculator provides a simple means of using the model results.
Supplemental material
Figure 2 shows very close alignment to the observed data for the range of ASDAS scores below 3.5. There is more divergence for very high disease activity states, particularly where ASDAS exceeds 4 but this is also where there are few patient observations. The observed relationship between ASDAS and EQ5D in the data is quite erratic within large confidence intervals. Only 218/5886 (3.8%) of observations report an ASDAS score of greater than or equal to 4. There are only four observations with an ASDAS score of 6 or above. The plot shows that for ASDAS scores of 0.5, the mean EQ5D predicted is 0.921 (close to full health) while for scores of 6 the mean EQ5D is 0.016 (close to states equivalent to death).

Mean EQ5D by ASDAS score, predicted versus observed values for the ASDAS only model. ASDAS, Ankylosing Spondylitis Disease Activity Score.
ASDAS plus BASFI
The optimal model was a four component ALDVMM that included ASDAS and BASFI summary scores, age and gender within the components and ASDAS and BASFI in the component probabilities.
Table 2 shows, unsurprisingly, that the addition of a measure of functional impairment, in addition to ASDAS, improves model performance. Summary measures of fit (MAE and RMSE) are improved. However, plotting EQ5D against ASDAS score showed a very similar pattern to the ASDAS only model. The same plot against BASFI score shows close alignment to the observed data across the full range of functional impairment (see figure 3).
EQ5D by mean BASFI, predicted versus observed values for the ASDAS and BASFI model. ASDAS, Ankylosing Spondylitis Disease Activity Score; BASFI, Bath Ankylosing Spondylitis Functional Index.
Summary of performance of optimal models using ASDAS only, ASDAS/ BASFI and BASDAI/BASFI in and out of sample
Out-of-sample comparisons (table 2) also show that the addition of BASFI improves summary measures of fit, though interestingly the mean of the predictions is closer to the sample mean in the ASDAS only model.
Full coefficient values are reported in (online supplemental table 2) and the online excel calculator also facilitates the simple implementation of this model.
BASDAI and BASFI
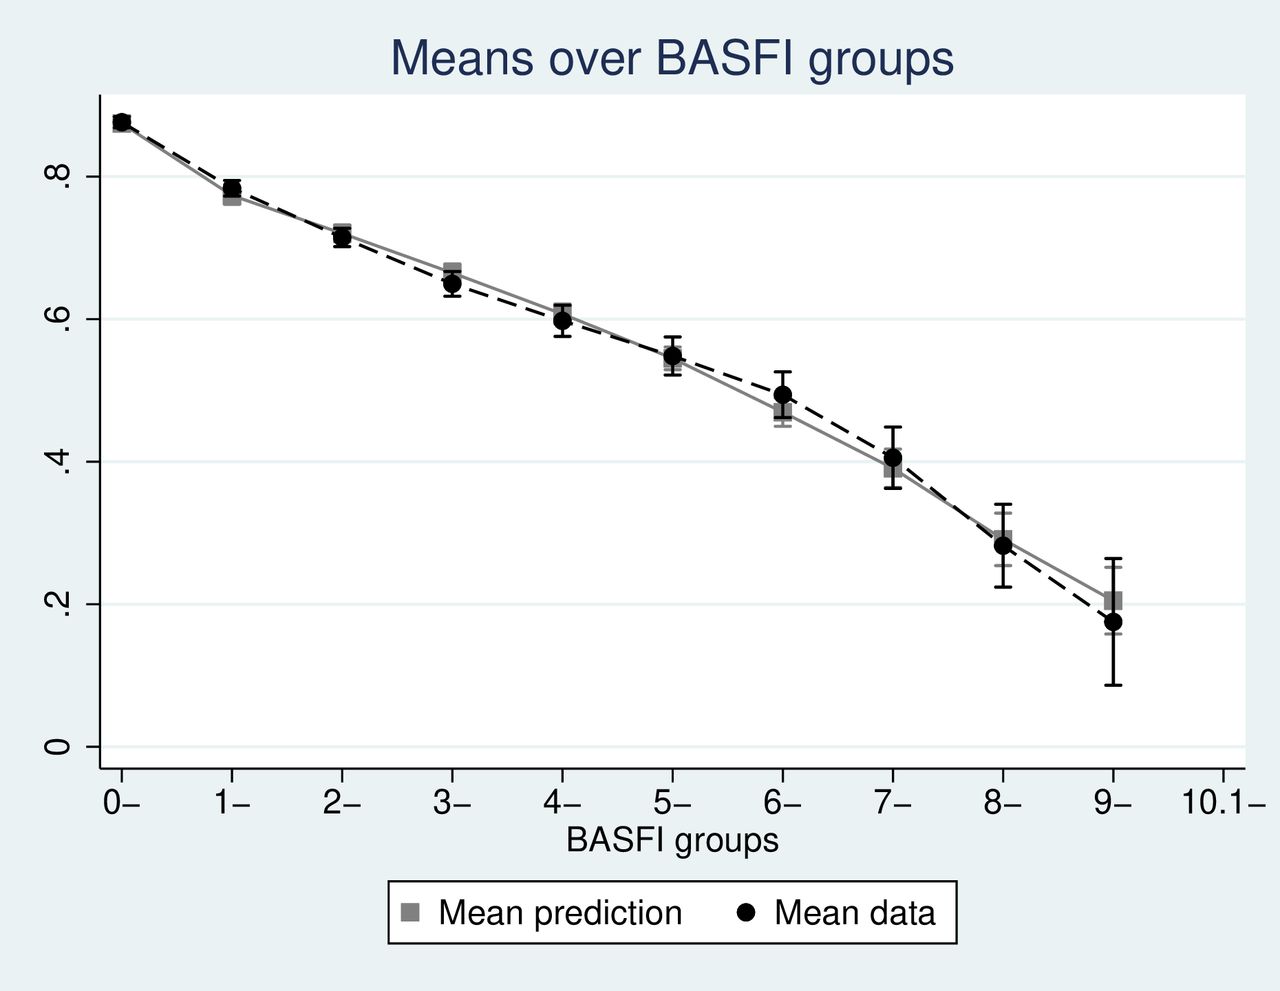
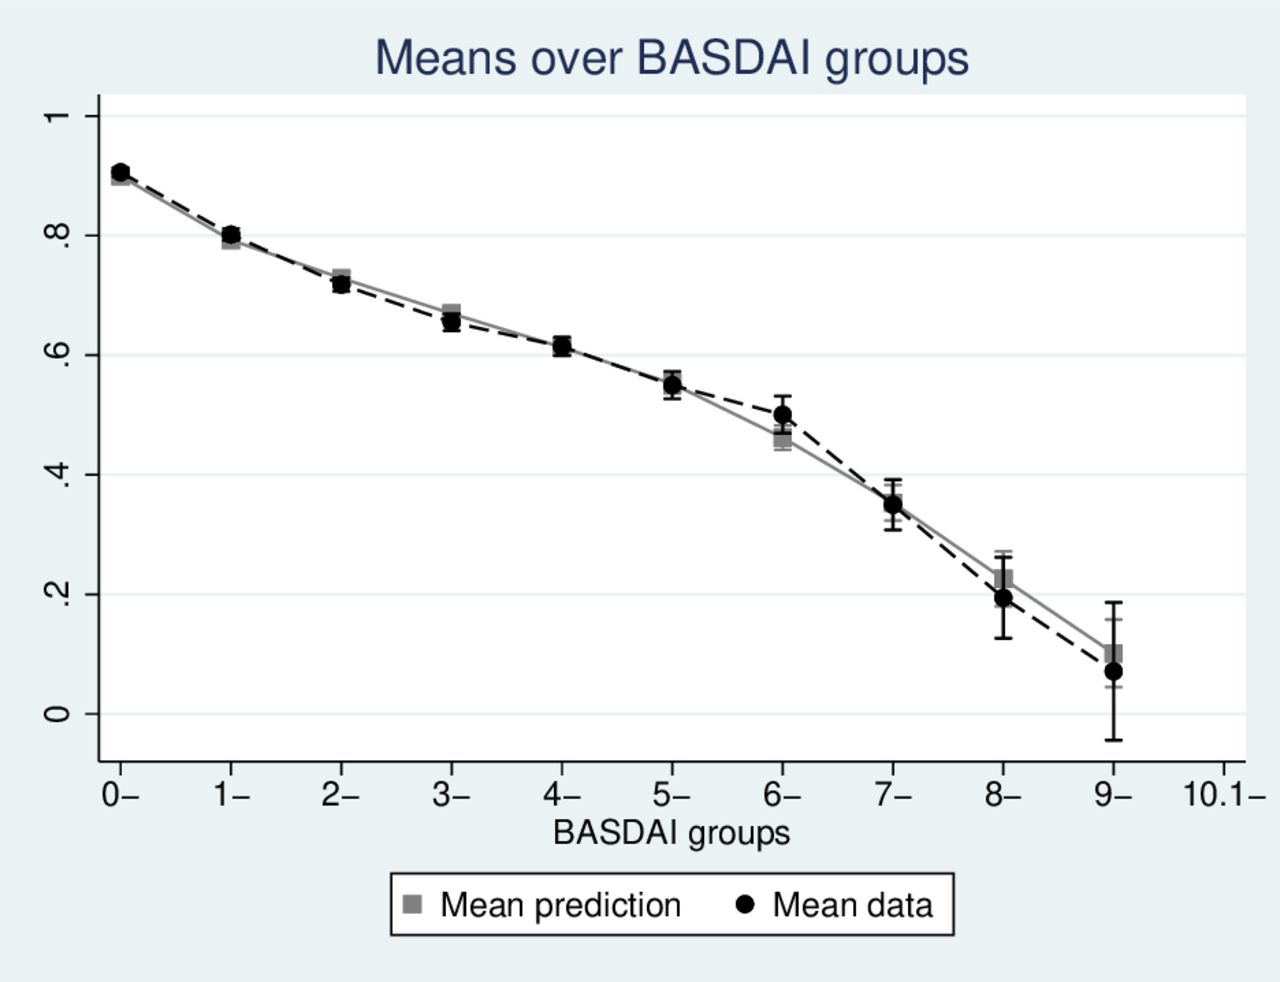
The optimal model was a four component ALDVMM that included BASDAI and BASFI summary scores, age and gender within the components and ASDAS and BASFI in the component probabilities. This model showed lower Akaike information criterion and BIC than either of the two ASDAS based models, and improved summary fit. Figures 4 and 5 show how the model predictions closely reproduce the mean EQ5D scores seen in the data across the range of both BASDAI and BASFI.

EQ5D by mean BASFI, predicted versus observed values for the BASFI/BASDAI model. BASDAI, Bath Ankylosing Spondylitis Disease Activity Index; BASFI, Bath Ankylosing Spondylitis Functional Index.

EQ5D by mean BASDAI, predicted versus observed values for the BASFI/BASDAI model. BASDAI, Bath Ankylosing Spondylitis Disease Activity Index; BASFI, Bath Ankylosing Spondylitis Functional Index.
Out of sample model performance
Using the SPACE dataset provides an opportunity to compare model performance out of sample.
We found a very similar pattern to the in-sample results. Measures of summary fit (RMSE and MAE) both indicate improvements from adding BASFI as an explanatory variable compared with ASDAS alone, and the BASDAI and BASFI offers further improvement (see table 2). Comparing the mean of the sample observations to the mean predicted from the models again shows that the BASDAI plus BASFI model offers the closest fit (0.719 compared with 0.692 in the data). The ASDAS model alone performs better on this metric than the model adding BASFI.
We also used a previously published model that estimated EQ5D from BASDAI and BASFI using data from a Welsh registry study, for comparison purposes.3 Closer fit to the SPACE mean was observed (0.701) but performance on the other summary measures was not as good as for the BASDAI/BASFI modelled using the Reuma.pt dataset and only slightly superior to the ASDAS/BASFI model results.
It is also important to consider model fit over the range of disease severity. EQ5D by BASFI score shows that both the ASDAS/BASFI and BASDA/BASFI models fit the observed SPACE data quite closely, though the latter offers some marginal improvements between BASFI scores of zero to 8. Both models diverge more substantially from the observed data at the most severe levels of functional impairment but data here is sparse.
Discussion
The ASDAS is a measure of disease activity in axSpA that has improved psychometric properties and offers advantages compared with the BASDAI. It is now in widespread use in clinical studies.7 8 26 27 Results of clinical studies need to be capable of also being used in economic evaluation to maximise their influence on healthcare decision makers. Ideally, this would involve the direct application of preference based, quality of life instruments designed specifically for such purposes within the clinical studies themselves. However, there are various reasons why this does not routinely occur. Therefore, an alternative approach, termed ‘mapping’ is typically required to statistically link clinical outcomes to preference based measures like the EQ5D. These models have been developed and tested for BASDAI. This paper applies the same methods to map between ASDAS and EQ5D.
The results show that these models yield results that can confidently predict EQ5D over the range of disease activity and functional impairment. We show that the range of disease activity described by ASDAS is associated with average EQ5D scores between full health and marginally above zero (states considered equivalent to death). Models that use both measures of functional impairment (BASFI) together with a disease activity measure provide the best performing approaches to predicting EQ5D. Most clinical studies would include both these types of measure so we envisage this would be the most useful setting for researchers, but even in those situations where only ASDAS has been measured, the results show that EQ5D can be predicted with confidence. While the models that use BASDAI as an explanatory variable rather than ASDAS perform better, this difference is slight, both in and out of sample.
Both datasets used for the analysis are well designed, large scale studies crucially covering a broad range of disease activity and functional impairment. In both studies, there are proportionally few patient observations at the most severe levels of impairment that the instruments can describe. This leads to greater uncertainty about the relationship with EQ5D in these settings. Whether this is a study weakness depends on whether patients in the real world are likely to reach such levels given modern treatments and if economic evaluations of health technologies are considering such patients. Future research may need to focus on the recruitment of these patients to registry studies which include quality of life. Despite this, the use of bespoke statistical methods that have repeatedly shown the absence of bias in estimates, compared with standard approaches which typically suffer from such biased estimated at the upper and lower end of the disease severity distribution, should provide greater confidence in the use of these results across the entire spectrum of disease. Moreover, although mathematically possible, values of ASDAS above 6 are exceptionally rare and would require for example a score of 10/10 for all patient reported variables and a CRP value of at least 68 mg/L, a scenario that is unlikely to occur in the absence of intercurrent acute illness. In general, ASDAS values above 5 are infrequent in clinical practice.
The analysis combines patients with axSpA and does not distinguish between non-radiographic and radiographic forms. This assumes that the relationship between ASDAS and EQ5D, with or without the inclusion of BASFI, differs by these subgroups. The out-of-sample validation using SPACE, which includes patients with earlier disease, and smaller proportions of patients with radiographic axSpA, provides greater confidence in the validity of these findings.
It should also be noted that mapping provides a means of translating the impact on those aspects of health considered important in axSpA via the ASDAS and BASFI scores into EQ5D ‘currency’. Comorbidities and adverse events are unlikely to be captured by this relationship and, therefore, cost effectiveness models may need to separately account for these health impacts where relevant.
This work provides estimates of EQ5D values based on the UK value set. For applicability to jurisdictions that use other value sets, replication of this work is recommended.
Conclusion
The use of ASDAS in clinical studies including people with axSpA allows the ability to estimate health related quality of life measured by EQ5D with confidence. The relationship is further improved when ASDAS is combined with measures of functional impairment. These findings are confirmed in data from two high-quality studies.
Supplemental material
Data availability statement
Data may be obtained from a third party and are not publicly available. Data from the SPACE and reuma.pt registries can be obtained by contacting the investigators of those studies.
Ethics statements
Patient consent for publication
Ethics approval
Reuma.pt was approved by National Data Protection Board and by the local Ethics Committees. SPACE was approved by the Medical Ethical Committees of the participating centres. Participants gave informed consent to participate in the study before taking part.
References
Supplementary materials
Supplementary Data
This web only file has been produced by the BMJ Publishing Group from an electronic file supplied by the author(s) and has not been edited for content.
Footnotes
Twitter @pedrommcmachado
Contributors AW, MHA and PMM conceived the study and sought funding for the work. MHA, GC and AW performed all the analyses. AW, MHA and PMM drafted the paper. All other authors provided data and commented on drafts of the paper. All authors approved the final version. AW is the guarantor.
Funding PMM is supported by the National Institute for Health Research (NIHR), University College London Hospitals (UCLH) and Biomedical Research Centre (BRC).
Competing interests MvdS has received consulting fees/speaker’s fees/research grants from Novartis, UCB, Abbvie, Janssen, Eli Lilly and MSD. FAvG has received grants from Stichting vrienden van Sole Mio, Stichting ASAS, Jacobus Stichting, Novartis and UCB, and consulting fees from Novartis, Eli Lilly, MSD, AbbVie and Bristol Myers Squibb. MB has received consulting/speaker’s fees from AbbVie, Eli Lilly, Janssen and Novartis. RR has received consulting/speaker’s fees from AbbVie, Eli Lilly, Janssen, MSD, Novartis, Pfizer, and UCB Pharma. SE has received consulting fees from AbbVie, Janssen and Novartis. DvdH has received consulting fees from AbbVie, Amgen, Astellas, AstraZeneca, Bayer, BMS, Boehringer Ingelheim, Celgene, Cyxone, Daiichi, Eisai, Galapagos, Gilead, Glaxo-Smith-Kline, Janssen, Lilly, Merck, Novartis, Pfizer, Regeneron, Roche, Sanofi, Takeda, UCB Pharma and serves as director of Imaging Rheumatology bv. PMM has received consulting/speaker’s fees from AbbVie, BMS, Celgene, Eli Lilly, Galapagos, Janssen, MSD, Novartis, Orphazyme, Pfizer, Roche and UCB Pharma.
Provenance and peer review Not commissioned; externally peer reviewed.
Supplemental material This content has been supplied by the author(s). It has not been vetted by BMJ Publishing Group Limited (BMJ) and may not have been peer-reviewed. Any opinions or recommendations discussed are solely those of the author(s) and are not endorsed by BMJ. BMJ disclaims all liability and responsibility arising from any reliance placed on the content. Where the content includes any translated material, BMJ does not warrant the accuracy and reliability of the translations (including but not limited to local regulations, clinical guidelines, terminology, drug names and drug dosages), and is not responsible for any error and/or omissions arising from translation and adaptation or otherwise.