Article Text

Abstract
Objective The aim was to identify any association between imaging signs of vessel wall inflammation (positron emission tomography–CT (PET-CT) score and CT/MR wall thickening) and synchronous and subsequent vascular damage (stenoses/dilations) in patients with large vessel vasculitis (LVV).
Methods Consecutive patients with LVV referred to a tertiary centre in 2007–2020 with baseline PET-CT and morphological imaging (CT/MR angiography) performed within 3 months were included. All available PET-CT and CT/MR scans were reviewed to assess PET-CT uptake (4-point semi-quantitative score), wall thickening, stenoses and dilations for 15 vascular segments. The associations of baseline PET score and CT/MR wall thickening with synchronous and incident stenoses/dilations at CT/MR performed 6–30 months from baseline were evaluated in per-segment and per-patient analyses. Respective areas under the receiver operating characteristic curve (AUC) were calculated.
Results We included 100 patients with LVV (median age: 48 years, 22% males). Baseline PET score and wall thickening were strongly associated (Cuzick non-parametric test for trend across order groups (NPtrend) <0.001). The association with synchronous stenoses/dilations was weak for PET score (NPtrend=0.01) and strong for wall thickening (p<0.001). In per-patient analyses, sensitivity/specificity for ≥1 synchronous stenoses/dilations were 44%/67% for PET score ≥2 and 66.7%/60.5% for wall thickening. Subsequent CTs/MRs were available in 28 patients, with seven incident stenoses/dilations. Baseline PET score was strongly associated with incident stenoses/dilations (p=0.001), while baseline wall thickening was not (p=0.708), with AUCs for incident stenoses/dilations of 0.80 for PET score and 0.52 for wall thickening.
Conclusion PET score and wall thickening are strongly associated, but only baseline PET score is a good predictor of incident vessel wall damage in LVV.
- magnetic resonance imaging
- systemic vasculitis
- inflammation
Data availability statement
Data are available upon reasonable request. Participant data that underlie the results reported in this manuscript will be shared after de-identification, beginning 6 months and ending at least 7 years after article publication, to researchers who provide a methodologically sound proposal with objectives consistent with those of the original study. Proposals and data access requests should be directed to the Area Vasta Emilia Nord Ethics Committee at CEReggioemilia@ausl.re.it as well as to the Authors at the Epidemiology Unit of AUSL–IRCCS di Reggio Emilia at info.epi@ausl.re.it, who are the data guardians. To gain access, data requestors will need to sign a data access agreement.
This is an open access article distributed in accordance with the Creative Commons Attribution Non Commercial (CC BY-NC 4.0) license, which permits others to distribute, remix, adapt, build upon this work non-commercially, and license their derivative works on different terms, provided the original work is properly cited, appropriate credit is given, any changes made indicated, and the use is non-commercial. See: http://creativecommons.org/licenses/by-nc/4.0/.
Statistics from Altmetric.com
Key messages
What is already known about this subject?
In patients with large vessel vasculitis, vascular inflammation leads to irreversible arterial structural damage, including stenosis and dilation.
18F-fluorodeoxyglucose (18F-FDG) uptake at positron emission tomography–CT (PET-CT) and wall thickening at CT or MRI are signs of vessel wall inflammation.
What does this study add?
Semi-quantitative vessel wall PET score and CT-assessed or MR-assessed vessel wall thickening are strongly associated, but only PET score is a good predictor of incident stenoses and dilations during follow-up.
How might this impact on clinical practice or future developments?
18F-FDG–PET-CT cannot be replaced by CT or MRI to predict the evolution from vessel wall inflammation to vessel wall damage. Prospective studies are needed to confirm the utility of PET score to guide treatment.
Introduction
Large vessel vasculitis (LVV) is a group of vasculitides affecting predominantly the aorta and its major branches. The most common LVV are large vessel-giant cell arteritis (LV-GCA) and Takayasu arteritis (TAK), two granulomatous vasculitides that share many clinical, pathological and radiographic features. Vascular inflammation leads to arterial remodelling, resulting in irreversible structural vessel changes, including stenosis and dilation.1 2
Assessing the extent of arterial involvement and measuring current inflammatory status are essential for the optimal management of LVV. Despite many attempts to adopt standardised approaches to disease activity assessment in LVV, no single measure or set of measures have been accepted as valid and useful in clinical practice. Imaging procedures remain the mainstay in the follow-up of patients with LVV, including 18F-fluorodeoxyglucose positron emission tomography associated with computed tomography (18F-FDG PET-CT),3 4 and CT angiography (CTA) or MR angiography (MRA), allowing to detect early inflammatory signs and late complications of LVV (stenosis and dilations).5–7 However, their potential role in monitoring disease activity and in predicting the disease course and the development of vascular damage is still unclear. In particular, it is currently unclear whether the low-grade vascular FDG uptake that persists during treatment in up to 70% of patients with LVV in clinical remission represents persistent disease activity or non-inflammatory remodelling.8 9
Most of the available literature on imaging of LVV focuses on the association between either PET-CT or morphological imaging and clinical disease activity.3 5 10 Some studies evaluating the association between PET-CT and morphological imaging findings have reported the association between vessel wall oedema and thickening with increased vascular FDG uptake.11 However, only a few small studies have reported on the relationship between baseline arterial wall inflammation evaluated mostly by means of PET-CT and the occurrence of irreversible morphological changes during follow-up, with contrasting results.12–17
The aim of this study was to evaluate the association between the presence of inflammatory signs of the vessel wall, including vascular uptake at PET-CT and vessel wall thickening at CTA or MRA, and the synchronous presence or the subsequent development of vascular damage, including stenosis and dilations.
Material and methods
Study design and population
This is a retrospective cohort study on prospectively collected data of consecutive patients diagnosed with LVV who were referred to the Rheumatology Unit of the Santa Maria Nuova Hospital of Reggio Emilia (northern Italy) between 2007 and 2020. All patients satisfied the modified inclusion criteria of the GiACTA trial for GCA,18 and the 1990 American College of Rheumatology classification criteria for TAK19; the diagnosis of LVV, confirmed by imaging, was defined as the presence of circumferential wall thickening/oedema with or without contrast enhancement and/or the presence of vascular stenosis/occlusion and/or dilation/aneurysm on CTA or MRA and/or the presence of vascular uptake on PET-CT. Patients under the age of 50 years at symptom onset were classified as TAK and those over 50 years as GCA.20 21 In this tertiary reference centre for vasculitis, patients with suspected, early or established LVV are admitted for definitive diagnosis and yearly check-up of disease activity and extension by means of duplex sonography, CTA or MRA, and 18F-FDG PET-CT.21 Additional imaging could be requested in cases of active disease based on clinical and laboratory parameters, or evidence of evolving vascular damage.
Only patients who had at least one complete imaging assessment, including simultaneous (interval time <3 months) PET-CT and morphological imaging (CTA or MRA), were included. The first complete imaging assessment was considered baseline.
Clinical data
Clinical and laboratory findings at each check-up, which included imaging, a detailed clinical evaluation and acute phase reactants (erythrocyte sedimentation rate (ESR) and C reactive protein (CRP)), were collected from medical records. ESR was measured by Westergren method and CRP by nephelometry (NA latex CRP kit; Behringwerke, Marburg, Germany); ESR >40 mm/hour and CRP >0.5 mg/dL were considered elevated.
Disease activity was evaluated using the Kerr/National Institutes of Health Index,22 which assesses four items: constitutional manifestations, raised ESR and/or CRP, clinical manifestations of vascular ischaemia or inflammation, and vessel lumen changes at CTA/MRA indicative of vasculitis. Disease was defined as active in the presence of at least two new or worsened items in the previous 3 months. In patients with GCA, disease was considered active also in the presence of unequivocal cranial and/or visual symptoms and/or polymyalgia rheumatica associated with elevated ESR or CRP.
Positron emission tomography–CT
All PET-CT examinations were acquired by using a hybrid PET-CT machine (Discovery, GE) with 3.30-minute emission scan/bed and CT-attenuation correction. Patients were required to fast for at least 4 hours before intravenous injection of 37 MBq of 18F-FDG per 13 kg of patient weight. Blood glucose levels before tracer injection were <200 mg/mL in all cases. Free breathing, low-dose CT scan was carried out for PET co-registration. A whole-body emission scan was performed 60 min after 18F-FDG injection.
All available PET-CT scans were reviewed by a single nuclear medicine physician with expertise in LVV (MC), who was blinded to clinical and morphological imaging data. A visual, semi-quantitative 4-point score was attributed to grade the 18F-FDG uptake of each vascular segment: 0=no uptake, 1=uptake lower than the liver, 2=uptake similar to the liver and 3=uptake higher than the liver.23 The following arterial segments were explored: the whole aorta (ascending aorta, aortic arch, descending thoracic aorta and abdominal aorta), innominate artery, subclavian arteries, common carotid arteries and the proximal tract of the coeliac artery, superior mesenteric artery, renal arteries and common iliac arteries.
Morphological imaging
CTA examinations were performed using one of two 128-slice multidetector scanners (128-slice Somatom Definition Edge, Siemens Healthcare, 128-slice Philips Brilliance iCT SP128, Philips Healthcare, and 64-slice Philips Brilliance 64, Philips Healthcare), acquiring pre-contrast and arterial post-contrast scans. A venous or delayed phase was added when deemed necessary. MRA examinations were performed on one of two 1.5 T scanners (Philips Achieva and Philips Ingenia, Philips Healthcare), including black-blood turbo spin echo and three-dimensional angiographic sequences after gadolinium administration.
All available CTA and MRA scans for each patient were retrospectively reviewed by a single radiologist with expertise in LVV (LS), who evaluated the vascular segments included in the field of view among the following: ascending aorta, aortic arch, descending thoracic aorta, abdominal aorta, innominate artery, subclavian arteries, common carotid arteries, coeliac artery, superior mesenteric artery, renal arteries and common iliac arteries. For each segment, data were collected on wall thickening (present if ≥3 mm),24 stenosis and vascular dilation.25
Statistical analyses
Continuous variables are reported as median and IQR, and categorical variables as proportions.
The association between the baseline semi-quantitative PET score and the presence of baseline morphological vascular abnormalities (wall thickening, stenoses and dilations) at CTA/MRA examinations performed within 3 months from PET scan was evaluated by means of Cuzick non-parametric test for trend across order groups (NPtrend). The association between wall thickening and the presence of baseline stenoses/dilations at CTA/MRA examinations was evaluated by means of Pearson’s correlation test. Analyses were conducted on a per-segment basis but taking into account the intra-individual correlation to obtain robust variance estimates with SVY command on STATA/IC V.13 in logistic regression.
Incident stenoses or dilations were defined when a new vascular lesion was found in at least one of the CTA/MRA examinations performed between 6 months and 30 months after the baseline combined assessment (PET-CT and CTA/MRA scans). This interval was decided to ensure a homogeneous length of follow-up among the patients, allowing a better interpretability of the predictive value of baseline imaging features; the 30-month period was decided to include at least 2 yearly follow-up episodes, considering a maximum 6-month delay. In patients with available follow-up CTA/MRA examinations, the association of the semi-quantitative PET score and the wall thickening with incident stenoses or dilations in subsequent CTA/MRA examinations was evaluated by means of NPtrend. Analyses were conducted on a per-segment basis, taking into account intra-individual correlation.
The predictive ability of PET score and wall thickening was assessed by means of receiver operating characteristic (ROC) curve reporting areas under the curve (AUCs) for synchronous and incident stenoses or dilations. In per-patient and per-segments analyses, the sensitivity, specificity, positive predictive value (PPV) and negative predictive value (NPV) of PET score with different cut-off values and of the presence of wall thickening in identifying vascular stenoses or dilations were calculated. The 95% CIs of proportions were computed according to binomial exact distribution.
Results
Study population
Between 1 June 2007 and 30 September 2020, 100 consecutive patients with LVV, 49 with TAK and 51 with GCA had a complete imaging assessment, including PET-CT and morphological imaging within 3 months, resulting in a total of 1206 vascular segments. The median time interval between PET-CT and morphological imaging was 12.5 days (IQR=4–51 days). Baseline clinical characteristics of the included patients are reported in table 1 and online supplemental table 1.
Supplemental material
Clinical characteristics of included patients
Imaging characteristics at the first complete assessment
At the moment of the first complete imaging assessment, a PET score of ≥1 and of ≥2 was registered, respectively, in 608 (50.4%) and in 129 (10.7%) vascular segments, for a total of 55 (55%) and 39 (39%) patients having at least one vascular segment with a PET score of ≥1 and of ≥2, respectively. Vessel wall thickening was present in 235 (19.5%) vascular segments and in at least one segment in 55 (55%) patients. Stenoses and dilations were registered in 92 (7.6%) and in 36 (3%) vascular segments, respectively. Fifty seven patients (57%) had at least one stenosis or one dilation. The anatomical distribution of imaging findings in different vascular segments is reported in online supplemental table 2.
Association between synchronous PET and morphological imaging findings
An increasing PET score was strongly associated with the synchronous presence of wall thickening (NPtrend <0.001); wall thickening was visible in 23.2% segments with a PET score of ≥1 versus 15.7% segments with a PET score of 0, and in 42.6% segments with a PET score of ≥2 versus 16.7% segments with a PET score of <2 (online supplemental table 3 and figure 1).

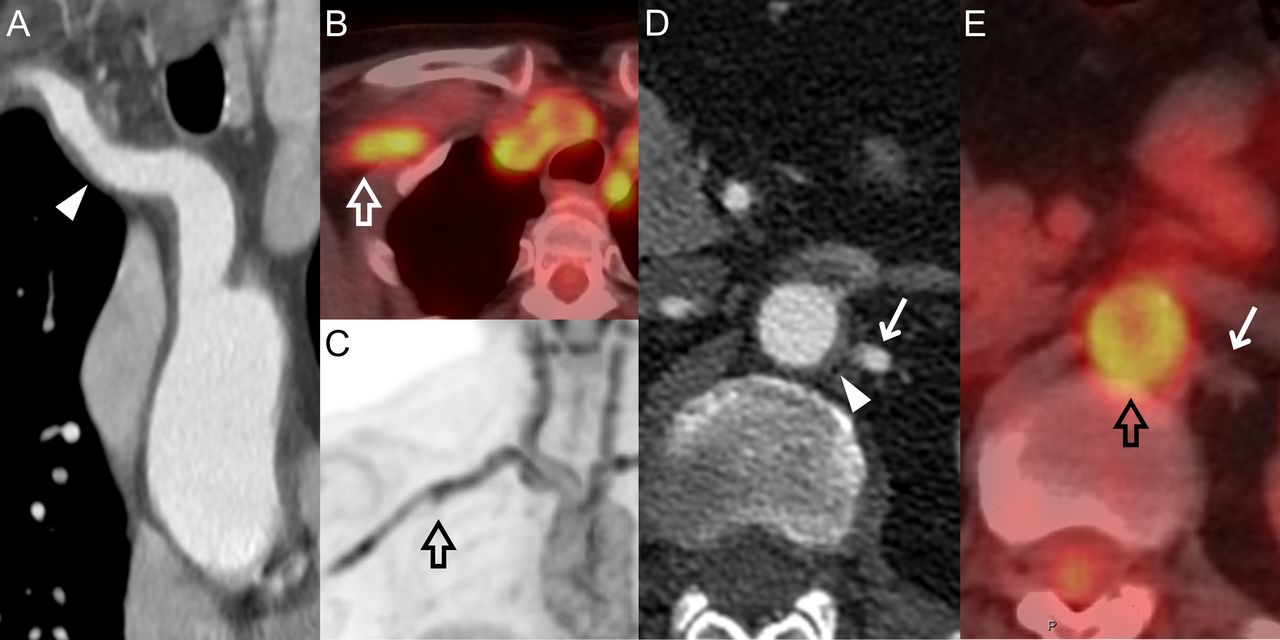
CTA and PET-CT images of a 64-year-old female patient with LV-GCA. The wall thickening of the innominate and right subclavian arteries (arrowhead) (A) correspond to increased uptake (PET score=3) in the same vascular segments (empty arrows) (B) and (C). The abdominal aorta was also affected by both vessel wall thickening (arrowhead) (D) and increased uptake with PET score=3 (empty arrow) (E), while no thickening or uptake can be seen in the left renal artery (arrows) (D) and (E). CTA, CT angiography; LV-GCA, large vessel-giant cell arteritis; PET, positron emission tomography.
The association between PET score and synchronous stenoses or dilations was weaker (NPtrend=0.01), although higher for dilations alone (NPtrend=0.008), but compatible with random fluctuation for stenoses alone (NPtrend=0.144). In particular, 59.3% of stenoses/dilations were in segments with a PET score of at least ≥1 and 17.9% in segments with a PET score of at least ≥2; among segments with a PET score of ≥1, the prevalence of stenosis/dilation was 12%, while in those with a PET score of ≥2, it was 17.1% (table 2 and figure 2).

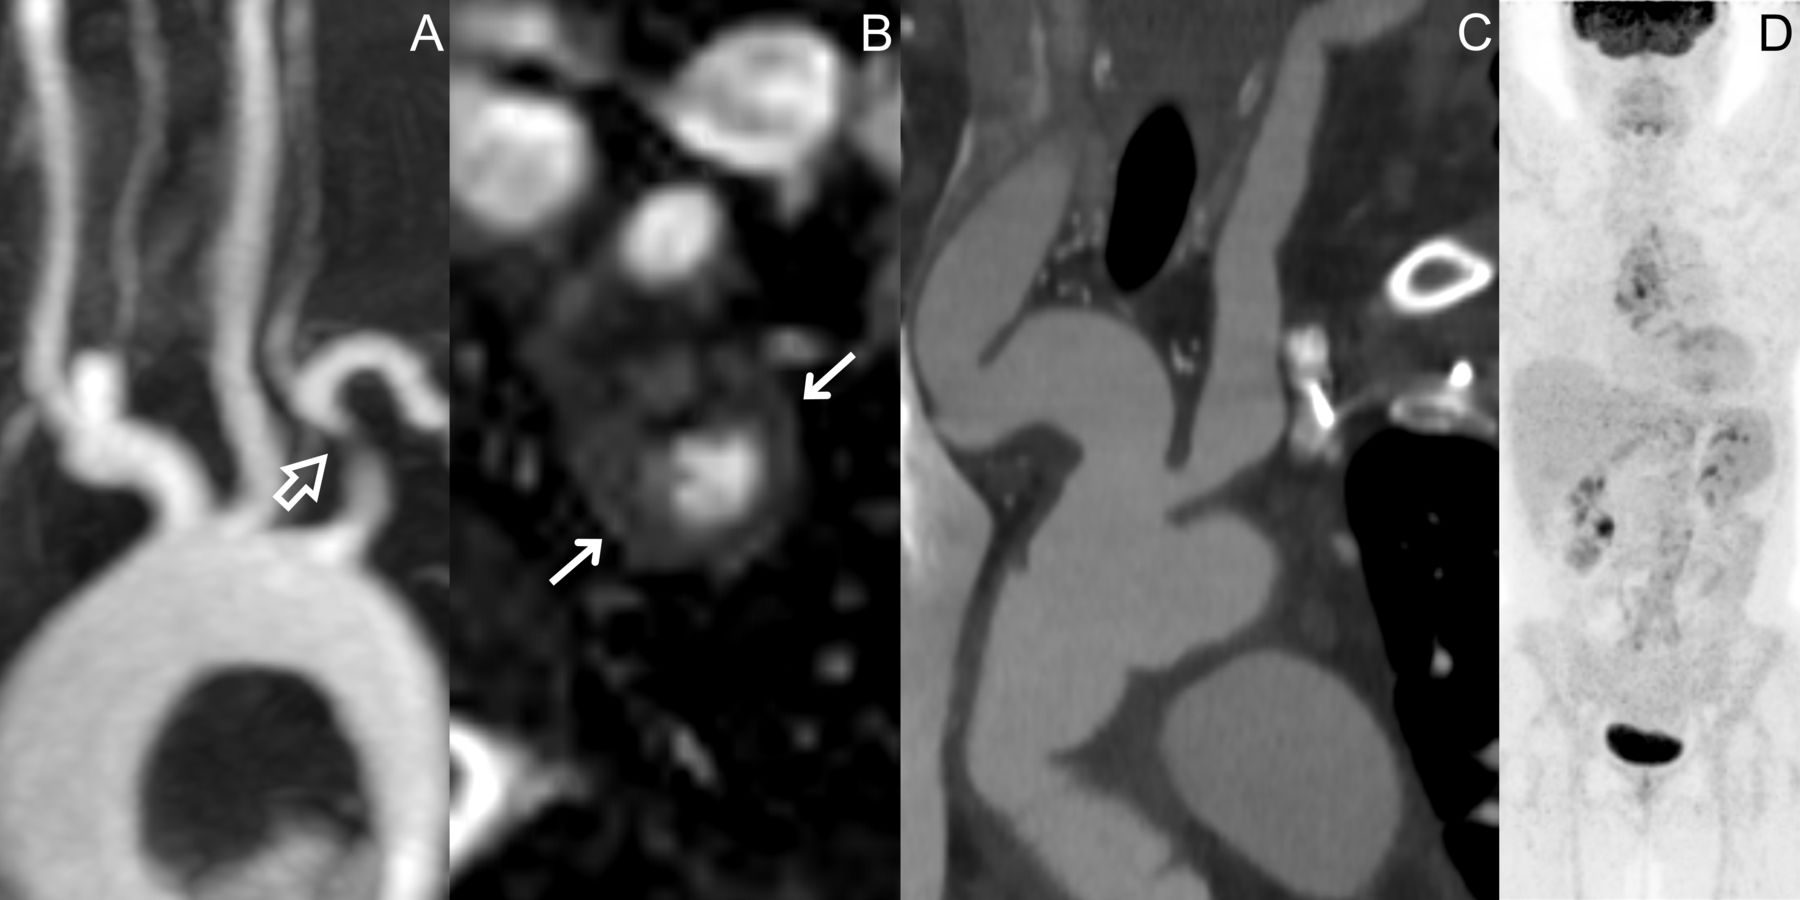
MRA of a 27-year-old female patient with TAK presenting with a stenosis of the proximal tract of the left subclavian artery (empty arrow) (A), with associated wall thickening in the same segment (arrows) (B). CTA and PET scan of a 53-year-old female patient with LV-GCA who had irregular vascular dilations affecting the innominate artery and the carotid arteries (C), which did not correspond to any 18F-FDG uptake at synchronous PET scan (D). CTA, CT angiography; FDG, fluorodeoxyglucose; LV-GCA, large vessel-giant cell arteritis; MRA, MR angiography; PET, positron emission tomography; TAK, Takayasu arteritis.
Association between signs of vessel wall inflammation and synchronous morphological vessel changes
The presence of wall thickening was strongly associated with the presence of synchronous stenoses or dilations (Pearson’s χ2 test, p<0.001) with similar associations for stenoses alone and dilations alone. In particular, 51.2% of stenoses/dilations were associated with wall thickening, and the prevalence of stenosis/dilation was 26.8% in segments with wall thickening versus 6.2% in segments without wall thickening (table 2 and figure 2).
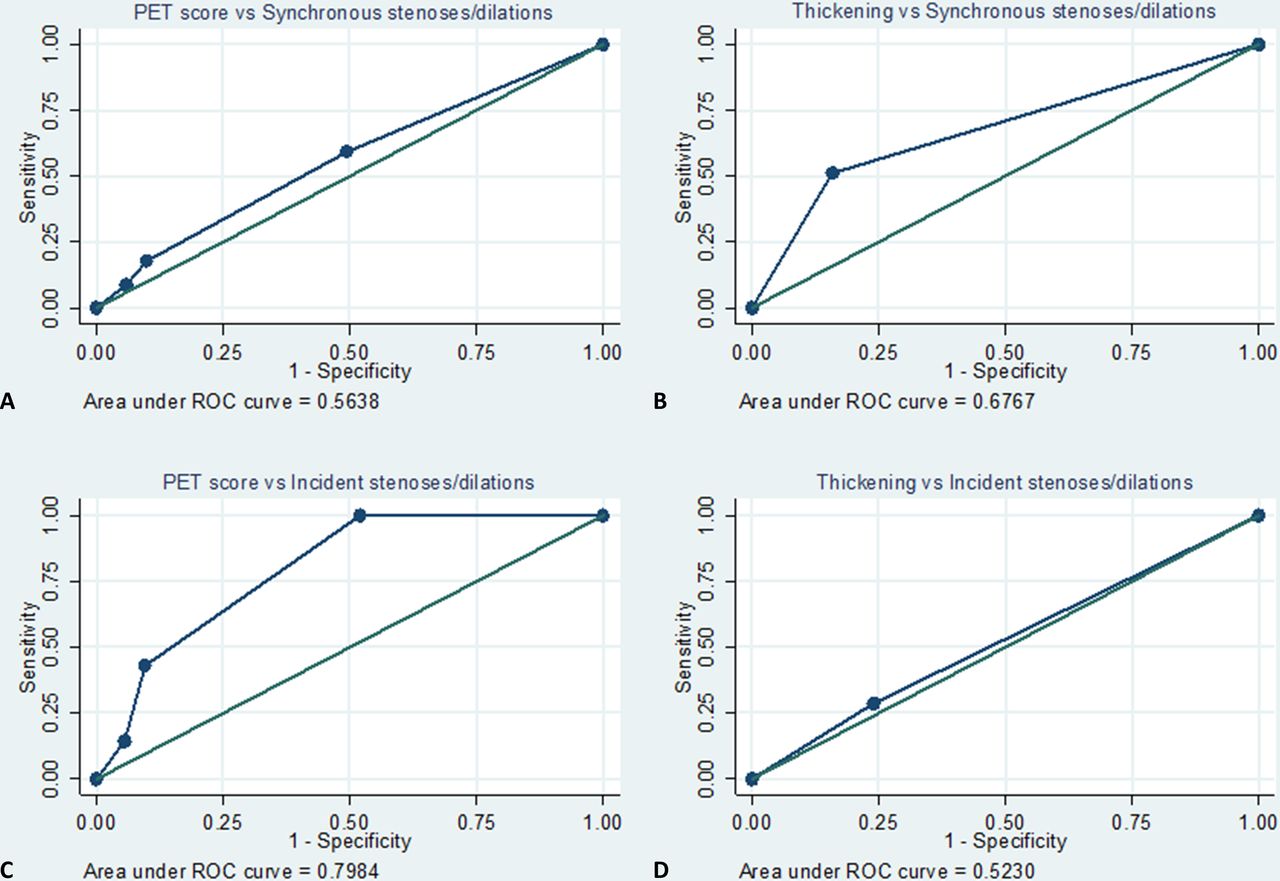
In ROC analyses, the AUCs for the presence of synchronous stenoses or dilations were 0.56 and 0.68 for PET score and for wall thickening, respectively (figure 3A,B), corresponding to a sensitivity/specificity of 59%/51%, 18%/90% and 9%/94% for PET scores of ≥1, ≥2 and ≥3, respectively, and of 51%/84% for wall thickening (table 2 and online supplemental table 4).
ROC curves of PET score and wall thickening for the presence of synchronous (A) and (B) and incident (C) and (D) stenoses or dilations. PET, positron emission tomography; ROC, receiver operating characteristic.
In per-patient analyses (online supplemental table 5), 53.3% patients with a PET score of 0 in all vascular segments, 60% of patients with at least one segment with PET score of ≥1, 64% of patients with at least one segment with a PET score of ≥2 and 68% of patients with at least one segment with a PET score of ≥3 had at least one stenosis or dilation. Sensitivity/specificity for the presence of at least one synchronous stenosis/dilation were 58%/49%, 44%/67% and 26%/84% for PET scores of ≥1, ≥2 and ≥3, respectively. It must be noted that there was no correspondence between the segment with increased PET score and the segment with the morphological abnormality in 7 of the 25 patients who had at least one segment with a PET score of ≥2 and a stenosis/dilation and in 6 of the 15 patients with at least one segment with a PET score of ≥3 and a stenosis/dilation.
As for wall thickening, at least one stenosis or dilation was present in 42.2% of patients who did not present any wall thickening versus 69.1% of patients with at least one segment with wall thickening. The sensitivity and specificity of wall thickening for the presence of synchronous stenoses/dilations were 66.7% and 60.5%, respectively (online supplemental table 5). In 7 of the 38 patients with at least one wall thickening and at least one stenosis/dilation, there was no anatomical correspondence between the thickened segment and the stenotic/dilated segment.
Association of baseline PET score and wall thickening with incident stenoses/dilations
At least one follow-up CTA/MRA performed between 6 and 30 months from the baseline combined imaging assessment was available in 28 patients, for a total of 299 vascular segments, with a median interval time between baseline assessment and follow-up CTA/MRA of 14.7 months (IQR=12.7–22.0).
Four patients had one or more incident stenoses or dilations, for a total of seven segments with incident stenoses/dilations. In particular, seven stenoses and one dilation occurred, but one dilation and one stenosis were considered as a single event as they occurred in the same segment. Six events occurred in a common carotid artery and one in a subclavian artery.
Baseline PET score was strongly associated with incident stenoses or dilations (or at the increase of 1 score point=2.59, 95% CI 1.51 to 4.42; p=0.001). Of the seven incident stenoses or dilations, all had a PET score of ≥1 (sensitivity=100%), and three had a PET score of ≥2 (sensitivity=43%) (table 3 and online supplemental figure 1). The PPV was 4% and 10% for PET scores of ≥1 and ≥2, respectively, while the NPV for a PET score of 0 was 100%.
Association between signs of vessel wall inflammation and incident stenoses or dilations
The presence of baseline wall thickening was not associated with incident stenoses or dilations (OR=1.27, 95% CI 0.35 to 4.61; p=0.708). In fact, stenoses/dilations occurred in 2.2% segments without and 2.8% segments with wall thickening (table 3).
In ROC analyses, the AUCs for incident stenoses or dilations were 0.80 and 0.52 for PET score and for wall thickening, respectively (figure 3C,D).
Four patients had at least one incident stenosis or dilation, three in two segments and one in only one segment. These four patients all had at least one segment with a PET score of ≥1, and two had at least one segment with a PET score of ≥2; in these two patients, the highest PET score was not observed in the same segment that developed the stenosis or dilation. All of these four patients had TAK with active disease and elevated baseline CRP at baseline, while elevated baseline ESR and baseline symptoms were present in three of them.
Discussion
A semi-quantitative PET score was strongly associated with synchronous wall thickening at morphological CTA/MRA imaging. Baseline PET score was weakly associated with synchronous stenoses or dilations but was a good predictor of incident stenoses/dilations in the subsequent 15 months (AUC=0.8). On the contrary, baseline wall thickening was associated with synchronous stenoses or dilations but did not predict incident stenoses/dilations during follow-up.
The strong association between vessel wall thickening and the degree of 18F-FDG uptake at PET-CT was expected. Even if the PET score, reflecting vessel wall metabolic activity, is thought to be more representative of disease activity, the concentric wall thickening typical of LVV is mainly due to inflammatory infiltration of the vessel wall, though reflecting the same phenomenon.11 26 27 On the other hand, this association is not a self-evident finding, because the simple assessment of wall thickness by means of morphological imaging does not always make it possible to differentiate between active inflammation and chronic fibrotic changes.17 28
This may also explain the higher association between wall thickening and synchronous stenoses/dilation when compared with PET score. In fact, chronically damaged vascular segments may no longer be metabolically active but still characterised by a thickened fibrotic wall. In particular, the lack of association between PET disease activity and synchronous stenoses has been already described.11
On the contrary, baseline PET score was a good predictor of incident stenoses or dilations during follow-up (AUC=0.80). The progressive development of irreversible vessel wall damage during longitudinal follow-up is thought to be a consequence of arterial inflammation.29 Nevertheless, while some studies have reported that PET uptake was able to predict the occurrence of vascular dilations in patients with LV-CGA,12–14 others found no association between PET uptake and new vascular lesions in longitudinally evaluated patients with TAK.15 Moreover, it should be noted that in our study, in patients who developed incident stenoses/dilations, the event did not always occur in the vascular segment with the highest baseline PET score (ie, the most inflamed).
Since baseline wall thickening was strongly associated with PET score in our cohort and may represent vessel wall inflammatory infiltration, it seemed reasonable to hypothesise its use as a predictor of incident vessel wall damage, similar to PET score. Instead, wall thickening was not associated with the occurrence of stenoses or dilations.
These findings have important clinical implications, underlining the ability of PET uptake to predict disease trajectory in terms of occurrence of structural changes. While the PPV of having at least one vascular segment with a PET score of ≥1 or ≥2 is low (4% and 10%, respectively), the 100% NPV of PET score of 0 suggests that a patient with negative PET-CT scan will not develop vessel structural damage in the following 2.5 years. Moreover, our results reinforce the need to use PET and morphological imaging as complementary assessments.26 In fact, disease activity evaluated on CTA/MRA does not seem to provide the same predictive value as PET uptake, confirming the limitations of using morphological imaging alone.16 17
This study has several limitations. First, the study design was retrospective, and we lacked a real baseline assessment for some patients, since they had already been diagnosed with LVV and treated before presenting at our hospital. Second, the kind of morphological imaging performed (ie, CTA or MRA) was not homogeneous for all the included patients. However, since we only evaluated wall thickening and structural changes such as stenoses or dilations, the two techniques are superimposable. This may not be the case for contrast enhancement, which is why we chose not to include its evaluation in the present study. In further studies focusing on MRA only, the inclusion of other imaging biomarkers of vessel wall inflammation, such as contrast enhancement, oedema and diffusion-weighted imaging, may improve the predictive ability of morphological imaging.26 30 31 However, since MRA is not a widely available technique, its longitudinal use in clinical practice cannot be assured. Nevertheless, it is advisable for patients with TAK, who are usually younger. Third, some of the included patients were already under treatment at the moment of PET-CT scan, potentially resulting in FDG uptake and PET score decrease. Fourth, we analysed TAK and LV-GCA together. While for baseline imaging characteristics and outcomes the two groups were similar, incident wall damage occurred in patients with TAK only, thus our results on PET as predictor of incident vessel damage are limited to patients with TAK. Finally, the maximum interval time between baseline PET and baseline CTA/MRA was quite long, up to 3 months, even if the median was much shorter (12.5 days).
In conclusion, PET score is a good predictor of the onset of irreversible artery wall damage in LVV, while vessel wall thickening does not show the same ability. This opens up a scenario for the use of PET score to guide treatment, but prospective studies are needed.
Supplemental material
Data availability statement
Data are available upon reasonable request. Participant data that underlie the results reported in this manuscript will be shared after de-identification, beginning 6 months and ending at least 7 years after article publication, to researchers who provide a methodologically sound proposal with objectives consistent with those of the original study. Proposals and data access requests should be directed to the Area Vasta Emilia Nord Ethics Committee at CEReggioemilia@ausl.re.it as well as to the Authors at the Epidemiology Unit of AUSL–IRCCS di Reggio Emilia at info.epi@ausl.re.it, who are the data guardians. To gain access, data requestors will need to sign a data access agreement.
Ethics statements
Patient consent for publication
Ethics approval
This study involves human participants and was approved by Ethics Committee of the Area Vasta Emilia Nord (protocol number: 2020/0089366). Given the retrospective nature of the study, the Ethics Committee authorised the use of a patient’s data without his/her informed consent, if all reasonable efforts had been made to contact that patient.
Acknowledgments
We thank Jacqueline Costa for the English language editing.
References
Supplementary materials
Supplementary Data
This web only file has been produced by the BMJ Publishing Group from an electronic file supplied by the author(s) and has not been edited for content.
Footnotes
Contributors LS reviewed morphologic imaging examinations. MC reviewed PET examinations. FM, EG, LB and CM collected clinical data. PM and PGR performed statistical analyses. GB, PGR, AV and CS were involved in study conceptualisation and design. GB and FM wrote the first manuscript draft. MF and FM prepared the figures. All the authors reviewed the manuscript. PGR was the guarantor of the overall study content.
Funding The authors have not declared a specific grant for this research from any funding agency in the public, commercial or not-for-profit sectors.
Competing interests None declared.
Provenance and peer review Not commissioned; externally peer reviewed.