Article Text

Abstract
Objective To assess the incidence of orthopaedic surgery (OS) (including total hip arthroplasty (THA), total knee arthroplasty, upper limb arthroplasty, arthrodesis and spinal surgery) and associated trends in patients with spondyloarthritis (SpA) over a long period (17 years).
Methods An observational, retrospective, population-based, serial cross-sectional study was conducted. All hospital admissions of patients with SpA reported between 1999 and 2015 were analysed, and a control group was selected and matched by age, sex and year of admission. Incidence rates for OS (and subtypes) were calculated. Generalised linear models were used to analyse trends; unconditional logistic regression models were used to calculate crude and adjusted ORs (aORs) with the aim of evaluating the association between OS and SpA.
Results The study database contained data on 214 280 hospital admissions (SpA/non-SpA 1:1 ratio). In the SpA cohort, 5 382 admissions (5.02%) had undergone OS compared with 3 533 in the non-SpA cohort (3.29%) (AOR 1.64; 95% CI 1.57 to 1.72). OS rates increased for both cohorts (+4.92% per year vs +8.41%). The trend in OS, THA, arthrodesis and spinal surgery decreased or stabilised in patients under age 60 in the SpA cohort, while the non-SpA cohort remained stable. In the SpA cohort, the mean age was 53.68 years (SD 13.65) in 1999, increasing to 62.76 years (SD 12.74) in 2015. In the non-SpA cohort, the mean age remained stable at around 63 years.
Conclusions A 9-year difference in the age of patients undergoing OS was observed in patients with SpA. The incidence of OS, THA and arthrodesis decreased in patients under age 60, and the incidence of spinal surgery decreased in patients under age 40. Our findings suggest that these patients are increasingly able to defer surgical interventions.
- orthopedic surgery
- spondyloarthritis
- epidemiology
Data availability statement
Data are available upon reasonable request.
This is an open access article distributed in accordance with the Creative Commons Attribution Non Commercial (CC BY-NC 4.0) license, which permits others to distribute, remix, adapt, build upon this work non-commercially, and license their derivative works on different terms, provided the original work is properly cited, appropriate credit is given, any changes made indicated, and the use is non-commercial. See: http://creativecommons.org/licenses/by-nc/4.0/.
Statistics from Altmetric.com
Key messages
What is already known about this subject?
Orthopaedic surgery in spondyloarthritis (SpA), particularly surgery for replacement of large joints, is a marker of severity and failure of medical treatment.
The few available studies report inconsistent results for psoriatic arthritis and ankylosing spondylitis and related orthopaedic surgery trends.
No studies have analysed patients with SpA as a single group.
What does this study add?
The trend in the use of orthopaedic surgery for SpA is increasing, although to a lesser extent than in the control group.
In SpA, the trend in hip arthroplasty (under 60) is decreasing, spinal surgery (under 40) and arthrodesis remains stable, while they are increasing in the control group.
In SpA, orthopaedic surgery is performed on average 9 years later than at the end of the twentieth century.
How might this impact on clinical practice or further developments?
These findings suggest that patients with SpA are increasingly able to defer surgical interventions.
Introduction
The term spondyloarthritis (SpA) refers to a heterogeneous group of chronic inflammatory joint diseases including ankylosing spondylitis (AS), psoriatic arthritis (PsA), arthritis associated with inflammatory bowel disease (SpA-IBD) and reactive arthritis (ReA).1 2 In advanced stages, which are characterised by joint damage despite pharmacological efforts, joint involvement may become progressively disabling and painful, ultimately necessitating surgery.3 In the past, arthroplasty was considered to be a ‘negative outcome’ in patients with rheumatoid arthritis (RA), and it was observed that 25% of patients of a cohort with RA eventually required joint replacement between 1974 and 1997.4 In other previous RA cohorts, more than 50% of patients were found to have needed joint surgery during the course of their disease.5 6 Nevertheless, data from recent series point to a decrease in arthroplasties, which could be attributed to the use of ‘treat-to-target’ strategies, early initiation of disease-modifying antirheumatic drugs (DMARDs) and the use of biologic agents.7–12 This decrease in arthroplasties contrasts with the increase in arthroplasty rates in the general population.9 13
Fewer data are available for SpA than for RA. Studies on SpA focus specifically on AS and PsA, and data are not as clear as for RA and may even be inconsistent. A similar study performed in the USA found that arthroplasty rates for SpA continued to increase, although average age had increased between 1991 and 2005.14 The study by Abraham et al (between 2002 and 2013) revealed an increasing trend towards knee arthroplasties in patients with spondylitis in a sample obtained in their nationwide inpatient sample.15 Other studies found a decreasing trend in hip arthroplasties for patients with AS,16 although another study on PsA did not find a decreasing trend in arthroplasties.17 As for other types of SpA (eg, SpA-IBD and ReA), studies are manifestly scarce. The present study reports data on these diseases.
Based on data from the Minimum Basic Data Set (MBDS, the Spanish national registry of hospitalised patients), this study compared the impact of biologic therapies between patients with SpA and a control group without SpA and the impact on incidence rate and trends for specific orthopaedic procedures, namely, total hip arthroplasty (THA), total knee arthroplasty (TKA), upper limb arthroplasty (ULA), arthrodesis and spinal surgery in patients with SpA.
Patients and methods
Study design
We conducted an observational, retrospective, population-based, serial cross-sectional study. This study has a similar methodology to other studies carried out by our group.18
Source of data
We used the MBDS of hospital discharges for the period 1999–2015. This database is created by coding hospital discharge reports. Data are provided by all Spanish hospitals, both public and private, and the database is estimated to cover 98% of the Spanish population.19 For the study period (1999–2015), it contains data on approximately 60 million hospital discharges.20 In addition to demographic data (age, sex and place of residence), the MBDS includes the diagnosis, leading to hospital admission (primary diagnosis), data on risk factors, comorbidities and complications during the hospital stay (secondary diagnoses) and diagnostic and surgical procedures performed.19 The diagnoses and data collected are coded in accordance with the International Classification of Diseases, Ninth Revision (ICD-9-CM). Data were provided by the Spanish Ministry of Health, Consumption and Social Welfare and included all admissions of patients diagnosed with SpA (SpA cohort). The following ICD-9-CM codes were used to identify patients with SpA1: 720.*, ankylosing spondylitis and other inflammatory spondylopathies (AS)2; 696.0, psoriatic arthritis (PsA)3; 099.3, reactive arthritis (ReA); and4 720 or 696.0, arthritis associated with inflammatory bowel disease (SpA-IBD) +555.* (regional enteritis), or 556.* (ulcerative colitis). Only data from records of patients aged 18 years or older were included in the study. The Spanish Ministry of Health, Consumption and Social Welfare manages the MBDS and allows researchers to access the data for research purposes once personal information has been anonymised.
Additionally, the Ministry of Health, Consumption and Social Welfare, was asked to provide a random sample of records from patients with non-SpA. Three million records were used to build a control group representative of the Spanish population from which the cases arose. Specifically, a comparison cohort was selected to match cases (SpA cohort) by age, sex, region of residence and year of hospital discharge (non-SpA cohort).
Figure 1 is a flowchart outlining the selection process used for the records included in this study.

Cohort selection flow chart. MBDS, Minimum Basic Data Set; OS, orthopaedic surgery; SpA, spondyloarthritis.
Selection of records containing orthopaedic Surgery
Orthopaedic surgeries were identified through ICD-9 codes for each surgical area as follows: THA, 81.50–81.53; TKA, 81.54–81.55; arthrodesis of upper or lower limb joints, 81.20–81.29; ULA (elbow and shoulder 81.80–81.88 and hands 81.70–81.79); and spinal surgery, 81.0, 81.3 and 81.6. For each case, the specific data collected included demographic characteristics (age, sex and place of residence), risk factors, comorbidities and complications during the hospital stay (secondary diagnoses) and the main diagnostic procedures and surgical interventions performed. Patients were classified into the following age groups: 20–39, 40–59, 60–79 and over 80 years.
Potential confounding Factors
In addition to demographic data (such as age and sex), hospital stay and mortality coded according to ICD-9-CM, data were collected on the following comorbidities as potential confounding factors: variables involved in the calculation of the Charlson comorbidity index (severe and mild liver disease, kidney disease, chronic obstructive pulmonary disease, pressure ulcers, connective tissue disease, peripheral vascular disease, haemiplegia, dementia, congestive heart failure, ischaemic heart disease, metastatic tumours, leukaemia and lymphoma) and the Charlson comorbidity index itself21 22; cardiovascular diseases (ischaemic heart disease, heart failure, stroke, aortic aneurysm, valvular heart disease, pulmonary vein thrombosis and pulmonary embolism); cancer (colon, stomach, pancreas, lung, pleura, skin (melanoma), breast, cervix, uterus, brain, ovary, prostate, bladder and kidney) and infectious diseases. Data were also collected on patients’ history of hypertension, smoking, obesity, erythema nodosum, cauda equina syndrome, uveitis and depression.
Statistical analysis
Exact matching 1:1 was performed to balance the SpA cohort and the non-SpA cohort by age, sex, region of residence and year of discharge, with a calliper of 5 years in age. This process was carried out using the R package. The clinical characteristics of the two cohorts were compared using univariate analysis, with categorical data expressed as absolute and relative frequencies and quantitative data as mean and SD. In the case of sex, the χ2 test was used for qualitative variables and the t test or the Mann-Whitney test for quantitative variables, depending on the data distribution. The large sample size meant that, to facilitate the interpretation of results from the univariate analysis, the MSD was calculated and ≥0.1 was defined as the cut-off point to establish that there were differences between cohorts. All tests were twotailed, and significance was set at p<0.05.
Annual crude rates for THA, TKA, ULA, arthrodesis of upper or lower limb joints and spinal surgery (cases per 100 000 population per year) were calculated for both cohorts (SpA and non-SpA) by sex and age group. The number of cases in the MBDS was used as the numerator, and the population at risk as the denominator. Age-adjusted rates with 95% CIs were also calculated using the population in 2015 as a reference. The at-risk population was estimated based on national census data provided by the Spanish Statistics Institute, and the prevalence rates of SpA were 0.84% overall, 1.13% for men, and 0.54% for women. These prevalence rates were obtained from the sum of rates for AS and PsA estimated in the Spanish epidemiological study EPISER.23
Changes in annual rates (linear trends) were analysed using generalised linear models with a Poisson or a negative binomial distribution for over-dispersed data. The rates estimated from models were collected with their corresponding 95% CIs expressed as percentages per year and as incidence rate ratios (IRRs). The analysis was performed for the entire sample and separately for each sex.
The association between SpA and THA, TKA, ULA, arthrodesis and spinal surgery in comparison with the control group was assessed by calculating ORs and the corresponding 95% CI using unconditional logistic regression models. First, we estimated crude ORs that only included the exposure and variables used for matching (age, sex, region of residence and calendar year). Then, adjusted ORs (aORs) were calculated by adding the following variables: year, age, sex, diabetes mellitus, hypertension, obesity, smoking, fractures (any), osteoporosis, infectious diseases, hyperlipidemia, cardiovascular diseases and Charlson comorbidity index. For a statistical analysis of interactions, adjusted models were applied for different categories of the interaction variables, and the AORs associated with the different subtypes of SpA were calculated. This analysis was not carried out if fewer than five cases were identified in the corresponding group.
Results were considered statistically significant for p values less than 0.05. The statistical analysis was carried out with IBM SPSS V.24.0, Epidat V.4.2, R V.3.6.1 and Stata V.14.
Results
In total, 107 140 hospital admissions for SpA were identified over the 17-year study period. Of these, 62 291 (58.1%) were coded as AS, 37 369 (34.9%) as PsA, 5319 (4.9%) as SpA-IBD and 2161 (2.1%) as ReA. The control group comprised 107140 hospital admissions matched with the SpA cohort by age, sex, region of residence and year of admission (non-SpA cohort). Online supplemental table 1 shows the clinical characteristics of both cohorts.
Supplemental material
Description of OS (all) in the SpA and non-SpA cohorts
Of a total of 214 280 hospital admissions, 8940 (4.16%) were for orthopaedic surgery (OS), 3481 (1.62%) for THA, 2324 (1.08%) for TKA, 247 (0.11%) for arthrodesis, 827 (0.38%) for ULA and 2086 (0.97%) for spinal surgery. In the SpA cohort, 5382 patients (5.02%) were hospitalised for OS, 2261 (2.11%) for THA, 1115 (1.04%) for TKA, 172 (0.16%) for arthrodesis, 345 (0.32%) for ULA and 1525 (1.42%) for spinal surgeries. In the non-SpA cohort, 3533 (3.29%) admissions were for OS, 1220 (1.13%) for THA, 1209 (1.12%) for TKA, 75 (0.07%) for arthrodesis, 482 (0.32%) for ULA and 561 (0.52%) for spinal surgeries.
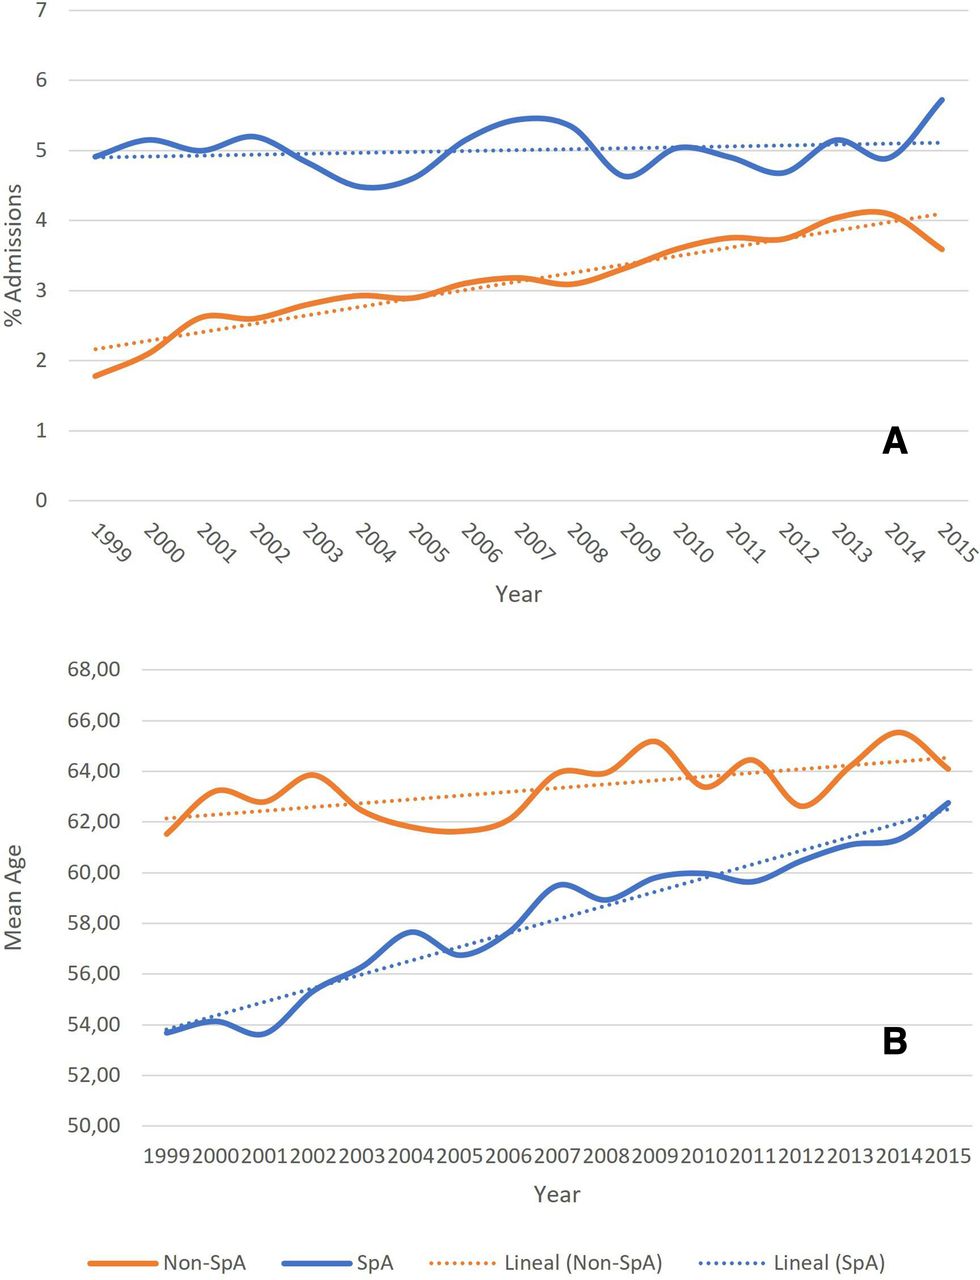
In the SpA cohort, OS was performed in 4.90% of all hospital admissions in the year 1999, a figure that remained stable throughout the analysis period. As for the non-SpA cohort, OS was performed in 1.77% of all admissions in 1999, a figure that increased linearly to 4.09% in 2014 (figure 2A).

Proportion of admissions for OS and mean age during 1999–2015. (A). Proportion of admissions for OS; (B) mean age in the study period. MBDS, Minimum Basic Data Set; SpA, spondyloarthritis.
In the SpA cohort, 3425 (63.74%) patients receiving OS were men, while 1957 (36.36%) were women. Mean age was 58.97 (SD 13.50) years. Average length of stay was 16.31 (SD 25.43) days. The mean Charlson comorbidity index was 0.45 (SD 0.94). A total of 69 (1.32%) deaths occurred during hospitalisation, 52 in men (1.53%) and 17 in women (0.93%). In comparison, in the non-SpA cohort, 1862 (52.75%) patients receiving OS were men and 1671 (47.25%) were women (p<0.001). Mean age was 63.67 (SD 12.58) years (p<0.001). Average length of stay was 9.12 (SD 11.12) days (p<0.001). The mean Charlson comorbidity index was 0.33 (SD 0.89) (p<0.001). A total of 17 (0.48%) deaths occurred during hospitalisation (p<0.001), eight in men (0.42%) and nine in women (0.53%). Table 1 shows all the main characteristics by type of OS.
Baseline characteristics and demographics associated with the incidence of OS in patients with SpA (SpA cohort) and a matched cohort from the general population (non-SpA cohort) by type of OS.
In the SpA cohort, the mean age (of all cases of OS) increased by 9 years during the 17-year study period. The mean age was 53.68 years (SD 13.65) in 1999, increasing to 62.76 years (SD 12.74) in 2015 and reaching the same mean age as the control group. In the non-SpA cohort, the mean age remained stable at around 63 years (figure 2B).
Incidence of OS
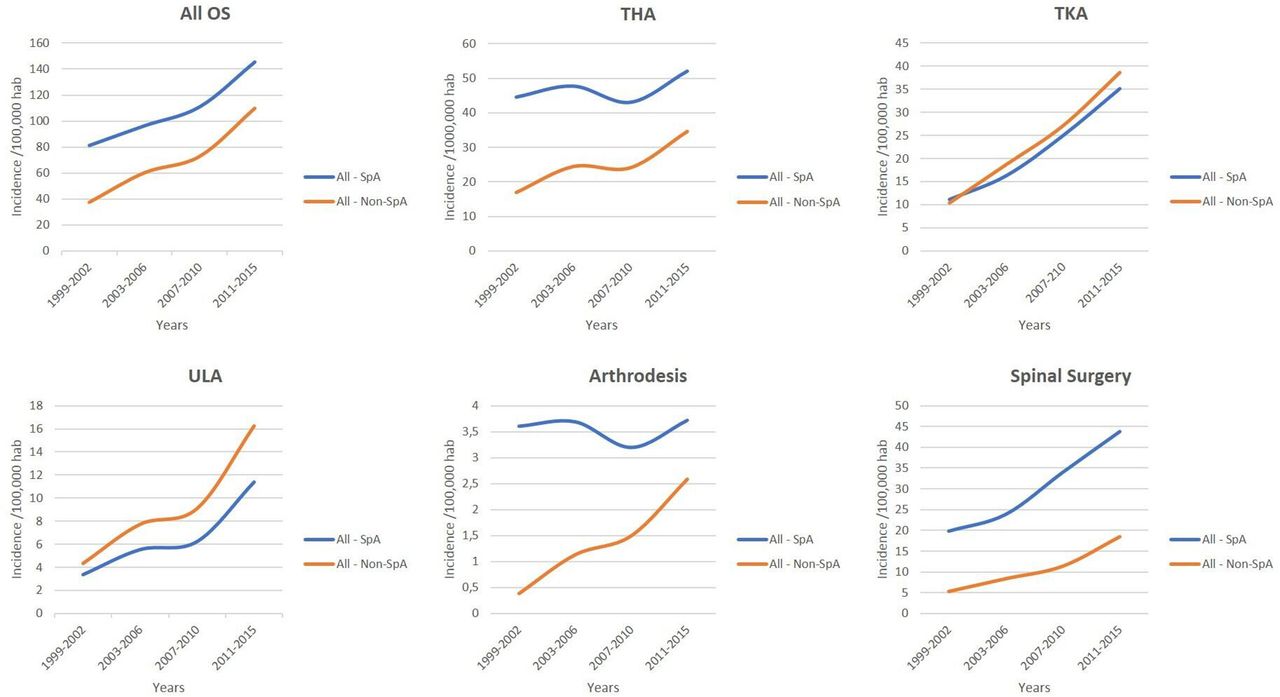
In the SpA cohort, the adjusted rate for total OS was 112.81/100 000 inhab*year (95% CI 109.79 to 115.86); this was slightly higher in women (122.57; 95% CI 117.16 to 128.15) than in men (111.16; 95% CI 107.46 to 114.94). In the non-SpA cohort, the adjusted rate for the total OS was 74.65 (95% CI 72.20 to 77.16); this was higher in women (105.99; 95% CI 100.94 to 111.22) than in men (60.66; 95% CI 57.95 to 63.48). Figure 3 and table 2 show the crude and adjusted rates during the study period. Online supplemental tables 2 and 3 show the crude and adjusted rates for men and women.

Adjusted rates from 1999 to 2015 by type of surgery. OS, orthopaedic surgery; THA, total hip arthroplasty; TKA, total knee arthroplasty; ULA, upper limb arthroplasty.
Crude and adjusted incidence by type of OS, for both sexes
Trends in the incidence of OS
For all the OS included, there was an upward age-adjusted trend in both cohorts: an annual increase of +4.9% was observed in the SpA cohort (IRR 1.05; 95% CI 1.03 to 1.07) and of +8.4% in the non-SpA cohort (IRR 1.08; 95% CI 1.07 to 1.10) (figure 3 and table 3). A statistically significant interaction effect was found with age. While an annual reduction of −1.8% was observed (IRR 0.98; 95% CI 0.96 to 1.01) in the range of 20–40 years in the SpA cohort, this increase was 4.74% (IRR 1.04; 95% CI 1.02 to 1.07) in the non-SpA cohort. In the age range of 40–60 years, an increase of 2% was observed in the SpA cohort, while in the non-SpA cohort, this increase was 7.15%. Similar increases were observed in both cohorts in the age ranges of 60–80 years and older than 80 years (table 3).
Trends in OS for both sexes and by age range and type of surgery
Association between OS (all) and Spa (overall and each type)
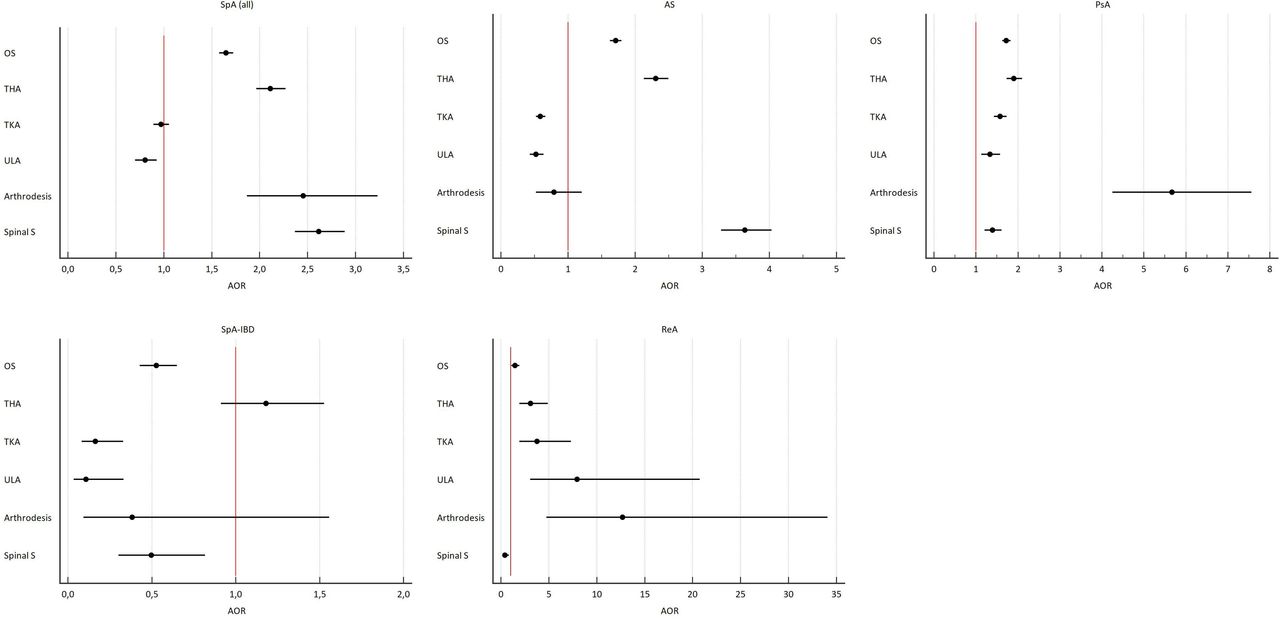
OS was associated with belonging to the SpA cohort (aOR 1.65; 95% CI 1.58 to 1.72). The strength of the association was similar for AS (aOR 1.71; 95% CI 1.62 to 1.79), PsA (aOR 1.72; 95% CI 1.63 to 1.83) and ReA (AOR 1.46; 95% CI 1.11 to 1.93), but not for SpA-IBD (AOR 0.53; 95% CI 0.43 to 0.65) (table 4 and figure 4).
OS risk associated with SpA and non-SpA subtypes. AOR, adjusted OR; AS, ankylosing spondylitis; OS, orthopaedic surgery; PsA, psoriatic arthritis; ReA, reactive arthritis; THA, total hip arthroplasty; TKA, total knee arthroplasty; SpA-IBD, spondyloarthritis associated with inflammatory bowel disease; ULA, upper limb arthroplasty. Variables included in the adjustment: year, age, sex, DM, hypertension, obesity, tobacco use, fx_any, osteoporosis, infectious disease, hyperlipidaemia, cardiovascular disease, Charlson comorbidity index.
Risk of OS associated with SpA and non-SpA subtypes
Incidence of THA
In the SpA cohort, the adjusted rate for THA was 47.48/100 000 inhab*year (95% CI 45.53 to 49.48), and this was higher in men (55.15; 95% CI 52.53 to 57.85) than in women (35.31; 95% CI 32.43 to 38.37). In the non-SpA cohort, the adjusted rate for THA was 26.25 (95% CI 24.79 to 27.80); this was higher in women (33.04; 95% CI 30.21 to 36.08) than in men (23.55; 95% CI 21.82 to 25.36). Figure 3 and table 2 show the crude and adjusted rates during the study period. Online supplemental tables 2 and 3 show the crude and adjusted rates for men and women.
Trends in the incidence of THA
While the trend in the SpA cohort remained practically stable during the study period (+0.9%; IRR 1.01; 95% CI 0.99 to 1.03), an upward trend was observed in the non-SpA cohort, with an annual increase of +5.6% (IRR 1.06; 95% CI 1.04 to 1.07). In the range of 20–40 years, an annual reduction of −5.1% was observed (IRR 0.95; 95% CI 0.91 to 0.99) in the SpA cohort, while in the non-SpA cohort, it remained stable (−1.5%, IRR 0.98; 95% CI 0.93 to 1.04). In the age range of 40–60 years, a reduction of −2.5% was observed in the SpA cohort, while in the non-SpA cohort, there was an increase of 3.7%. Similar increases were observed in both cohorts in the age ranges of 60–80 years and older than 80 years (table 3).
Association between THA and SpA (overall and each type)
THA was associated with belonging to the SpA cohort (aOR 2.11; 95% CI 1.96 to 2.27). The strength of the association observed was greater in ReA (aOR 3.07; 95% CI 1.93 to 4.90) than in AS (aOR 2.30; 95% CI 2.13 to 2.49) and in PsA (aOR 1.91; 95% CI 1.73 to 2.10). There was no association with SpA-IBD (aOR 1.18; 95% CI 0.91 to 1.52) (table 4 and figure 4).
Incidence of TKA
In both cohorts, the adjusted rate for TKA was similar: 23.32/100 000 inhab* year (95% CI 21.98 to 24.73) in the SpA cohort and 25.35/100 000 inhab*year (95% CI 23.95 to 26.86) in the non-SpA cohort, with higher values for women than men in both (figure 3 and table 2). Online supplemental tables 2 and 3 show the crude and adjusted rates for men and women.
Trends in the incidence of TKA
Similar upward trends were observed in both cohorts, with annual increases of +9%. No statistically significant interaction effect was observed with age (table 3).
Association between THA and SpA (overall and each type)
TKA was not associated with SpA (AOR 0.97; 95% CI 0.89 to 1.05). However, AS (aOR 0.59; 95% CI 0.52 to 0.66) and SpA-IBD (aOR 0.16; 95% CI 0.08 to 0.33) were negatively associated with SpA, while PsA (AOR 1.57; 95% CI 1.43 to 1.73) and ReA (AOR 3.76; 95% CI 1.94 to 7.29) were positively associated (table 4 and figure 4).
Incidence of ULA
In both cohorts, the adjusted rate for TKA was 7.18/100 000 inhab*year (95% CI 6.43 to 7.97) in the SpA cohort and 10.11/100 000 inhab*year (95% CI 9.23 to 11.03) in the non-SpA cohort. Values were higher for women than men in both groups (figure 3 and table 2). Online supplemental tables 2 and 3 show the crude and adjusted rates for men and women.
Trends in the incidence of ULA
Similar upward trends were observed in both cohorts, with annual increases of +10%. No statistically significant interaction effect was observed with age (table 3).
Association between ULA and SpA (overall and each type)
ULA was negatively associated with belonging to the SpA cohort (aOR 0.80; 95% CI 0.70 to 0.93) and positively associated with ReA (aOR 7.94; 95% CI 3.04 to 20.73). It was negatively associated with the rest of the SpA cohort (table 4 and figure 4).
Incidence of arthrodesis
In the SpA cohort, the adjusted arthrodesis rate was 3.57/100 000 inhab*year (95% CI 3.03 to 4.14); this was higher in women (5.57; 95% CI 4.49 to 6.89) than in men (2.65; 95% CI 2.12 to 3.29). In the non-SpA cohort, the adjusted rate was 1.55 (95% CI 1.22 to 1.97); this was higher in women (1.97; 95% CI 1.33 to 2.81) than in men (1.37; 95% CI 0.99 to 1.83). Figure 3 and table 2 show the crude and adjusted rates during the study period. Online supplemental tables 2 and 3 show the crude and adjusted rates for men and women.
Trends in the incidence of arthrodesis
While in the SpA cohort, the trend remained practically stable during the study period (+1% IRR 1.01; 95% CI 0.98 to 1.04), in the non-SpA cohort, there was an upward trend with an annual increase of +10.6% (IRR 1.11; 95% CI 1.05 to 1.17). The same pattern was observed in all age ranges (table 3).
Association between arthrodesis and SpA (overall and each type)
Arthrodesis was associated with belonging to the SpA cohort (aOR 2.45; 95% CI 1.87 to 3.23). The strength of the association was greater in ReA (aOR 12.70; 95% CI 4.74 to 34.07) than in PsA (aOR 5.67; 95% CI 4.25 to 7.56). Arthrodesis was not associated with AS or SpA-IBD (table 4 and figure 4).
Incidence of spinal surgery
In the SpA cohort, the adjusted rate for the total spinal surgery was 32.02/100 000 inhab*year (95% CI 30.45 to 33.70); this was slightly higher in women (36.72; 95% CI 33.80 to 39, 84) than in men (30.59; 95% CI 28.66 to 32.60). In the non-SpA cohort, the adjusted rate was 11.70 (95% CI 10.76 to 12.70); this was similar in both men and women. Figure 3 and table 2 show the crude and adjusted rates during the study period. Online supplemental tables 2 and 3 show the crude and adjusted rates for men and women.
Trends in the incidence of spinal surgery
An upward age-adjusted trend was observed in both cohorts: an annual increase of +6.6% in the SpA cohort (IRR 1.07; 95% CI 1.05 to 1.08) and of +10% in the non-SpA cohort (IRR 1.10; 95% CI 1.08 to 1.13) (figure 3 and table 3). However, a statistically significant interaction effect with age was found. While the rate remained stable at +0.6% (IRR 1.01; 95% CI 0.98 to 1.04) for the range of 20–40 years in the SpA cohort, an increase of +7% (IRR 1.07; 95% CI 1.02 to 1.13) was observed in the non-SpA cohort. Similar increases were observed in both cohorts for the ranges 40–60 years, 60–80 years and older than 80 years (table 3).
Association between spinal surgery and SpA (overall and each type)
OS was associated with belonging to the SpA cohort (aOR 2.61; 95% CI 2.37 to 2.89). The strength of the association observed was greater for AS (aOR 3.64; 95% CI 3.28 to 4.03) than for PsA (aOR 1.39; 95% CI 1.20 to 1.61). SpA-IBD and ReA were negatively associated with belonging to the SpA cohort (table 4 and figure 4).
Discussion
Our study period was sufficiently long (1999–2015) to enable an investigation of the trends in specific types of OS in patients with SpA throughout Spain and a comparison with a control group. The initial hypothesis was to evaluate whether the introduction of new strategies in the treatment of patients with SpA (such as the use of biologic therapies or improvement in diagnostic delay) during the study period had a favourable impact on OS rates. While our hypothesis would benefit from further assessment, our results point to a favourable outcome for this approach. The findings that support this statement are as follows1: rates of OS in ages below 60 years decreased, whereas those in the control group increased.2 For patients with SpA, rates of THA and arthrodesis stabilised and even decreased in patients under 60 years, while in the control group, they continued to increase.3 The frequency of spinal surgery stabilised in the 20-year to 40-year age range in the SpA cohort and increased in the control group.4 The average age at which OS was observed in the SpA cohort increased by 9 years (up to 62 years), while in the control group, it remained stable at 63 years.
Unlike other studies, in which only 1 or 2 types of SpA are included, we analysed patients with AS, PsA, SpA-IBD and ReA. This makes it difficult to compare the results. Mertelsmann-Voss et al,14 who included patients with AS and PsA, found similar results to ours and observed a global increase in OS, with a reduction in the subgroup of patients under 45 years of age.14 The authors also found a 6-year increase in the mean age at which OS was performed during the period analysed (1991–2005).14 Nystad et al16 only analysed patients with AS and THA and found a downward trend for THA as well as an increase in the mean age at which THA was performed. Similarly, Bloom et al23 observed a downward trend in the rate of THA in AS. By contrast, in the UK, Hawley et al recorded no decrease in hip arthroplasties in patients with AS.24 However, no reduction in the OS trend was found in those studies, in which only patients with PsA were analysed. Guldberg-Møller et al17 analysed 11 960 patienst with PsA (mean age 50 years; 57% female) from 1996 to 2017. The IRR of any joint surgery was two times as high for patients with PsA as for the general population across all the calendar periods analysed. Among patients with PsA, 2%, 10% and 29% required joint surgery at 5, 10 and 15 years after diagnosis. The risk of surgery in patients with PsA diagnosed at 18–40 years was higher (22%) than in the general population aged 60+ years (20%) after 15 years of follow-up. Nystad et al25 found that 20% of patients with PsA required OS and that the time period of diagnosis did not affect outcome. Other studies with similar results are those of Lewison et al26 and Haque et al.27
The fact that demographic trends in arthroplasty among patients with SpA are converging with trends among patients with noninflammatory conditions suggests that patients with SpA may be increasingly undergoing joint replacement for secondary osteoarthritis rather than inflammatory arthritis. The rates of hip and knee prosthesis continue to be higher in patients with SpA than in the general population. However, as Ward indicates, they increase fundamentally in older patients with SpA, in part due to degenerative problems added by the underlying disease.28 This theory is also supported by the finding that in the SpA group, the rate of arthroplasty was decreasing substantially quicker among patients aged 40 years than among patients in the older age groups, suggesting that DMARDs and biologic agents are effectively reducing inflammatory damage in patients with active SpA.14 Ageing of the total population because of factors such as advances in medical treatment means that an increasing number of older patients with SpA have degenerative joint damage secondary to SpA. These patients undergo more operations related to ageing to preserve physical functioning and quality of life.11
Our study has both strengths and limitations. Its main strengths are its large sample size, the long study period and the standardised methodology, which was maintained throughout the study period. We believe that the duration of the study period, the use of a control group matched by age, sex, region and year of admission and the exhaustive data provided by the MBDS provide sufficient internal validity, which, in quantitative terms, is observed in the consistent frequency in the number of episodes detected each year and, in qualitative terms, in the identification of age groups at higher risk. The limitations of this study must also be highlighted. Given that it is an observational retrospective study, a causal relationship cannot be established with the results found. Even if the MBDS provides information from a network of hospitals that covers more than 98% of the population living in Spain,18 some OS may have not been properly recorded by the public hospital discharge registry, and there may be coding errors. In addition, cases of OS in patients with SpA may not have been coded as SpA, thus implying an underestimation in our results. Another important limitation is that the MBDS does not include data related to treatments, medication consumption, disease duration or disease activity. Similarly, neither the primary nor the secondary diagnoses have been validated.
In summary, in patients with SpA in Spain, we observed a trend in stabilisation of OS, with a decrease in the rates of THA and arthrodesis in ages below 60 years, a decrease in spinal surgery for patients under 40 years and a 9-year difference in age at OS, which reached that of the control group.
Data availability statement
Data are available upon reasonable request.
Ethics statements
Patient consent for publication
Ethics approval
The Ethics Committee of Hospital Fundación Alcorcon assessed the study and gave its approval on 18 December 2018 (ref 18/135).
Acknowledgments
The study is based on data obtained from the Spanish Minimum Basic Data Set provided by the Ministry of Health, Consumption and Social Welfare. Our interpretations and conclusions do not necessarily represent those of the Ministry of Health, Consumption and Social Welfare. The authors thank the staff at the Research Unit of the Spanish Society of Rheumatology (SER) for their support in the editing and translation of manuscript. To my good friend Caligula, who faithfully accompanies me during my research.
References
Supplementary materials
Supplementary Data
This web only file has been produced by the BMJ Publishing Group from an electronic file supplied by the author(s) and has not been edited for content.
Footnotes
Twitter @rmazzucchellie
Contributors RM and NC-V designed the research. RM and EP-F analysed the data. RM, RA, EG-Z, PT-C and AG-V wrote the paper. RM is the guarantor of this work.
Funding This study was supported with a research grant from Pfizer (Pfizer 61029829) awarded to RM.
Competing interests RM has received research funding from Pfizer, Roche, and Amgen for this and other projects.
Provenance and peer review Not commissioned; externally peer reviewed.
Supplemental material This content has been supplied by the author(s). It has not been vetted by BMJ Publishing Group Limited (BMJ) and may not have been peer-reviewed. Any opinions or recommendations discussed are solely those of the author(s) and are not endorsed by BMJ. BMJ disclaims all liability and responsibility arising from any reliance placed on the content. Where the content includes any translated material, BMJ does not warrant the accuracy and reliability of the translations (including but not limited to local regulations, clinical guidelines, terminology, drug names and drug dosages), and is not responsible for any error and/or omissions arising from translation and adaptation or otherwise.