Article Text

Abstract
Objective To determine whether macrophage positron emission tomography (PET)/computed tomography (CT) imaging using (R)-[11C]PK11195 at 0 and 2 weeks is associated with clinical response at 13 weeks in patients with early rheumatoid arthritis (RA).
Methods Whole-body (R)-[11C]PK11195 PET/CT scans were performed at baseline and after 2 weeks of COBRA-light (combination therapy of methotrexate and prednisone) treatment in 35 patients with clinically active early RA. Clinical assessment (Disease Activity Score of 44 joints (DAS44)) was performed at 0, 2 and 13 weeks of treatment. PET/CT scans were assessed visually by two blinded, experienced readers, and by calculating standardised uptake values (SUVs) for shoulders, elbows, hips, knees, and hand and feet joints. Clinical and PET variables were compared using (multivariate) linear regression.
Results 18 males and 17 females were included (baseline DAS44=3.2 ± 1.0). 171 out of 1470 joints were visually PET positive at baseline, decreasing to 100 joints after 2 weeks. In general, small feet joints showed the highest uptake at baseline, and the largest decrease after 2 weeks (Δ0-2). Neither baseline nor Δ0-2 PET measures correlated with DAS44 at 13 weeks. However, at 2 weeks, average SUV of the feet significantly correlated with DAS44 at 13 weeks (R2=0.14, p=0.04). In a multivariable model, DAS44 and average SUV of the feet at 2 weeks showed substantial combined predictive value (combined R2=0.297, p<0.01).
Conclusion Quantitative macrophage PET assessment of feet joints, together with DAS44, after 2 weeks of COBRA light treatment in patients with early RA correlates with clinical response after 3 months of treatment.
- arthritis
- rheumatoid
- inflammation
- therapeutics
Data availability statement
Data are available upon reasonable request.
This is an open access article distributed in accordance with the Creative Commons Attribution Non Commercial (CC BY-NC 4.0) license, which permits others to distribute, remix, adapt, build upon this work non-commercially, and license their derivative works on different terms, provided the original work is properly cited, appropriate credit is given, any changes made indicated, and the use is non-commercial. See: http://creativecommons.org/licenses/by-nc/4.0/.
Statistics from Altmetric.com
Key messages
What is already known about this subject?
New tools to evaluate treatment response in patients with early rheumatoid arthritis (RA) are urgently needed.
Positron emission tomography (PET) has shown potential to predict clinical response at an early stage in the treatment of patients with RA.
What does this study add?
This is the first study that assesses the potential of whole-body macrophage PET/CT to predict response to treatment in patients with early RA.
PET imaging of the feet joints after 2 weeks of treatment correlates significantly to clinical response after 3 months of treatment, contributing independently from the Disease Activity Score of 44 joints score at 2 weeks to the prediction of the clinical response at 3 months.
How might this impact on clinical practice or further developments?
Early assessment of clinical response through the use of macrophage PET imaging could potentially improve treatment efficacy in patients with early RA.
Background
Rheumatoid arthritis (RA) is an autoimmune disease which primarily affects the synovial joints and causes chronic inflammation, leading to bone and cartilage damage.1 RA bears a significant strain on both individual patients and society, affecting 0.25% of the global population and causing a severe decrease in quality of life, participation and general well-being.2 Recent international guidelines state that ‘therapy […] should be started as soon as the diagnosis of RA is made’, in order to reach remission and limit further damage and disability.3 However, despite improved treatment schedules, clinical assessment of treatment response takes a minimum of 12 weeks.
New tools are urgently needed to help clinicians to evaluate treatment response as early as possible, in order to continue treatment or switch to another treatment modality. Although conventional radiography is frequently used to aid clinical assessment of RA, it is not sensitive enough to detect changes in early disease.4 Ultrasonography (US) is valuable in its assessment of synovial hypertrophy and can assess even the smallest anatomical alterations through the use of high-resolution equipment.5 However, training examiners costs time, results are examiner dependent and the technique is ill suited for the assessment of deep joints.6 Magnetic resonance imaging (MRI) can assess both soft tissue, cartilage and bones, is highly sensitive and can detect erosions 3 years prior to conventional radiography.5 However, MRI does not allow for the detection of subclinical arthritis and performs poorly in predicting future radiologic damage and flares.7 8
Positron emission tomography (PET) is a non-invasive nuclear imaging technique with high sensitivity and has the potential of high specificity by using specific tracers.9 10 While imaging techniques such as computed tomography (CT), MRI and US provide anatomical and functional data, PET can provides quantitative molecular data of the whole body in a single imaging session.10 Moreover, PET imaging has shown to be more useful for monitoring disease activity and therapeutic effects relative to other nuclear imaging techniques such as scintigraphy, because its quantitative data are highly accurate and reproducible, resulting in high sensitivity.11 In addition, PET tracers can be developed that specifically target immune cells or molecules of interest, to provide specificity for RA. Previous research showed that PET imaging could be used as a tool to predict the clinical outcome early in the treatment of patients with RA.12 13 However, these studies were not performed with tracers that specifically target cells that are present in arthritic joints.
The macrophage is a central target for PET imaging of RA, because of its infiltration in synovium from the early development of RA onwards.14–16 Thus far, macrophages have been identified by immunohistochemical methods, using synovial samples obtained by arthroscopy.17–20 Although well established, these methods are time consuming and require invasive arthroscopy. Recently, non-invasive visualisation of macrophages in joints of patients with RA by PET imaging was demonstrated, both in pre-RA, clinically active disease and in remission.8 21 Promising results were obtained with intravenous administration of the radiolabelled macrophage receptor ligand (R)-[11C]PK11195 (1-(2-chlorophenyl)-N-methyl-N(1-methyl-propyl)−3-isoquinoline carboxamide).21–23 PK11195 binds to the translocator protein, formerly known as the peripheral benzodiazepine receptor, which is mainly found on (activated) macrophages and monocytes.24
The goal of this study was to explore the association between changes in macrophage PET activity (both visually and quantitatively) between 0 and 2 weeks and the clinical response after 13 weeks, and as such investigate the potential predictive value of macrophage PET for later clinical response.
Methods
Patients
Thirty-five patients with RA de novo who were participating in a larger treat-to-target cohort were included between April 2015 and December 2017. Inclusion criteria for the cohort were RA based on American College of Rheumatology(ACR)/European Alliance of Associations for Rheumatology(EULAR) criteria,25 minimum of 18 years of age and problems for 2 years or less. Exclusion criteria were previous treatment with disease-modifying antirheumatic drugs (DMARDs) and/or corticosteroids, insulin-dependent diabetes mellitus, decompensation cordis class 3 and 4 as based on the New York Heart Association (NYHA) classification, instable hypertension, decreased kidney function, elevated liver markers, contraindications for the study medication and signs of tuberculosis.
Based on several clinical factors, patients were allocated to risk groups for high or low chance of fast progression of the disease. Patients were considered to be ‘high risk’ if they had at least two of the following prognostic factors: a C reactive protein (CRP) of ≥35 mg/L or erythrocyte sedimentation rate (ESR) ≥50 mm/hour, positive for immunoglobulin M rheumatoid factor, positive for anticyclic citrullinated peptide or one or more erosions. If patients had one or none of these prognostic factors, they were considered ‘low risk’. Patients from the high-risk group were asked to participate in the PET/CT substudy. In addition to the main criteria, patients could be included to the PET/CT substudy if they had at least two active joints (defined as swollen at clinical evaluation). Patients were excluded from the study if they had been exposed to radioactivity above 5 mSv in the last year as part of research, had taken experimental drugs in the previous 3 months, or if they were either pregnant or breast feeding. Patients using benzodiazepines were asked to discontinue treatment at least 10 days prior to inclusion.
Following inclusion, demographical and clinical data were collected. Patients were asked extensively about medical history, previous rheumatological problems, medication use and daily functioning. In order to evaluate clinical activity, physical examination of 44 joints26 and blood withdrawal for inflammation markers were performed.
Study design and clinical follow-up
All patients were started on COBRA light therapy (combination therapy in early RA).27 The treatment schedule is summarised in table 1. Patients received standard clinical care and clinical evaluations by assessing Disease Activity Score of 44 joints (DAS44) at 0, 2, 4 and 13 weeks of treatment. All clinical data were obtained by an experienced researcher blinded to the imaging data. At 13 weeks, the response to medication was assessed based on the (change in) disease activity. Patients were grouped according to EULAR response.26
COBRA light therapy schedule
PET/CT imaging
Patients received whole-body (R)-[11C]PK11195 PET/CT scans at baseline and after 2 weeks of COBRA light treatment. (R)-[11C]PK11195 was synthesised according to Good Manufacturing Practice at the Radionuclide Center; a facility located at the VU University campus (Amsterdam, The Netherlands) with a manufacturing license.21 A Gemini TF scanner (Cleveland, Tennessee, USA) or Ingenuity TF scanner (Cleveland, Ohio, USA) was used for PET/CT scanning. No fasting or premedication was required. Patients received one venous cannula for injection of 370%±10% MBq (R)-[11C]PK11195. After injection, the cannula was flushed with 20 mL NaCl 0.9%, and the cannula was removed and measured for residual activity.
Scanning was started 20 min after injection of (R)-[11C]PK11195. Patients were positioned in supine position with the ventral side of the hands on the upper legs. To minimise movement, hands were placed in a special vacuum pouch for immobilisation, knees were supported by a small cushion and feet were placed in a special fixation apparatus for immobilisation. The whole-body scanning progress was performed in three parts to reduce exposure to radioactivity as much as possible, resulting in three consecutive static emission scans of the upper body (shoulders to fingertips), knees and feet. Patients were scanned for 4 min per bed position. Each emission scan was preceded by a low-dose CT scan which was used for attenuation correction purposes and for anatomical localisation. Patients were scanned for 45–60 min, depending on their length.
Imaging analysis
Two independent experienced readers blinded to clinical data scored images visually. In case of differences in rating between readers, the final score was determined during a consensus session. All joints of the DAS44 were marked on a scale from 0 to 3 based on the appearance of (R)-[11C]PK11195 joint uptake, with 0 for no activity and 3 for the highest activity, providing a range of 0–132 per patient. For the present analyses, joints with a score of 0 were classified as PET negative joints and those with a score ≥1 were classified as PET positive. Only articular tracer uptake in joints was included in assessment of PET positivity of joints, not periarticular uptake or uptake in tendons. Baseline and follow-up scans were compared with see whether any reduction in activity had occurred.
(R)-[11C]PK11195 uptake in the joints was quantified by drawing fixed size volumes of interest (VOIs) over 42 predefined joints: shoulders, elbows, wrists, metacarpophalangeal (MCP) joints, proximal interphalangeal (PIP) joints, hips, knees, ankles, and metatarsophalangeal (MTP) joints. VOIs were drawn using software developed in-house that takes the low-dose CT as anatomical reference, with the exact position depending on the focus of tracer accumulation in the joint. Standardised uptake values (SUVs) were calculated by dividing the radioactive concentration in each VOI by the injected radioactivity, and normalising it to body weight. The value used to represent tracer uptake was SUVpeak, defined as the highest average uptake within a sphere of 1.2 mL (hereafter referred to as SUV).28 29
Statistical analysis
Continuous variables with Gaussian distribution were summarised as mean±SD and 95% CI. Variables that were non-normally distributed were summarised as median and IQR. SPSS V.22.0 software (SPSS) was used to determine the distribution of both clinical and PET/CT data. Visual interpretation of the PET/CT data was performed with descriptive statistics. Both visual and quantitative values at joint level were reported with left and right combined or in groups (for MCP2-5 joints, PIP joints and MTP 2–5 joints). As previous research confirmed that a dichotomised version of the visual score provided better agreement with clinical values than a categorical score, visual PET scores were dichotomised.30 Univariate regression analyses correlated DAS44, ESR, CRP, the sum of visually positive joints, and the average SUV in hand joints, feet joints and all joints in the body with the DAS44 score at 13 weeks. First, changes in PET values between 0 and 2 weeks were correlated, then baseline PET values, and finally PET values at 2 weeks. After performing univariate regression, clinical and PET measures at 2 weeks were combined through multivariable regression to assess whether they provided similar or distinct information. Squared correlation coefficients were classified as very weak (R2 <0.02), weak (R2=0.02–0.13), moderate (R2=0.13–0.26), or substantial (R2 >0.26).31 A p value smaller than 0.05 was considered to be significant. A total of 42 statistical tests were performed. As this is an explorative study, no corrections for multiple testing were applied.
Results
Baseline and longitudinal clinical data
Baseline patient demographics, clinical and functional characteristics of the 35 patients are shown in table 2. At baseline, patients demonstrated moderate disease activity, with a mean (±SD) DAS44 score of 3.2±1.0, range 1.4–6.9. After 13 weeks of treatment, the mean (±SD) DAS 44 score had decreased in all but two patients, with a mean of 1.4±0.8. The distribution of EULAR response at 13 weeks of treatment was 24 good responders (69%), 6 moderate responders (17%) and 5 non-responders (14%).
Baseline patient demographics, clinical and functional characteristics
Neither DAS44 score nor CRP at baseline were predictive for the DAS44 score at 13 weeks, with R2 values ranging from 0.02 to 0.05. The change in both DAS44 score and CRP between 0 and 2 weeks did not provide a statistically significant correlation either (R2=0.02, p=0.4 and R2=0.05, p=0.2, respectively). The DAS44 score itself at 2 weeks showed a moderate and statistically significant correlation with the DAS44 score at 13 weeks, but the CRP value at 2 weeks did not (R2=0.18, p=0.01 and R2=0.1, p=0.4, respectively).
PET/CT data
All but one of the 35 patients demonstrated visually enhanced tracer uptake in one or more joints on PET/CT. A total of 171 (out of 1470) joints (12%) were visually PET positive at baseline. Ninety per cent of PET/CT positive sites were located either in the wrists (n=26, 15%), small hand joints (n=63, 37%) or small feet joints (n=68, 40%). After 2 weeks, the total number of PET positive joints had decreased to 100, with the highest decrease in the number of PET positive MCP joints and PIP joints (n=12 and n=26 at 2 weeks, respectively), with a 53% and 63% decrease, respectively. The distribution of PET positivity remained approximately the same, with 18% in the wrists (n=18), 25% in the small hand joints (n=25) and 48% in the small feet joints (n=48). An example of decrease in uptake in hand and feet joints is provided in figure 1.
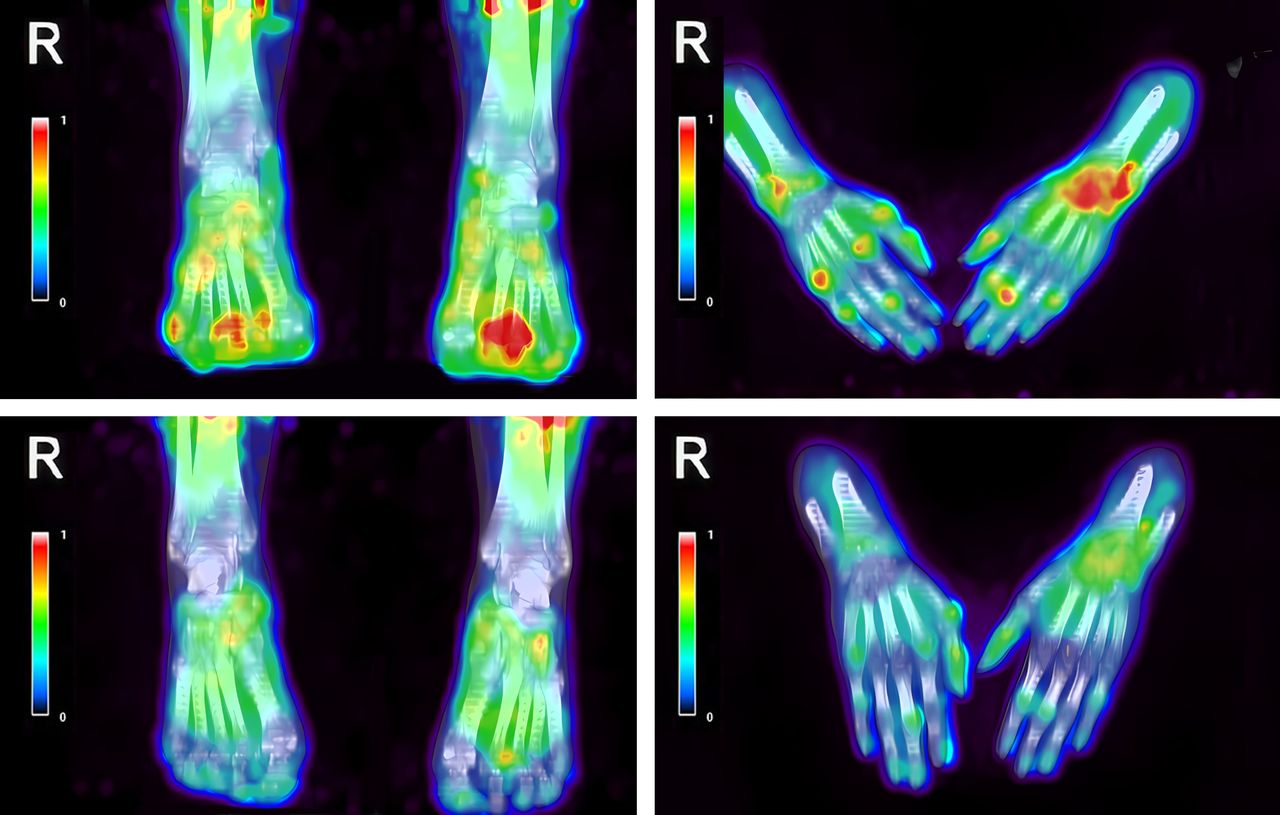
Decrease of (R)-[11C]PK11195 uptake in the hand and feet joints of an patient with rheumatoid arthritis (RA) with polyarthritis, before (top) and 2 weeks after initiation of COBRA light treatment (bottom).
At baseline, quantitative PET data showed the highest average SUV in the hips, and the lowest in MCP5 joints. At 2 weeks, the highest decrease in average SUV was seen in the feet joints (ankles and MTP joints). Notably, the average SUV in the shoulders and hips had increased. These results are summarised in table 3.
Average SUV (mean±SD) at 0 and 2 weeks and the decrease over 2 weeks in several joint groups
Comparison of PET/CT data with clinical data
The average SUV in the feet at 2 weeks correlated significantly with the DAS44 at 13 weeks, although the correlation was moderate (figure 2, R2=0.14, p=0.04). Although whole-body SUV at 2 weeks also showed significant correlation in univariate analysis, the level of correlation was very low (R2=0.03, p=0.04). Neither visual nor quantitative PET data at baseline and differences between baseline and 2 weeks showed a correlation with DAS44 at 13 weeks. Using the relative change (in %) in SUV instead of the absolute change in SUV between 0 and 2 weeks did not improve the correlation with the DAS44 score at 13 weeks. All univariate analyses between PET values and DAS44 score at 13 weeks are summarised in table 4.
Correlations between several independent variables and DAS44 score at 13 weeks

Correlation of average standardised uptake values (SUV) in the feet at 2 weeks with Disease Activity Score of 44 joints (DAS44) score at 13 weeks.
In multivariable regression, both DAS44 and average SUV in the feet at 2 weeks contributed independently to the prediction of DAS44 at 13 weeks, showing a substantial correlation (figure 2, combined R2=0.297, p<0.01). The combination of DAS44 and average SUV in the whole body at 2 weeks also significantly correlated to DAS44 at 13 weeks, although only providing a moderate correlation (combined R2=0.219, p=0.03).
Discussion
This proof-of-concept study highlights the potential of quantitative whole-body macrophage PET/CT including the feet to assess treatment efficacy in patients with early RA as early as 2 weeks after start of treatment. The data show that quantitative assessment of arthritis on PET/CT as early as 2 weeks has predictive value for the clinical response to treatment, especially when combined with the DAS44 score. In particular, assessment of the feet on PET/CT combined with the DAS44 score at 2 weeks showed substantial correlation with therapeutic outcome at 13 weeks in this cohort of patients with early RA. In general, however, correlations were weak both for clinical as for PET assessments.
The value of PET/CT imaging for visualisation of inflammatory arthritis has been documented previously.13 32–34 In addition, several studies have demonstrated the potential of PET/CT in (early) patients with RA to predict therapy response at a later stage.12 13 In these studies, [18F]fluorodeoxyglucose ([18F]FDG) was used as a more general (non-specific) inflammation tracer and with more limited scan protocols, not including all joints of the body. In the present study, the macrophage tracer (R)-[11C]PK11195 and quantitative whole-body imaging with inclusion of the feet were used. In several previous studies, (R)-[11C]PK11195 targeting on PET/CT allowed for selective binding to (activated) macrophages in synovial tissue, providing a sensitive reflection of RA disease activity.21–23 Recently, our group demonstrated the additional value of quantitative assessment of macrophage imaging in RA as well as the value of imaging the feet for identifying clinical RA disease activity, as was prepublished in an abstract in the Annals of the Rheumatic Diseases.30 In the present follow-up study, it is shown that this approach may also be useful at 2 weeks of treatment to predict therapy response at 13 weeks. However, the PET outcome measures found to be predictive in this proof-of-concept study differed when compared with previous research. Previous studies found predictive value of quantitative PET changes over 2 weeks, for both infliximab and DMARD combination therapy.12 13 In the current study, PET changes between 0 and 2 weeks were not predictive, only quantitative PET measures at 2 weeks of treatment, despite inclusion of all joints of the body and a more selective tracer. In addition, a predictive value of baseline macrophage PET could have been expected based on earlier histological studies, suggesting baseline synovial macrophage infiltration to be a potential biomarker for later clinical treatment response, but this was not observed in the present study.19 35
A very interesting finding is the value of quantitative feet imaging for prediction of treatment response. To date, feet have been excluded in most PET studies of patients with RA, although early RA often involves or starts in the small feet joints.36 In addition, clinical disease activity in feet is difficult to assess clinically, and macrophage PET seems to be highly sensitive to detect early local disease activity which seems to have predictive value for later treatment outcome. If the latter is confirmed in future studies, the PET protocol could even be simplified by only scanning the feet instead of the whole body. This would substantially reduce scanning time and make it easier to implement the procedure in routine clinical practice.
This study is the first to assess the value of macrophage PET imaging for therapy monitoring, including glucocorticoids, with no previous data on the direct influence of therapy on macrophage PET parameters being available. The influence of treatment on macrophage infiltration in synovial tissue has been investigated in several arthroscopy studies. For instance, Gerlag et al (Arthritis Rheum, 2004) demonstrated the association between prednisolone therapy in RA and a notable reduction in macrophage infiltration in synovial tissue, already at 2 weeks of treatment, which indicated that synovial macrophage numbers could be of use as an early biomarker for clinical efficacy.37 The use of macrophages in the synovial sublining to predict possible efficacy of several different types of antirheumatic treatment, all including DMARD’s and some including (high) doses of glucocorticoid therapy, was later confirmed.20 Whereas this study is the first to investigate macrophage PET imaging in the setting of a therapy monitoring study, previous research with [18F]FDG found similar results of predictive value of PET/CT at 2 weeks for clinical response at 12 weeks for combination therapy of DMARDs and low-dose glucocorticoids.13 Previous research by our own group has demonstrated the value of (R)-[11C]PK11195 for non-invasive in vivo imaging of macrophages in (sub)clinical rheumatoid synovitis. Although some influence of therapy on imaging parameters cannot be ruled out, it does not seem likely.
The study also has some methodological pitfalls. First, the patient data were rather homogenous with rather low disease activity (mean DAS of 3.2) at baseline and a general high response to treatment. The average baseline disease activity of the current cohort was moderate, with a DAS44 at inclusion of 3.2±1.0 and only two patients with a DAS44 score of 5.0 or higher. Other studies have found a strong predictive value of a high baseline DAS for non-response to methotrexate.38 39 In addition, a moderate to high starting prednisone dose is part of in COBRA (light) schedule. It has been shown that addition of prednisone to methotrexate treatment significantly increases the likelihood of good EULAR response.40 Indeed, the present population showed a very high response to treatment, with 69% of patients being qualified as a ‘good’ responders at 13 weeks, and only 5 (14%) non-responders. Due to this small number of non-responders, it was not possible to assess a potential association between specific PET outcome measures and non-response to COBRA (light) therapy. Second, although macrophage tracers provide selective binding compared with [18F]FDG, the currently applied first generation macrophage tracer (R)-[11C]PK11195 has a relatively high periarticular background uptake, which hampers visual differentiation of small changes in joint uptake.21 22 Future studies should use second generation macrophage or other more specific macrophage tracers to improve on signal to background ratios.41 42 Further, the limited spatial resolution of the currently available PET (̴ 4 mm) affects the sensitivity of PET to depict inflammatory activity in smaller joints, potentially leading to false negative results. This can potentially be improved by the upcoming total body PET scanners with significantly higher sensitivity. Finally, although all efforts were made to prevent movement during scanning, slight patient movements could still have hampered correct reconstruction of the PET signal.
Data availability statement
Data are available upon reasonable request.
Ethics statements
Patient consent for publication
Ethics approval
This study was approved by Medical Ethics Review Committee of the VU University Medical Center. Participants gave informed consent to participate in the study before taking part.
Acknowledgments
We would like to thank Stefan Bruijnen for his help in establishing the study protocol, Judith van Es for all of her time and effort in planning the PET/CT scans and Linda Rasch, Samina Turk and Ewa Platek for excellent patient care.
References
Footnotes
Contributors NV: study design, collecting data, analysing data, interpretation of data, writing manuscript. GZ and JdJ: collecting data, analysing data, correcting manuscript. MtW, AL, AV and MB: interpretation of data, correcting manuscript. MY: analysing data, interpretation of data, correcting manuscript. DvS and WL: study conception and design, interpretation of data, correcting manuscript. CvdL: study conception and design, analysing data, interpretation of data, writing manuscript, responsible for overall content as the guarantor.
Funding This work was supported by Pfizer, Abbvie, ReumaNederland [14-1-302] and ZonMw [436001001].
Competing interests None declared.
Provenance and peer review Not commissioned; externally peer reviewed.