Article Text

Abstract
Objective In the ORAL (Oral Rheumatoid Arthritis triaL) Surveillance study of patients with rheumatoid arthritis aged ≥50 years with ≥1 additional cardiovascular risk factor, incidence of pulmonary embolism was higher with tofacitinib 10 mg two times per day than with tumour necrosis factor inhibitors (TNFi). This exploratory post hoc analysis examined whether biomarkers explained the associations of tofacitinib versus TNFi with venous thromboembolism (VTE).
Methods ORAL Surveillance was a prospective, open-label, event-driven, non-inferiority, postauthorisation safety study. Patients were randomised 1:1:1 to receive tofacitinib 5 mg or 10 mg two times per day or a TNFi. For this analysis, 294 soluble, proteomic, genetic and antibody biomarkers (of which 79 had a known role in inflammation, coagulation, vascular biology or Janus kinase signalling) were quantified in serum collected at baseline, month 12 and study end.
Results Overall, 4362 patients were randomised and treated. The exploratory biomarker data set included 285 patients (57 VTE cases; 228 matched controls). D-dimer was quantified in 3732 patients (54 VTE cases; 3678 controls). No biomarker demonstrated a clear mechanistic association with the increased risk of VTE for tofacitinib versus TNFi. Month 12 D-dimer levels were positively associated with risk of a subsequent VTE within the tofacitinib 5 mg and 10 mg two times per day arms.
Conclusions Overall, this post hoc analysis did not identify biomarkers that explained the increased VTE risk for tofacitinib versus TNFi. Individual VTE risk should be considered when making decisions about initiation or maintenance of tofacitinib treatment.
Trial registration number NCT02092467; ClinicalTrials.gov.
- arthritis, rheumatoid
- antirheumatic agents
- cardiovascular diseases
Data availability statement
Data are available upon reasonable request. Upon request, and subject to review, Pfizer will provide the data that support the findings of this study. Subject to certain criteria, conditions and exceptions, Pfizer may also provide access to the related individual de-identified participant data. See https://www.pfizer.com/science/clinical-trials/trial-data-and-results for more information.
This is an open access article distributed in accordance with the Creative Commons Attribution Non Commercial (CC BY-NC 4.0) license, which permits others to distribute, remix, adapt, build upon this work non-commercially, and license their derivative works on different terms, provided the original work is properly cited, appropriate credit is given, any changes made indicated, and the use is non-commercial. See: http://creativecommons.org/licenses/by-nc/4.0/.
Statistics from Altmetric.com
What is already known about this subject?
In the ORAL Surveillance study of patients with rheumatoid arthritis aged ≥50 years with ≥1 additional cardiovascular risk factor, incidence of pulmonary embolism was higher with tofacitinib 10 mg two times per day than with tumour necrosis factor inhibitors (TNFi).
What does this study add?
This post hoc analysis of 294 soluble, proteomic, genetic and antibody biomarkers did not identify any biomarkers that were mechanistically associated with the increased venous thromboembolism (VTE) risk for tofacitinib versus TNFi in ORAL Surveillance.
D-dimer levels at month 12 were positively associated with risk of a subsequent VTE within the tofacitinib 5 mg and 10 mg two times per day arms.
How might this impact on clinical practice?
Individual VTE risk should be considered when making decisions about initiation or maintenance of tofacitinib treatment.
The decision to monitor D-dimer levels should be made by clinicians on an individual patient basis, with full consideration of the merits of D-dimer assessment in the context of patient presentation, disease activity and tofacitinib exposure.
Introduction
Venous thromboembolism (VTE) is a multifactorial disease encompassing deep vein thrombosis (DVT) and pulmonary embolism (PE). The pathogenesis of VTE reflects a combination of inherited and acquired risk factors.1 Risk factors for VTE may be transient or persistent, and they are broadly categorised as relating to hypercoagulability, stasis and endothelial injury.1
The incidence of VTE ranges from 104 to 183 per 100 000 person-years in Western populations and increases with age.2 3 Patients with autoimmune disorders, including rheumatoid arthritis (RA), have approximately double the risk of VTE compared with the general population.4–7 This increased risk likely reflects crosstalk between inflammation and coagulation, including endothelial dysfunction and increased tissue factor expression induced by inflammatory cytokines.8 Notably, patients with RA have elevated levels of D-dimer, a VTE biomarker and C-reactive-protein (CRP), a marker of inflammation. Furthermore, markers of RA disease activity also correlate with levels of D-dimer and CRP9 and are strongly associated with VTE risk,5 supporting the link between coagulation and inflammation. Accordingly, the impact of pharmacological treatments for RA on the risk of VTE should be carefully assessed.
Tofacitinib is an oral Janus kinase (JAK) inhibitor for the treatment of RA. ORAL (Oral Rheumatoid Arthritis triaL) Surveillance was a phase IIIb/IV safety study conducted from March 2014 to July 2020 to evaluate the safety of tofacitinib 5 mg two times per day and tofacitinib 10 mg two times per day compared with a tumour necrosis factor inhibitor (TNFi) in patients with moderate to severe RA ≥50 years of age with at least one additional cardiovascular risk factor.10 In February 2019, the Data Safety Monitoring Board (DSMB) identified an increased frequency of PE with tofacitinib 10 mg two times per day versus TNFi and increased overall mortality in the tofacitinib 10 mg two times per day arm, compared with the arms receiving tofacitinib 5 mg two times per day or TNFi.
To address the findings for PE, this exploratory post hoc analysis was undertaken to identify potential mechanistic biomarker and pharmacogenomic associations of tofacitinib and TNFi with VTE in ORAL Surveillance. Specifically, we sought to determine whether any biomarkers could explain the increased risk of VTE in the tofacitinib 10 mg arm relative to TNFi or identify patients receiving tofacitinib at a higher risk of VTE, as well as describe differentiating characteristics between patients with and without VTE.
Patients and methods
Study design
ORAL Surveillance (NCT02092467) was a prospective, randomised, open-label, event-driven, non-inferiority, postauthorisation safety endpoint study with the coprimary endpoints of adjudicated major adverse cardiovascular events (MACE) and malignancies. Details of the study design, including the study protocol, have been published previously.10 Patients were randomised 1:1:1 to receive open-label tofacitinib 5 mg two times per day, tofacitinib 10 mg two times per day or TNFi (adalimumab 40 mg every 2 weeks subcutaneously (USA, Puerto Rico and Canada) or etanercept 50 mg once weekly subcutaneously (rest of the world)). Patients continued background methotrexate treatment unless modification was indicated. After the February 2019 DSMB findings for PE and mortality, the adjudication of VTE events (PE and DVT) was added to the study protocol, and the study was modified to discontinue treatment with tofacitinib 10 mg two times per day while continuing the other treatment arms. Patients receiving tofacitinib 10 mg two times per day reduced their dose to 5 mg two times per day. Plasma and serum samples were collected at baseline, at month 12 and at the end-of-study visit (which was conducted within 1 month of study completion, when the targeted number of MACE and malignancies (excluding non-melanoma skin cancer) had been met). A blood sample for DNA genotyping was collected at baseline.
The inclusion and exclusion criteria for patients enrolled in ORAL Surveillance have been published previously.10 In brief, patients were required to be ≥50 years of age and to have had at least one additional cardiovascular risk factor (current cigarette smoker, hypertension, high-density lipoprotein cholesterol <40 mg/dL, diabetes mellitus, family history of premature coronary heart disease or personal history of coronary artery disease or extra-articular RA).
Biomarkers assessed
Biomarkers selected for analysis included those used for VTE assessment or those related to inflammation, platelet levels or platelet activation state, the coagulation cascade, vascular biology or those known to affect JAK pathways (online supplemental table 1). Soluble and proteomic biomarkers were classified into tiers for a multiple-testing hierarchy based on a priori interest, with tier 1 being of greatest relevance and tier 4 being less relevant due to lack of preselection by the criteria cited above. Tier 1 included CRP, D-dimer and thrombopoietin (TPO). Tier 2 included factor VIII (FVIII), thrombin–antithrombin complex (TAT), tissue factor pathway inhibitor (TFPI), plasminogen activator inhibitor-1 (PAI-1), levels of protein C and antithrombin (AT), apolipoprotein C-III (apoCIII) and leptin. Tiers 3 and 4 included 276 markers from a high-throughput proteomic assay (Olink Proteomics, Uppsala, Sweden) that were added to encompass biomarkers beyond the prespecified analytes identified above. Of these, 61 proteins of interest were classified as tier 3 based on their putative relationship to VTE, the coagulation cascade, endothelial function or inflammation, and the remaining 215 proteins with no clear association with VTE or inflammation were classified as tier 4.
Supplemental material
In addition to the predefined tiers of soluble and proteomic biomarkers, genotyping was carried out at baseline to assess the presence of two common inherited mutations associated with thrombophilia, the factor V Leiden R506Q mutation (rs6025)11 and the prothrombin (factor II) G20210A mutation (rs1799963).12 The somatically acquired JAK2 V617F mutation (rs12343867) was also assessed because of its known association with VTE.13 The serum levels of four antiphospholipid antibodies (anticardiolipin antibody (ACA), immunoglobulin G (IgG), M (IgM) and anti-beta-2-glycoprotein 1 (β2GP1) IgG and IgM) were also quantified at baseline and month 12 because of their association with immune disorders and VTE.14 15 Thus, a total of 294 soluble, proteomic, genetic and antibody markers were assessed, with 79 of these being predefined.
As D-dimer levels ≥2× the upper limit of normal (ULN) have been used in clinical trials to identify hospitalised medically ill patients at elevated risk of VTE,16–18 the prognostic value of a dichotomised 2× ULN cut-off for D-dimer was also evaluated post hoc as a further analysis within the tofacitinib treatment arms. Other potential dichotomous D-dimer cut-offs (integer multiples of ULN) were also explored in the exploratory biomarker data set; however, as these demonstrated limited prognostic value, results are not presented here.
Analyses exploring the associations between VTE risk factors, D-dimer levels and VTE events were performed to investigate an approach for the monitoring of D-dimer levels to assess VTE risk.
Patient selection and sample availability
Three data sets were used for these analyses: the full clinical data set, the exploratory biomarker data set and the D-dimer data set. Measurement of CRP and platelet counts was performed in the full clinical data set during the trial. For this post hoc analysis, CRP and platelet data at baseline and month 12 were obtained from the unplanned 22 February 2019 data cut and classified into patients with an incident VTE event (cases) and patients without incident VTE (controls) according to adverse event data from patient case report forms (CRFs). All other biomarkers were analysed retrospectively with banked samples from baseline and month 12. The exploratory biomarker data set included VTE cases identified from CRFs with events occurring by 22 February 2019, with four controls matched to each case based on treatment arm, age and sex. The matched controls were selected, so that the distribution of their follow-up times matched those for VTE controls in the full clinical data set (by deciles). To avoid the confounding effect of anticoagulation treatment, patients with VTE events that occurred prior to the month 12 visit were excluded from the month 12 analyses. Analyses from the exploratory biomarker data set identified one biomarker, D-dimer, to carry forward for more extensive analysis.
The D-dimer data set, therefore, used all available samples from final source-verified data up to 1 August 2019, including the end-of-study visit in addition to baseline and month 12. For the D-dimer data set, all adjudicated VTE cases occurring within 28 days of the last study treatment were included; the control group was the full cohort of patients reporting no VTE events until last follow-up. Samples from patients treated with anticoagulants prior to sample collection were excluded at all time points (aspirin use was permitted).
The selection of biomarkers and extent of the analyses were limited by the number and types of samples collected during the study. By necessity, patients with unavailable samples and samples with assay failure were omitted from all analyses. Sample availability by time point, treatment arm and timing of event (before or after month 12) is shown in online supplemental table 2. For plasma, only samples derived from blood collected in EDTA were available. For some analytes, matched citrate and EDTA plasma collected from a cohort of healthy donors were compared.
Supplemental material
Statistical methods
Each biomarker was assessed for its role in VTE (DVT and PE events combined, or PE alone) in three ways: (1) prospective association of the biomarker with incident events in at least one treatment arm, (2) pre-existing differences in the biomarker by treatment arm that might explain the increased number of events in combination with prospective associations with incident events and (3) treatment-related changes in the biomarker that might be directly associated with incident events or that might explain the increased number of events in combination with the prospective associations with incident events.
The statistical testing is fully described in online supplemental methods and online supplemental table 3. Briefly, the predefined statistical criteria used to identify biomarkers of potential interest included: a fully adjusted, significant (false discovery rate of ≤0.05) prospective association with VTE in the tofacitinib treatment arm(s) or a nominally significant association in conjunction with a fully significant treatment effect (tofacitinib vs TNFi) on the change in biomarker levels in a direction matching the association with VTE risk.
Cox proportional hazards regression was used for all models testing for prospective associations with incident events. For the exploratory biomarker data set, inverse probability weighting was also used to account for the mismatch between the artificial 1:4 case-to-control ratio and the actual such ratio in the full clinical data set.
Results
Patients
Overall, 4362 patients were randomised and treated in ORAL Surveillance. These patients comprised the full clinical data set, which included 63 VTE cases and 4299 controls. A total of 285 patients were included in the exploratory biomarker data set (57 VTE cases and 228 controls matched for age, sex and treatment arm) (online supplemental table 4). The D-dimer data set included 54 VTE cases and 3678 controls (table 1). The number of VTE cases varied slightly between the three data sets due to the use of different data cut-offs, adjudication, sample availability and the censoring of events that occurred >28 days after the last study treatment.
Patient demographics and baseline disease characteristics (D-dimer data set*)
Patient characteristics for the D-dimer data set were generally similar between VTE cases and controls and between treatment arms (table 1), with several notable exceptions. Patients with VTE had a higher mean body mass index (BMI) and were more likely to have a history of hypertension and previous VTE than controls. In the tofacitinib 10 mg two times per day arm, the proportion of patients using aspirin at baseline was numerically higher in VTE cases than controls. Among VTE cases, the tofacitinib 10 mg two times per day arm included a higher proportion of past smokers than the tofacitinib 5 mg two times per day and TNFi arms. Characteristics were also similar between the exploratory biomarker data set (online supplemental table 4) and the full clinical data set.10
Biomarker analyses
A summary of key results is provided in table 2. Notable findings are discussed in further detail in the sections below. Key statistical comparisons are provided in online supplemental table 5 (tier 1 and 2 biomarkers) and online supplemental table 6 (D-dimer), and full results of statistical testing are available in online supplemental files 2 and 3.
Summary of results from biomarker analyses
Genotyping
Carriers of the factor V Leiden (FVL/F5; rs6025) or prothrombin (F2; G20210A; rs1799963) mutations, individually or combined, had an increased incidence of VTE compared with non-carriers; however, the risk did not vary significantly across treatment arms (online supplemental figure 1A). Removing carriers of these risk variants had a negligible impact on the hazard ratios (HRs) for VTE or PE with tofacitinib 10 mg two times per day versus TNFi (online supplemental figure 1B). There were no patients in the exploratory biomarker data set with the JAK2 V617F mutation (rs12343867).
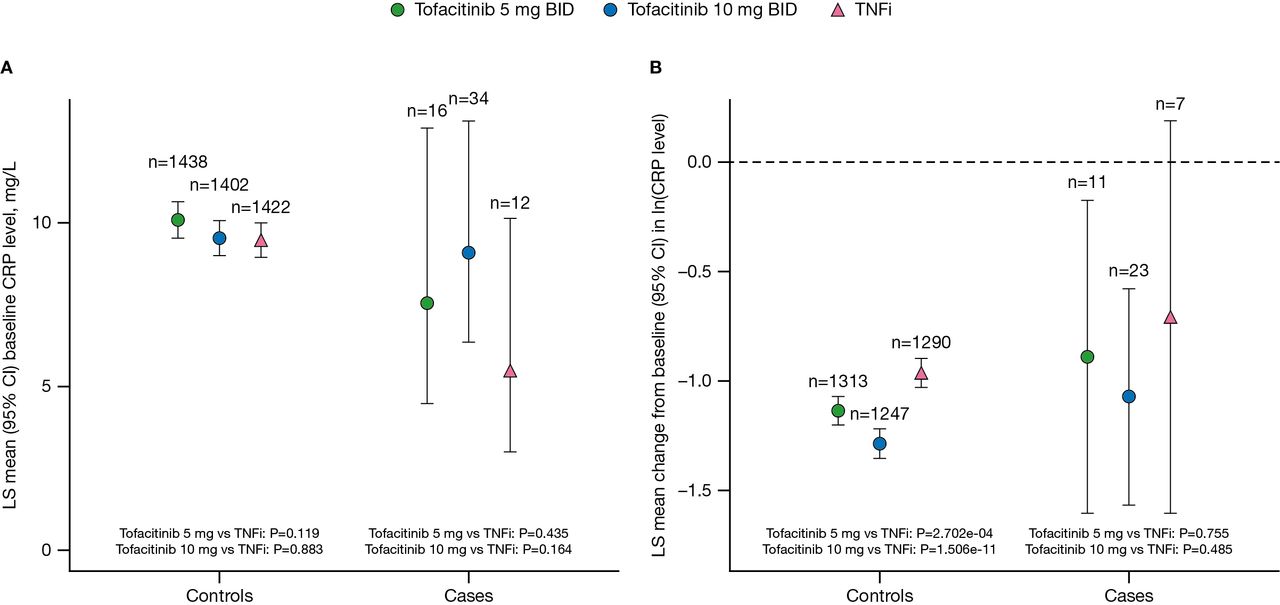
C reactive protein
Mean baseline CRP levels were elevated in both controls and VTE cases (figure 1A), with no significant differences between the tofacitinib and TNFi treatment arms (all p>0.05). At month 12, CRP levels were reduced relative to baseline across all treatment arms in both controls and VTE cases (figure 1A,B). Among controls, the decrease from baseline in CRP levels was greater in the tofacitinib treatment arms than in the TNFi treatment arm and was dose dependent (p=2.702e–04 for tofacitinib 5 mg vs TNFi; p=1.506e–11 for tofacitinib 10 mg vs TNFi; figure 1B). However, at baseline and month 12, there was no association between CRP levels and VTE or PE within any treatment arm (all p>0.05).

(A) CRP levels at baseline and (B) changes from baseline in CRP levels at month 12 by treatment arm in controls and VTE cases (full clinical data set). Normal assay range: <3 mg/L. For patients assigned to receive tofacitinib at a dose of 10 mg two times per day who had their dose reduced to 5 mg two times per day, the data collected after patients had been switched to 5 mg two times per day were counted in the arm receiving 10 mg two times per day, two times per day; CI, confidence interval; CRP, C-reactive protein; ln, natural logarithm; LS, least squares; TNFi, tumour necrosis factor inhibitor; VTE, venous thromboembolism.
D-dimer
Because clear associations were observed between D-dimer and VTE in the exploratory biomarker data set (not shown), the relationship between D-dimer levels and all VTE confirmed by adjudication was explored using the largest available set of controls (all patients without VTE until the last follow-up, subject to limitations in sample availability). In the D-dimer data set at baseline, mean D-dimer levels were >2× ULN in all treatment arms for both controls and VTE cases (figure 2). There was no evidence of a significant relationship between baseline D-dimer levels and VTE in any of the treatment arms (all p>0.05).
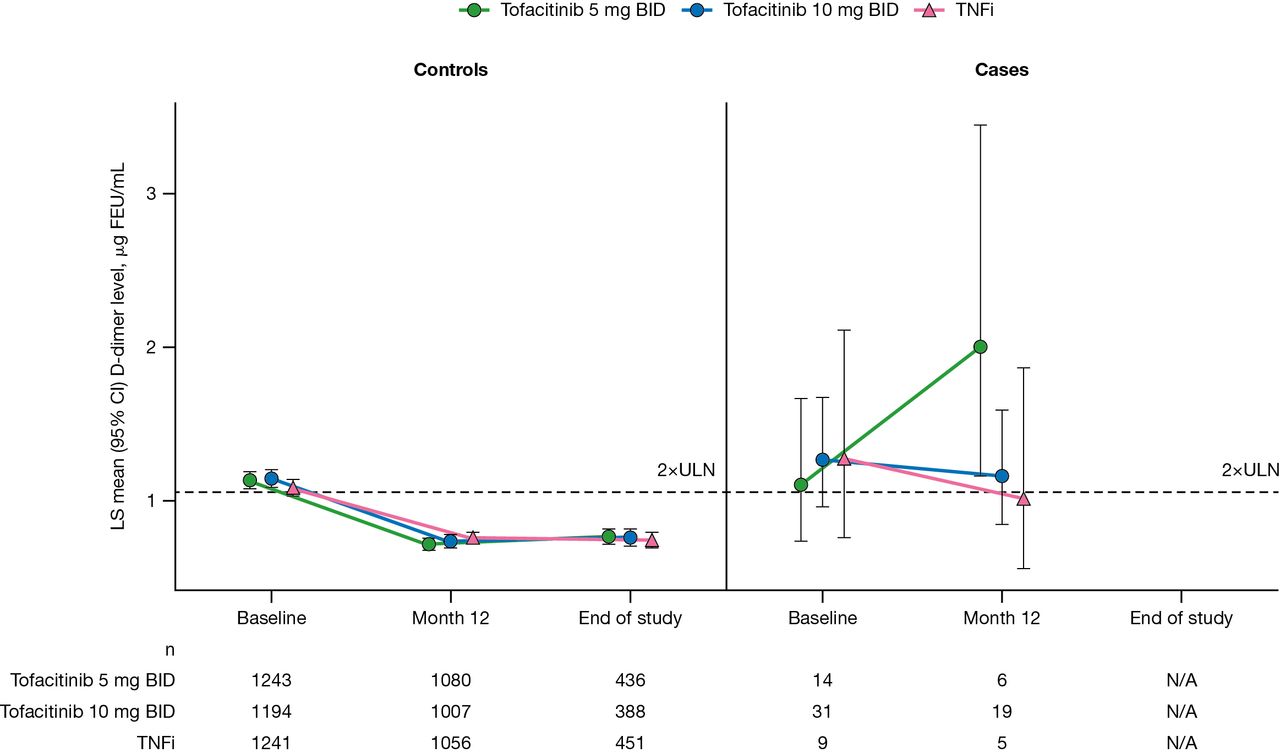
D-dimer levels at baseline, month 12 and end of study by treatment arm in controls and VTE cases (D-dimer data set). Normal assay range: <0.53 µg FEU/mL. For patients assigned to receive tofacitinib at a dose of 10 mg two times per day who had their dose reduced to 5 mg two times per day, the data collected after patients had been switched to 5 mg two times per day were counted in the arm receiving 10 mg two times per day. P values for treatment comparisons at each time point are shown in online supplemental table 6. BID, two times per day; CI, confidence interval; FEU, fibrinogen equivalent units; LS, least squares; TNFi, tumour necrosis factor inhibitor; ULN, upper limit of normal; VTE, venous thromboembolism.
At month 12, mean D-dimer levels decreased from baseline in controls from all treatment arms. Higher month 12 D-dimer levels were significantly associated with subsequent VTE in both tofacitinib treatment arms (HR 4.676 (p=1.61e–04) and HR 1.922 (p=1.54e–03) for tofacitinib 5 mg two times per day and 10 mg two times per day, respectively), as were the changes from baseline at month 12 (HR 5.774 (p=1.34e–04) and HR 1.966 (p=3.11e–03) for tofacitinib 5 mg two times per day and 10 mg two times per day, respectively). The associations between D-dimer levels and VTE at month 12 and for the change from baseline at month 12 were more pronounced in the tofacitinib 5 mg two times per day than in the tofacitinib 10 mg two times per day treatment arm. This likely reflects skewing of the mean from a single high estimate of D-dimer concentration in one patient with an event in the tofacitinib 5 mg two times per day arm (out of six total), who was diagnosed with DVT and PE on day 368, shortly after the month 12 D-dimer sample was collected. However, the overall interaction test between D-dimer levels and treatment arms on subsequent VTE was not significant for month 12 D-dimer or change from baseline at month 12 (p>0.05).
Associations between dichotomised D-dimer levels (<2× ULN or ≥2× ULN) and VTE were also examined in an exploratory analysis. At baseline, approximately half of the controls across all treatment arms demonstrated D-dimer levels ≥2× ULN (48%–50%), compared with approximately two-thirds of VTE cases (64%–68%; table 3). The proportion of control patients across all treatment arms with a month 12 D-dimer level ≥2× ULN was similar (26%–30%) and lower than at baseline. However, the proportion of VTE cases with a D-dimer level ≥2× ULN at month 12 was higher in the tofacitinib 5 mg two times per day and 10 mg two times per day treatment arms (100% and 58%, respectively) than in the TNFi treatment arm (40%; table 3).
Levels of D-dimer in controls and VTE cases using a cut-off of 2×ULN at baseline and month 12 (D-dimer data set)
Despite the small number of PE events, analyses of the associations between PE events and D-dimer levels at baseline and month 12 produced similar outcomes to the analyses with all VTE events (online supplemental figure 2; online supplemental table 7).
Analyses were also performed to explore the potential incremental value of D-dimer monitoring in patients treated with tofacitinib and with known VTE risk factors (age ≥65 years, BMI ≥30 kg/m2, smoking history and hypertension). Results are described in online supplemental file 1. Formal statistical test results of incident risk by dichotomised D-dimer treatment arm and/or VTE risk factors from both baseline and month 12 are provided in online supplemental file 3.
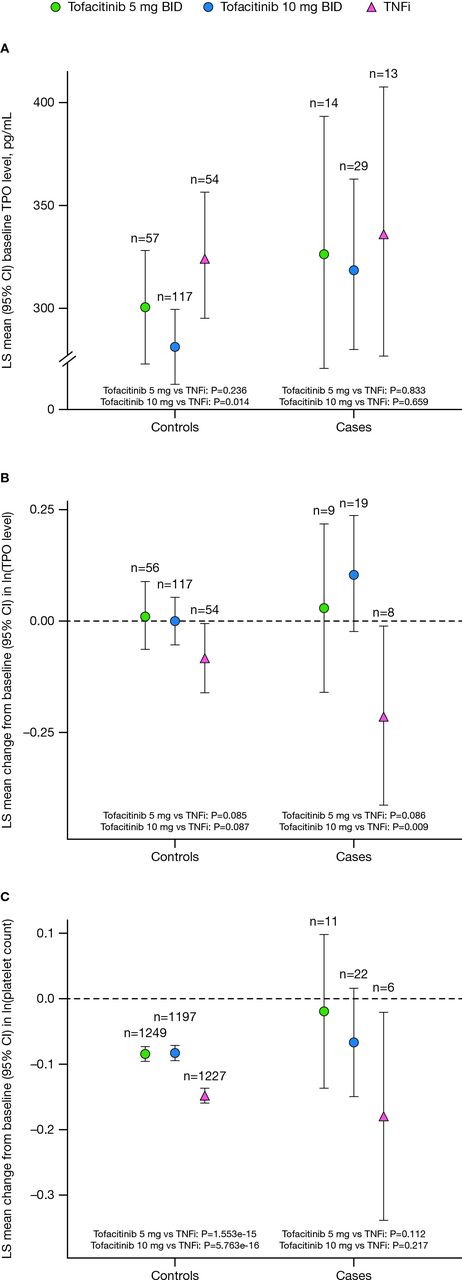
TPO and platelets
In the matched controls, baseline TPO levels in the tofacitinib 10 mg two times per day treatment arm were lower than those in the TNFi treatment arm (p=0.014; figure 3A). A similar trend was observed within the VTE cases, although this was not significant (p>0.05). In line with the higher baseline levels, a reduction in TPO levels at month 12 was observed for both controls and VTE cases treated with TNFi, which was not seen with tofacitinib treatment (figure 3B). Furthermore, the treatment difference in TPO levels for tofacitinib 10 mg two times per day versus TNFi was statistically significant in VTE cases (p=0.009). Month 12 levels were also associated with incident VTE events in the tofacitinib 10 mg two times per day arm (HR 1.752, p=0.008). Both baseline and month 12 TPO levels were associated with incident PE events in the tofacitinib 10 mg two times per day arm (HR 2.584 (p=0.002) and HR 1.649 (p=0.014), respectively). However, the interaction tests between TPO levels and treatment arms for VTE and PE were not significant.
(A) TPO levels at baseline and changes from baseline in TPO levels at month 12; (B) exploratory biomarker data set; (C) changes from baseline in platelet counts at month 12 (full clinical data set) in controls and VTE cases. For patients assigned to receive tofacitinib at a dose of 10 mg two times per day who had their dose reduced to 5 mg two times per day, the data collected after patients had been switched to 5 mg two times per day were counted in the arm receiving 10 mg two times per day. BID, twice daily; CI, confidence interval; ln, natural logarithm; LS, least squares; TNFi, tumour necrosis factor inhibitor; TPO, thrombopoietin; VTE, venous thromboembolism.
To better understand the changes in TPO levels, platelet counts were also assessed in the full clinical data set at the cohort and individual levels at every visit. No meaningful deviations in platelet levels were observed around the time of the VTE event in cases (data not shown). All treatment arms demonstrated a mean reduction in platelet counts at month 12, with modest but significantly larger reductions observed in the TNFi arm than in the tofacitinib arms in controls (figure 3C).
Other biomarkers
Additional soluble analytes implicated in thrombogenesis (factor VIII, TAT, TFPI, PAI-1, protein C, AT, apoCIII and leptin) were assessed for differences between VTE cases and matched controls by treatment arm at baseline or change from baseline at month 12. These analyses revealed a small number of statistically significant effects (online supplemental table 5). However, none of these findings was consistent with a mechanistic relationship between tofacitinib 10 mg two times per day treatment and increased incidence of VTE events, nor did any of these findings identify any biomarkers that could be used to predict the risk of VTE events in patients prescribed tofacitinib.
Assessment of antiphospholipid antibodies (ACA IgG, ACA IgM anti-β2GP1 IgG and anti-β2GP1 IgM) was performed at baseline and month 12. Clinical interpretation of these results (ie, positive vs negative) was based on clinical laboratory-defined cut-offs. Positive results for antiphospholipid antibodies were observed in very few patients. For IgG antibodies, two positive antibodies were observed at baseline in VTE cases (one each for ACA and anti-β2GP1) compared with four patients each for ACA and anti-β2GP1 in matched controls. There were no meaningful changes in this small number of positive antibodies at month 12. There were no statistical differences between treatment arms at baseline or change from baseline at month 12, nor were there any statistically significant associations with incident events in any arm at either timepoint (data not shown).
Analysis of a broad panel of exploratory proteomic biomarkers revealed two proteins that met any of the predefined criteria for identifying biomarkers of potential interest (all results are shown in online supplemental file 2). A statistically significant association of angiogenin (ANG) levels with incident PE events was observed in the tofacitinib 10 mg two times per day treatment arm at baseline (HR 2.427, p=1.661e–04). Patients in the tofacitinib 10 mg two times per day arm also experienced significant decreases in tumour necrosis factor ligand superfamily member 13B (TNFSF13B) levels at month 12 relative to the TNFi treatment arm in VTE controls (p=0.001). Lower levels of TNFSF13B at month 12 were associated with incident PE events within the tofacitinib 10 mg two times per day arm (HR 0.378; p=0.016).
Discussion
This comprehensive analysis of biomarkers was performed to identify a potential mechanistic relationship for the observed differences in VTE (which primarily manifested as PE) between the tofacitinib and TNFi treatment arms in the ORAL Surveillance study. Despite the wide range of biomarkers assessed in these analyses (a total of 294), none was identified as having a clear mechanistic association with the increased risk of VTE with tofacitinib relative to TNFi.
D-dimer and TPO, as well as ANG, an exploratory analyte with no known association with VTE, demonstrated associations between baseline and/or month 12 levels and VTE or PE. There was also an association between change from baseline in D-dimer levels at month 12 and VTE and PE events. However, the treatment specificity of these effects could not be established, either due to the interaction tests between biomarker levels and treatment arms not reaching statistical significance or the absence of PE events in the TNFi treatment arm at month 12.
D-dimer is a commonly used biomarker for the management of VTE that may have applicability for VTE diagnosis, determination of optimum duration of anticoagulation therapy and identification of patients at high risk for VTE.19 High D-dimer levels have also been associated with disease severity and mortality in patients with COVID-19.20 21 Despite high sensitivity, D-dimer levels have low specificity for VTE because levels increase with age, and high levels are reported in patients with inflammatory conditions such as RA.9 19 Furthermore, D-dimer levels fluctuate; in patients with RA, they correlate with markers of disease activity including Disease Activity Score in 28 joints (DAS28), erythrocyte sedimentation rate and CRP.9 D-dimer is most often used to exclude VTE based on the high sensitivity and resulting negative predictive value. Thus, the baseline elevations in D-dimer levels that were observed in both VTE cases (~67%) and matched controls (~50%) reflect ongoing systemic inflammation and RA disease activity, and the poor specificity of D-dimer, in this population. Universal D-dimer testing in the context of risk mitigation for VTE for all patients receiving tofacitinib is likely to result in limited benefit and potential risk of harm through therapy interruption or avoidable additional testing (including radiographical procedures). Therefore, the decision to monitor D-dimer levels should be made by clinicians on an individual patient basis, with full consideration of the merits of D-dimer assessment in the context of patient presentation, disease activity and tofacitinib exposure.
Although none of the tier 1 biomarkers (D-dimer, CRP or TPO) demonstrated a treatment effect on changes in biomarker levels in a commensurate direction matching an additional prospective association with VTE events in the tofacitinib 10 mg two times per day treatment arm, one tier 4 biomarker, TNFSF13B, met these criteria for PE. TNFSF13B, also known as B-cell activating factor of the TNF family (BAFF) or B-lymphocyte stimulator (BLyS), is a B-cell growth factor that is elevated in inflammatory conditions, such as RA,22 and has no known association with VTE. Although not measured in ORAL Surveillance, B-cell increases have been documented following treatment with tofacitinib.23 The observed reduction in TNFSF13B levels, notably seen in both VTE cases and matched control patients receiving tofacitinib, may be secondary to these increases in B cells and potentially indicates a homeostatic response or inhibition of TNFSF13B expression, resulting from JAK inhibition with tofacitinib.24 25
In addition to the predefined hierarchy of biomarkers of interest, we also measured levels of antiphospholipid antibodies at baseline and month 12. Antiphospholipid antibodies can lead to an acquired thrombophilia that is associated with venous and arterial thrombosis and complications of pregnancy.14 15 In this study, there were no statistical differences in antibody levels between the tofacitinib and TNFi treatment arms, nor were there any statistically significant associations with incident VTE events in any arm at baseline or for change from baseline at month 12, indicating that these antibodies did not contribute to the increase in VTE events observed with tofacitinib 10 mg two times per day compared with TNFi. There was an increased incidence of VTE events for carriers of two known thrombophilic mutations (factor V Leiden or prothrombin (G20210A)), providing internal validation of the data set. However, this risk did not vary significantly by treatment arm and did not provide any mechanistic insight into the findings as removal of all risk allele carriers did not noticeably attenuate the association between tofacitinib and VTE or PE.
Tofacitinib is an orally bioavailable small molecule that inhibits JAKs by blocking the ATP binding site.26 In cellular settings where JAKs signal in pairs, tofacitinib preferentially inhibits signalling by heterodimeric receptors associated with JAK1 and/or JAK3 and has functional selectivity over JAK2.26 JAK2 is a physiological regulator of TPO and platelet homeostasis, and preclinical studies suggest a mechanism whereby partial JAK2 inhibition can lead to increases in platelet levels.27 Although some individual studies have shown a potential increase in VTE risk with JAK inhibitors, meta-analyses conducted to date have produced conflicting results, possibly due to the small number of events and limited exposure time.28 In this analysis, a significant association between baseline TPO levels and PE events was observed in the tofacitinib 10 mg two times per day treatment arm. However, the clinical meaningfulness of the results observed with TPO levels (used most commonly in the context of thrombocytopenia) and D-dimer in this analysis must be interpreted with caution. Reductions in platelet counts were observed at month 12 across all treatment arms and in both controls and VTE cases. This effect was most notable in the TNFi arm where TPO levels also decreased. These TPO findings may reflect an overall anti-inflammatory effect of TNFi, rather than changes related to the platelet–TPO axis.29
Several limitations of these analyses should be noted. These analyses were exploratory and post hoc, with the limited sampling time points of baseline and month 12 for patients with VTE events. ORAL Surveillance was neither powered nor designed to compare risk of VTE across treatments or to identify relevant biomarker changes with a mechanistic relationship to VTE. Accordingly, the time lapse between blood sampling and VTE events occurring varied across patients, leading to heterogeneous results. Storage length also exceeded the assessed stability range for several of the regulated assays used, including the ACA, anti-β2GP1 and D-dimer assays (and it was not possible to assess the potential impact of length of storage of samples on analyte stability). Furthermore, these analyses were restricted to a study subgroup that may not be generalisable to the totality of VTE cases. Of note, the limited number of samples available for bioanalysis was reduced further because of the exclusion criteria regarding use of anticoagulants. Finally, the small number of VTE events in the TNFi treatment arm also made it difficult to interpret any apparent associations with events between the tofacitinib and TNFi treatment arms, as well as imbalances across treatment arms in baseline characteristics. Because of these limitations, the results should be interpreted with caution.
Conclusions
This analysis of 291 protein biomarkers and three genetic markers did not identify a clear mechanistic explanation for higher rates of VTE with tofacitinib, particularly at the 10 mg two times per day dose, compared with TNFi in the ORAL Surveillance study. Although D-dimer levels were associated with subsequent VTE risk in this RA population, further understanding of the relationship between D-dimer levels and VTE in the context of systemic autoimmune diseases is needed before firm conclusions can be reached about the appropriate clinical use of this non-specific test; a properly designed prospective study may not be possible given the low event rate of VTE. Overall, the available evidence from this study does not conclusively establish a connection between treatment with tofacitinib in patients with RA and any of the analytes tested. Individual VTE risk should be considered as part of tofacitinib treatment initiation and maintenance. Future clinical and real-world data may help to further clarify the relationship between JAK inhibitor treatment and VTE events.
Supplemental material
Data availability statement
Data are available upon reasonable request. Upon request, and subject to review, Pfizer will provide the data that support the findings of this study. Subject to certain criteria, conditions and exceptions, Pfizer may also provide access to the related individual de-identified participant data. See https://www.pfizer.com/science/clinical-trials/trial-data-and-results for more information.
Ethics statements
Patient consent for publication
Ethics approval
This manuscript reports a post-hoc analysis of the clinical trial, ORAL Surveillance (NCT02092467), for which the primary findings have already been published in the New England Journal of Medicine (Ytterberg et al N Engl J Med 2022;386:316-26). The protocol, amendments and consent documentation were approved by the institutional review board or independent ethics committee at each centre, but no further ethical approval was required for this post hoc analysis in accordance with the policies of our institutions. Participants gave informed consent to participate in the study before taking part.
References
Supplementary materials
Supplementary Data
This web only file has been produced by the BMJ Publishing Group from an electronic file supplied by the author(s) and has not been edited for content.
Footnotes
Contributors All authors were involved in drafting the article or revising it critically for important intellectual content, and all authors approved the final version to be published. All authors had full access to all of the data in the study and take responsibility for the integrity of the data and the accuracy of the data analysis. The study was conceived and designed by JIW, CH and DAM. Data were acquired by SAP and DAM. Data were analysed and interpreted by JIW, ZS, CC-S, IV, BS, SAP, ZW, CH and DAM. JIW is the guarantor for this work.
Funding This study was sponsored by Pfizer Inc (grant number: not applicable). Pfizer Inc was involved in the study design, data collection and data analysis. Medical writing support, under the direction of the authors, was provided by Julia King, PhD, CMC Connect, a division of IPG Health Medical Communications, and was funded by Pfizer Inc, New York, NY, USA, in accordance with Good Publication Practice (GPP 2022) guidelines (Ann Intern Med 2022;175:1298-1304).
Competing interests JIW received honoraria from Anthos, Bayer AG, Boehringer Ingelheim, Bristol-Myers Squibb, Daiichi Sankyo, Ionis, Janssen, Novartis, Pfizer, PhaseBio, Portola and Servier Pharmaceuticals, and institutional grants from Bayer AG and Boehringer Ingelheim. ZS has received consulting fees and honoraria from AbbVie, Amgen, BMS, Gedeon Richter, Lilly, MSD, Pfizer, Roche, Sanofi and UCB. CC-S has received consulting fees, research grants and/or honoraria from AbbVie, Amgen, BMS, Gilead, Octapharma, Pfizer and Sanofi/Regeneron. IV, BS, SAP, ZW, CH and DAM are employees and/or shareholders of Pfizer Inc.
Provenance and peer review Not commissioned; externally peer reviewed.
Supplemental material This content has been supplied by the author(s). It has not been vetted by BMJ Publishing Group Limited (BMJ) and may not have been peer-reviewed. Any opinions or recommendations discussed are solely those of the author(s) and are not endorsed by BMJ. BMJ disclaims all liability and responsibility arising from any reliance placed on the content. Where the content includes any translated material, BMJ does not warrant the accuracy and reliability of the translations (including but not limited to local regulations, clinical guidelines, terminology, drug names and drug dosages), and is not responsible for any error and/or omissions arising from translation and adaptation or otherwise.