Article Text

Abstract
Objectives The pathological diagnostic criteria for primary Sjögren’s syndrome (SjS) have certain limitations. We first explored the key pathogenic pathways of SjS through a bioinformatics approach, and then evaluated the diagnostic value of the important biomarker in SjS.
Methods Transcriptome data from non-SjS controls and patients with SjS were analysed using integrated bioinformatics methods. In a case–control study, phosphorylated signal transducer and activator of transcription proteins 1 (p-STAT1), a key biomarker for the activation of interferon (IFN) pathway, was selected to evaluate its diagnostic value by immunohistochemical analyses in salivary gland (SG) tissues.
Results The IFN-related pathways were aberrantly activated in patients with SjS. Positive staining of p-STAT1 was detected in the SjS group, but not in non-SjS control group. There was a significant difference in the integrated optical density values of p-STAT1 expressions between the controls and the SjS groups, as well as between the controls and the SjS lymphatic foci-negative groups (p<0.05). The area under the curve of the receiver operating characteristic curve for p-STAT1 was 0.990 (95% CI 0.969 to 1.000). There was a significant difference in both accuracy and sensitivity of p-STAT1 compared with the Focus Score (p<0.05). The Jorden index for p-STAT1 was 0.968 (95% CI 0.586 to 0.999).
Conclusions The IFN pathway is the key pathogenic pathway in SjS. p-STAT1 may serve as an important biomarker, in addition to lymphocytic infiltration, to diagnose SjS. Particularly in SG samples with negative lymphatic foci, p-STAT1 confers pathological diagnostic value.
- Sjogren's Syndrome
- Autoimmune Diseases
- Immune System Diseases
Data availability statement
Data are available on reasonable request.
This is an open access article distributed in accordance with the Creative Commons Attribution Non Commercial (CC BY-NC 4.0) license, which permits others to distribute, remix, adapt, build upon this work non-commercially, and license their derivative works on different terms, provided the original work is properly cited, appropriate credit is given, any changes made indicated, and the use is non-commercial. See: http://creativecommons.org/licenses/by-nc/4.0/.
Statistics from Altmetric.com
WHAT IS ALREADY KNOWN ON THIS TOPIC
The Focus Score pathology system of Sjögren’s syndrome (SjS), according to the presence or absence of lymphatic foci, cannot effectively identify all salivary gland (SG) samples of patients with SjS.
Can bioinformatics studies, along with clinical studies, analyse the key pathogenic pathways in SjS, and uncover potential diagnostic indicators?
WHAT THIS STUDY ADDS
The IFN pathway plays a key role in the pathogenesis of SjS. p-STAT1, a key component of the IFN activation pathway, may serve as an important biomarker, along with lymphocytic infiltration, to diagnose SjS. Particularly in SG samples with negative lymphatic foci, p-STAT1 confers a pathological diagnostic value.
HOW THIS STUDY MIGHT AFFECT RESEARCH, PRACTICE OR POLICY
p-STAT1 is expected to overcome the disadvantage of the low sensitivity of FS system, and therefore, will identify SG samples of SjS patients with negative lymphatic foci, thus improving the consistency between clinical and pathological diagnosis.
Introduction
Primary Sjögren’s syndrome (SjS) is a chronic inflammatory autoimmune disease characterised by progressive exocrine gland damage and lymphocyte proliferation. The 2016 American College of Rheumatology/EULAR (2016 ACR/EULAR) classification criteria for SjS are used in clinical and epidemiological studies, and referred to clinical diagnosis.1 According to these criteria, a diagnosis of SjS is defined as a score of ≥4, in which a salivary gland (SG) lymphocyte Focus Score (FS) of ≥1 accounts for 3 points.2 Therefore, the labial gland biopsy accounts for a greater weight, which is important for the classification and diagnosis of SjS.3
However, the current FS pathology system has certain limitations.3 4 First, the sensitivity of these pathological criteria is insufficient. In the early research by Pennec et al, the sensitivity of labial SGs (LSGs) biopsies ranged from 38% to 86%5 and in a recent review, the sensitivity ranged from 63.5% to 93.7%.3 Further, FS should be applied in the setting of focal lymphocytic sialadenitis (FLS) and should exclude chronic nonspecific sialadenitis as well as chronic sclerosing sialadenitis. This concept is not generally accepted.6 In particular, it is not possible for the current SjS pathological criteria to play a diagnostic role for patients with SjS with negative lymphatic foci. It is the main reason for the inconsistency between clinical and pathological diagnosis.7 Although labial gland biopsy plays an important role in SjS classification criteria, new pathological diagnostic markers will be required.
Here, we first compared the transcriptomic data from patients with SjS and non-SjS controls by employing bioinformatics analyses to reveal the transcriptome characteristics of patients with SjS, and to analyse the key pathogenic pathways, such as the interferon (IFN) pathway.
IFNs have been implicated in the pathogenesis of SjS8 and aberrant activation of IFN pathway occurs in SjS patients.9 For example, the increased expression of STAT1 is associated with anti-SSA/Ro antibody and the EULAR primary Sjögren’s Syndrome Disease Activity Index (ESSDAI) among patients with SjS.10
During the activation of IFN pathway, signal transducer and activator of transcription proteins 1 (STAT1) and STAT2 are phosphorylated, and further induces the expressions of IFN-stimulated genes.11 Phosphorylation of STAT1 (p-STAT1) is a key step in the activation of the IFN pathway.12 Therefore, p-STAT1, a key biomarker for IFN pathway,13 was selected to evaluate the ability to differentiate SG samples from non-SjS controls and patients with SjS, and to reveal its diagnostic value through immunohistochemical (IHC) analyses.
Methods
Transcriptome datasets
Transcriptome profiling data of peripheral blood, SG tissues and salivary epithelial cells from patients with SjS and controls from Gene Expression Omnibus (GEO) were employed. We systematically searched GEO for human microarray or RNA-sequencing (RNA-seq) transcriptome datasets, following certain selection criteria (online supplemental material: Transcriptome datasets selection criteria, online supplemental tables 1 and 2).
Supplemental material
Supplemental material
Supplemental material
Differential expression analyses
In the analyses of microarray transcriptome datasets, the series matrix with probes was annotated into a gene expression matrix with the annotation document of the microarray platform. Differential gene expression analyses of microarray datasets were performed using the limma package.14 In the analyses of RNA-seq transcriptome datasets, gene expression analyses with raw counts were first used if available, and differential expression analyses were performed using DESeq2.15 For RNA-seq transcriptome datasets employing other data forms such as Fragments Per Kilobase Million or Transcripts Per Million, differential expression analyses were performed using the limma package.14 In the differential gene expression analyses above, outcome lists of differentially expressed genes (DEGs) were obtained for subsequent analyses.
Robust rank aggregation analysis
Robust rank aggregation analysis (RRA) analysis is used to unbiasedly integrate outcomes from multiple transcriptome datasets.16 Outcomes of the differential expression analyses of these microarrays or RNA-seq transcriptome datasets were obviously inconsistent. To identify the top deregulated genes and generate a robust DEGs list, we used the RRA method to integrate the outcomes of multiple transcriptome datasets of peripheral blood and glandular tissues, respectively. The upregulated and downregulated DEGs lists, ranked by fold changes from each dataset, were used in the RRA analysis. Genes with a pooled log2FC>0.5 and an adjusted p<0.05 were considered as significant robust DEGs in the RRA analysis and it was performed using the RobustRankAggreg R package.
Gene set enrichment analysis
Gene set enrichment analysis (GSEA) is used to interpret valuable information from transcriptome profiling, and to evaluate whether a priori defined gene set is differentially expressed between cases and controls, and thus is significantly enriched in cases.17 The differential expression of a gene set for one functional pathway shows the possible association of this pathway with the pathogenesis of diseases.
The Normalised Enrichment Score (NES), nominal p value and false discovery rate (FDR) q value were calculated for each gene set. The NES assesses the enrichment extent of one gene set in a specific phenotype, and a value of ≥1 indicates abnormal upregulation of one gene set in specific phenotype, while a value of ≤ −1 suggests abnormal downregulation of one gene set in one specific phenotype. Pathways with NES scores of >1 and FDR q values of <0.25 were considered as statistically significant enriched pathways in peripheral blood. Owing to the large number of candidate pathways, pathways with NES of >1 and FDR q value of <0.05 were considered as significantly enriched pathways in glandular tissues.
GSEA analyses were performed using the GSEA software (V.3.0, The GSEA/MSigDB Team, Broad Institute, USA). The GSEA analysis of glandular epithelial cells was described in online supplemental material: GSEA analysis of glandular epithelial cells. Hallmark gene sets and Gene Ontology (GO) gene sets from The Molecular Signatures Database (MSigDB) were used in the GSEA analysis. Genes included in those pathways could be identified through the MSigDB (https://www.gsea-msigdb.org/gsea/msigdb/human/genesets.jsp).
Supplemental material
Weighted gene coexpression network analysis
Weighted gene coexpression network analysis (WGCNA) is used to uncover key coexpressed gene modules related to specific phenotypes.18 WGCNA was further employed to identify key genes and relevant pathways involved in SjS.
In the transcriptomic analysis of peripheral blood, the expression matrix of 1657 DEGs from RRA analysis in GSE66795 was analysed through the WGCNA method. In the transcriptomic analysis of SG tissues, the expression matrix of 4611 DEGs from RRA analysis in GSE40611 was analysed through the WGCNA method as well. Coexpression gene modules that significantly correlated with SjS were judged as key coexpression modules involved in SjS pathogenesis. Genes with both high correlations with other intramodule genes and high correlations with SjS were regarded as candidate hub genes.
The above analyses were performed using the WGCNA package.18 The functional annotation of coexpression modules was performed using the Database for Annotation, Visualisation and Integrated Discovery database, and Gene ontology (GO) terms were analysed.
Gene set variation analysis
Gene set variation analysis (GSVA) interprets valuable information from transcriptome profiling, particularly at the single sample level.19 The enrichment scores of gene sets employing GSVA may reflect the extent of the activation of functional pathways in each sample, and the role of one functional pathway in diseases may be evaluated according to the difference in the enrichment scores between cases and controls. Here, GSVA was used to validate the main findings from GSEA analyses. Further, the enrichment of SjS-related transcriptomic features in peripheral blood and glandular tissues was evaluated through GSVA, and an enrichment score for each sample was calculated. GSVA analyses were performed by the R package.
Validation of the differential expressions of key genes in SjS SG tissues
An RNA-seq transcriptomic dataset containing large number of SG samples (GSE173808: 75 SG samples from SjS patients and 39 SG samples from controls) was used to validate the differential expressions of key genes in SjS SG tissues. The raw read counts of those candidate genes were extracted as expression values from the expression matrix, and the difference in the expression values between SjS and controls was compared.
scRNA-seq transcriptomic analysis
Seurat V.3.1 was used to analyse the count matrix of GSE132867.20 When creating the Seurat object, we used a minimal cell number of 3, and a minimal feature number of 300. To cluster the cells through Seurat, the top 18 principal components were used, and the non-linear dimensional reduction technique (tSNE) was used in the clustering analysis. The cell annotation was performed using the combination of SingleR and the well-defined markers of glandular epithelial cells.21 Cluster biomarkers for glandular epithelial cells were identified through differential expression analyses between glandular epithelial cells and other cells including immune cells. Those genes unregulated in glandular epithelial cells but expressed at low levels in immune cells were identified as those genes expressed mainly in SG epithelial cells. The tissue-specific expression of candidate genes was further validated through the Human Protein Atlas project (www.proteinatlas.org/).
Case–control study design and participants
The study was designed as a single-centre, case–control study to investigate the differences of the p-STAT1 IHC staining in SG samples between SjS patients and non-SjS controls. The study was designed and written following the Reporting of Observational studies in Epidemiology (STROBE) guidelines.22
Inclusion criteria
The inclusion criteria were as follows: The SjS group included participants who underwent SG biopsy at the First Affiliated Hospital of Xiamen University from 2020 to 2022 and fulfilled the 2016 ACR/EULAR classification criteria for SjS.1 The non-SjS control group included participants who underwent the biopsy but did not fulfil these classification criteria.
Exclusion criteria
The exclusion criteria were as follows: Concurrent autoimmune diseases; concomitant haematological diseases; history of bone marrow transplantation and graft-versus-host disease; concurrent malignancies23; history of head, neck, jaw and facial radiotherapy; concurrent AIDS, hepatitis B virus, and hepatitis C virus infections; concurrent vital organ failure, serious infections, or other serious complications; recent use of antiethylphthalmic cholinergics; pregnant or of childbearing potential and not using effective contraception; psychiatric disorders; poor compliance during the treatment; or incomplete information. A portion of patients with SjS may have potential development of lymphoma, thus, we excluded patients with malignancy in this study.23 24
Collection of clinical data
The investigators completed questionnaires to create a follow-up database. The ID number, name, sex, age and the form and duration of clinical symptoms were documented. Whole saliva flow rates in the unstimulated state were measured, and Schirmer’s test was performed.2 Symptoms associated with extra glandular injury were recorded, such as fever, fatigue, arthralgia.25 The involvement of each system was judged according to ESSDAI, mainly including articular, cutaneous, pulmonary, renal involvement, etc.26
Laboratory assessment
The erythrocyte sedimentation rate (mm/hour) and serum C reactive protein (g/L; immune turbidimetry method) were determined in the central laboratory. Antinuclear antibody titres and anti-double-stranded DNA antibody in serum were detected by indirect immunofluorescence assays. The detection of anti-SSA/Ro antibodies and anti-SSB/La antibodies was performed using immunoblotting. Rheumatoid factor (IU/mL), immunoglobulins (g/L) and complement levels (g/L) in serum were measured using ELISA.
Biopsy of the labial SG
The lower lip mucosa was disinfected with iodophor and anaesthetised using local infiltration. An incision approximately 2 cm long was made along the inner surface of the lower lip to reveal the labial gland tissue. A sample of labial SG was removed with a surgical blade.27
H&E staining
SG tissues were fixed in 4% paraformaldehyde. After the dehydration and the wax immersion steps, the samples were embedded in paraffin wax. Paraffin sections (4 µm thick) were cut, baked at 65°C for 2 hours, dewaxed and rehydrated, and subjected to H&E staining. After staining and dehydration, the sections were dried at room temperature, sealed with 10% neutral resin, and observed using a Leica DM4B microscope.28
FS scoring
When the SG section histology was consistent with FLS and comprising ≥1 lymphocytic focus per 4 mm2 of tissue section, it was judged to be FS-positive.29
IHC analyses of SG frozen sections
The SG tissues were embedded using OCT and frozen in liquid nitrogen. The frozen blocks were stored at −80°C. The 4 µm thick sections were fixed in acetone at 4°C and treated with 0.5% Triton. Endogenous peroxidase was removed with 0.3% hydrogen peroxide.
The SG sections were incubated with blocking solution (P0260, Beyotime) for 60 min at room temperature, incubated overnight at 4°C with Phospho-Stat1 (Ser727) Rabbit monoclonal antibody (CST 8826, 1:200) or a rabbit monoclonal IgG isotype control (ab172730). After overnight incubation, the SG sections were washed with PBS, incubated with goat anti-rabbit IgG HRP polymer (ab214880, 1:1) for 60 min at room temperature and protected from light. Colour development employed DAB.30
To determine the level of p-STAT1 expression, three photographs were taken using a 20×objective for each section. Quantitative analyses of the integrated optical density (IOD) values of the IHC images were performed using Image J software.31 The IOD value reflects the level of p-STAT1 expression.
Statistical analysis
A database was created using Excel, the sample size was calculated with PASS V.16, and R (The R Foundation for Statistical Computing, V.4.2.1) statistical software was used for analysis.
Normally distributed data were expressed as (X±S) and tested using the Student’s t test. Non-normally distributed data were expressed as M (IQR) and tested using the Mann-Whitney U. Dichotomous variables were tested using the χ2 test. The receiver operating characteristic (ROC) curve was plotted, the optimal cut-off point was determined using the ROC curve, and the area under the ROC curve (AUC) was calculated. The accuracy, specificity, and sensitivity were calculated, and the two-sample test for equality of proportions with continuity correction was used for the comparison of the above indicators.32 A p<0.05 was considered statistically significant.
Results
Identification of transcriptomic signatures for SjS
RRA analysis of transcriptomic datasets of peripheral blood identified numerous significant robust DEGs in peripheral blood including 64 upregulated genes and 8 downregulated genes in blood. The top 10 upregulated genes in blood of patients with SjS were IFI44L, RSAD2, IFI44, IFI27, EPSTI1, IFIT1, IFIT3, IFI6, XAF1 and MX1, most of which were genes of IFN response. The top five downregulated genes in blood of SjS patients were LRRN3, LDLRAP1, KIAA1324, ALDOC and CTDSPL (online supplemental table 3, figure 1A).
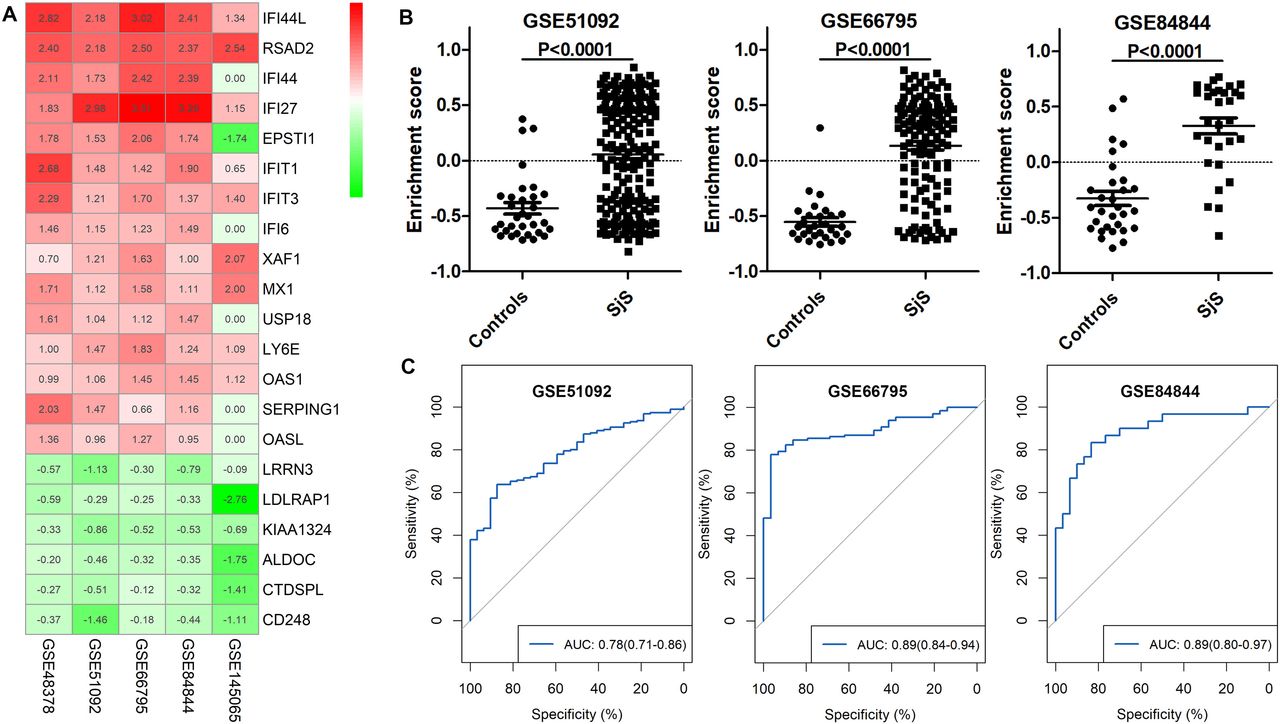
Identification of the peripheral blood transcriptomic signature for Sjögren’s syndrome (SjS). (A) Heatmap of top dysregulated genes in the blood of patients with SJS in RRA analysis. (B) Difference in the enrichment scores of the SjS blood transcriptomic signature between patients with SjS and non-SjS controls in three independent transcriptomic datasets. (C) ROC analyses show that the SjS blood transcriptomic signature effectively differentiated SjS from non-SjS controls in three independent transcriptomic datasets. ROC, receiver operating characteristic; RRA, robust rank aggregation analysis.
RRA analysis and findings from GSE145065, which comprises the RNA-seq transcriptomic data of PBMCs, identified 20 upregulated genes as candidate SjS-related genes (IFI44L, RSAD2, IFI27, IFIT1, IFIT3, XAF1, MX1, LY6E, IFIT2, HERC6, PARP9, OTOF, IFIT5, CMPK2, UBE2L6, DTX3L, LIPA, SLC15A2, TGM2 and PGM2), presenting the SjS blood transcriptomic signature. In the three validation cohorts (GSE51092, GSE66795 and GSE84844), the enrichment scores of the SjS blood transcriptomic signatures were significantly increased in patients with SjS than those of non-SjS controls (figure 1B). ROC analyses suggested that the SjS blood transcriptomic signature effectively differentiated SjS from non-SjS controls. The AUCs of GSE51092, GSE66795 and GSE84844 were 0.78 (95% CI 0.71 to 0.86), 0.89 (95% CI 0.84 to 0.94) and 0.89 (95%CI 0.80 to 0.97), respectively (figure 1C).
RRA analysis of transcriptomic datasets of salivary tissues identified numerous significant robust DEGs in salivary tissues, including 116 upregulated genes and 7 down-regulated genes in SG tissues. The top 10 upregulated genes in SG tissues of patients with SjS were as follows: CXCL9, PTPRC, CXCL10, CXCL13, IFI44L, SAMHD1, CXCL11, XAF1, IFIT3 and CCL19, most of which were immunity-related genes.
The top five downregulated genes in SG tissues of patients with SjS were as follows: SCGB3A1, SPDEF, KLK1, NME4 and MYL2 (online supplemental table 3, figure 2A).

Identification of the glandular transcriptomic signature for Sjögren’s syndrome (SjS). (A) Heatmap of top dysregulated genes in salivary tissues of patients with SJS in RRA analysis. (B) Dimensional reduction through tSNE clustered cells of salivary glandular tissues into glandular epithelial cells and immune cells. (C) Gene expression patterns of markers of glandular epithelial cells at the single-cell level. (D) Difference in the enrichment scores of SjS glandular immune signature between patients with SjS and non-SjS controls. (E.) Difference in the enrichment scores of SjS glandular injury signature between patients with SjS and non-SjS controls. (F) ROC analyses show that the SjS glandular immune signature effectively differentiated SjS from non-SjS controls in different transcriptomic datasets. ROC, receiver operating characteristic; RRA, robust rank aggregation analysis.
According to the outcomes of RRA analysis and findings from scRNA-seq transcriptomic analysis of glandular tissues, an SjS glandular immune signature comprising 20 genes (PTPRC, MS4A1, GZMK, GZMA, IL2RB, SAMSN1, CD52, KLRB1, GPR18, EVI2A, LGALS2, CD3D, P2RY10, BCL2A1, CLEC2B, PECAM1, CD2, TNFSF13B, P2RY8 and GMFG) was identified, and these genes were all upregulated in SjS salivary tissues and are mainly expressed by immune cells. An SjS glandular injury signature comprising 20 genes (SCGB3A1, SPDEF, KLK1, DEFB1, AQP5, HSD11B2, KRT14, MYH2, CALML5, KRT7, PPP1R1B, FOLR1, GJB1, PRSS8, PON3, FBP2, PROL1, CRISP1, PRB1 and LPO) was identified, and these genes were downregulated in SjS salivary tissues and are mainly expressed in glandular epithelial cells (figure 2A–C).
In the validation studies, the enrichment scores of SjS glandular immune signature were significantly increased in patients with SjS than non-SjS controls, and the enrichment scores of SjS glandular injury signature were significantly lower in patients with SjS than in non-SjS controls (figure 2D,E). The SjS glandular immune signature effectively differentiated SjS from non-SjS controls, and the AUCs were over 0.90 (figure 2F).
Key functional pathways involved in SJS pathogenesis
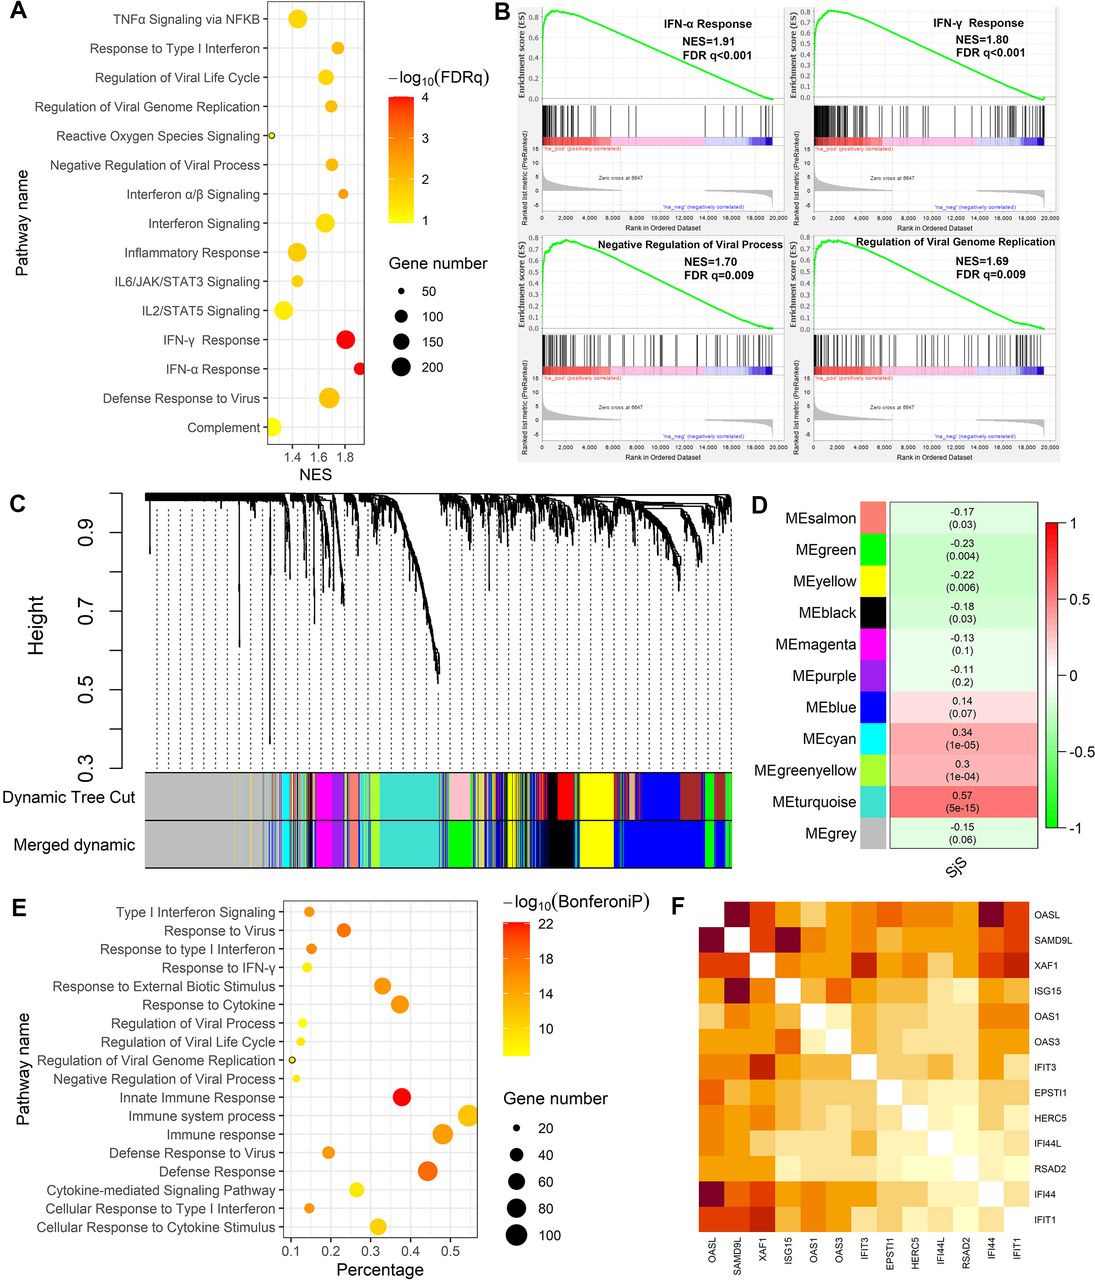
GSEA of peripheral blood suggested that numerous functional pathways were abnormally activated in patients with SjS, such as the IFN-α Response (NES=1.91, FDR q<0.001), IFN-γ response (NES=1.80, FDR q<0.001), negative regulation of viral process (NES=1.70, FDR q=0.009) and defence response to virus (NES=1.68, FDR q=0.013) (figure 3A,B). Other pathways abnormally activated in peripheral blood of patients with SjS were shown in online supplemental table 4.
Supplemental material

GSEA and WGCNA of peripheral blood transcriptomic data revealed key functional pathways involved in Sjögren’s syndrome (SjS) pathogenesis. (A) GSEA revealed certain key pathways were abnormally activated in peripheral blood of patients with SjS. (B) Enrichment plots of four key pathways abnormally activated in peripheral blood of patients with SJS. (C) Cluster dendrogram of the WGCNA of peripheral blood transcriptomic data. (D) Heatmap showed the module-trait association from WGCNA. Each cell contains the correlation estimate and corresponding p value. (E) GO functional enrichment analysis of genes contained in the turquoise model. (F) Heatmap showed the intensive intergene correlations among the top 10 hub genes in the turquoise model. The intensity of the correlations is reflected by the depth of the red colour. FDR, false discovery rate; GSEA, gene set enrichment analysis; NES, Normalised Enrichment Score; WGCNA, weighted gene coexpression network analysis.
WGCNA of DEGs in GSE66795 allowed us to construct the coexpression gene models in peripheral blood of patients with SjS, among which the turquoise model was the most significant model related to SjS (figure 3C,D). The turquoise model comprised 208 genes, and its function was mainly enriched in immunity-related pathways such as type 1 IFN singlling, innate immune response and response to virus (figure 3E). The top 10 hub genes in the turquoise model were as follows: OASL, SAMD9L, XAF1, ISG15, OAS1, OAS3, IFIT3, EPSTI1, HERC5, IFI44L, RSAD2, IFI44 and IFIT1, all of which significantly correlated with each other (figure 3F).
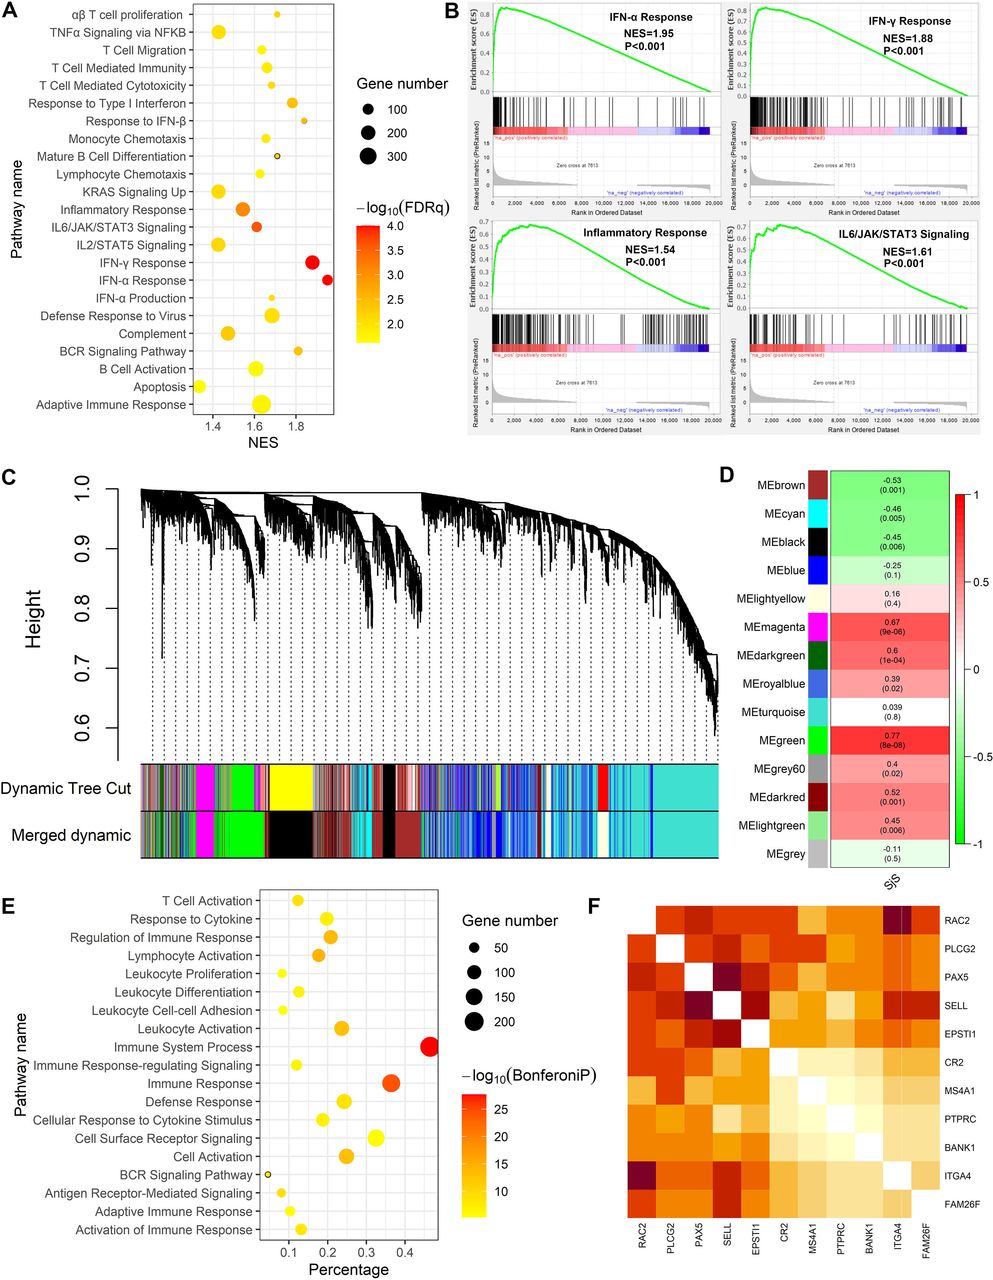
GSEA of the DEGs list from RRA analysis of salivary tissues suggested that numerous functional pathways were abnormally activated in patients with SjS, such as IFN-α response (NES=1.95, FDR q<0.001), IFN-γ response (NES=1.85, FDR q<0.001) and inflammatory response (NES=1.54, FDR q=0.0008) and complement pathway (NES=1.47, FDR q=0.005) (figure 4A,B). Other pathways abnormally activated in salivary tissues of patients with SjS are shown in online supplemental table 5.
Supplemental material

Gene set enrichment analysis (GSEA) and weighted gene coexpression network analysis (WGCNA) of transcriptomic data from salivary tissues revealed key functional pathways involved in Sjögren’s syndrome (SjS) pathogenesis. (A) GSEA analysis revealed certain key pathways abnormally activated in salivary tissues of patients with SjS. (B) Enrichment plots of four key pathways abnormally activated in salivary tissues of patients with SjS. (C) Cluster dendrogram in the WGCNA of transcriptomic data in salivary tissues of patients with SJS. (D) Heatmap showed the module-trait association from WGCNA of salivary tissues. Each cell contains the correlation estimate and corresponding p value. (E) GO functional enrichment analysis of genes contained in the green model. (F) Heatmap showed the intensive intergene correlations among the top 10 hub genes in the green model. The intensity of the correlations is reflected by the depth of the red colour. NES, Normalised Enrichment Score.
WGCNA with DEGs was used to construct the coexpression gene models in salivary tissues of patients with SjS, and the green model was the most significant model related to SjS (figure 4C,D). The green model comprised 554 genes, and its function mainly enriched in immunity-related pathways such as immune system process, lymphocyte activation, antigen receptor-mediated signalling and T cell activation (figure 4E). The top 10 hub genes in the green model were as follows: RAC2, PLCG2, PAX2, SELL, EPSTI1, CR2, MS4A1, PTPRC, BANK1, ITGA4 and FAM26F, all of which significantly correlated with each other (figure 4F).
The significantly increased expressions of top 10 upregulated genes of type 1 IFN in SjS salivary tissues were successfully validated in an RNA-seq transcriptomic dataset containing large number of clinical samples (75 SG samples from SjS patients and 39 SG samples from controls; online supplemental figure 1).
Supplemental material
Key biological pathways involved in the glandular injuries of SjS
GSEA of glandular epithelial cells was first performed to identify candidate biological pathways possibly involved in the glandular injuries of patients with SjS (online supplemental table 6).
Supplemental material
GSEA of glandular epithelial cells revealed some significant enriched pathways as follows: epithelial-mesenchymal transition (NES=2.19, FDR q=0.0001), regulation of myeloid leucocyte mediated immunity (NES=2.04, FDR q=0.01), TGF-β Signalling (NES=1.85, FDR q=0.001), complement pathway (NES=1.74, FDR q=0.002), IFN-α response (NES=1.74, FDR q=0.001), T cell migration (NES=1.92, FDR q=0.02), positive regulation of Th1 immune response (NES=1.92, FDR q=0.02), positive regulation of humoral immune response (NES=1.80, FDR q=0.04) and regulation of positive chemotaxis (NES=1.80, FDR q=0.04) (figure 5A,B). The enrichment of these key pathways was similar in the sensitivity analyses, when three SjS with moderate immune infiltrations together with three non-SjS individuals were used as the control group (S6 vs M3+C3) or when three SjS individuals with moderate immune infiltration served as controls (S6 vs M3).
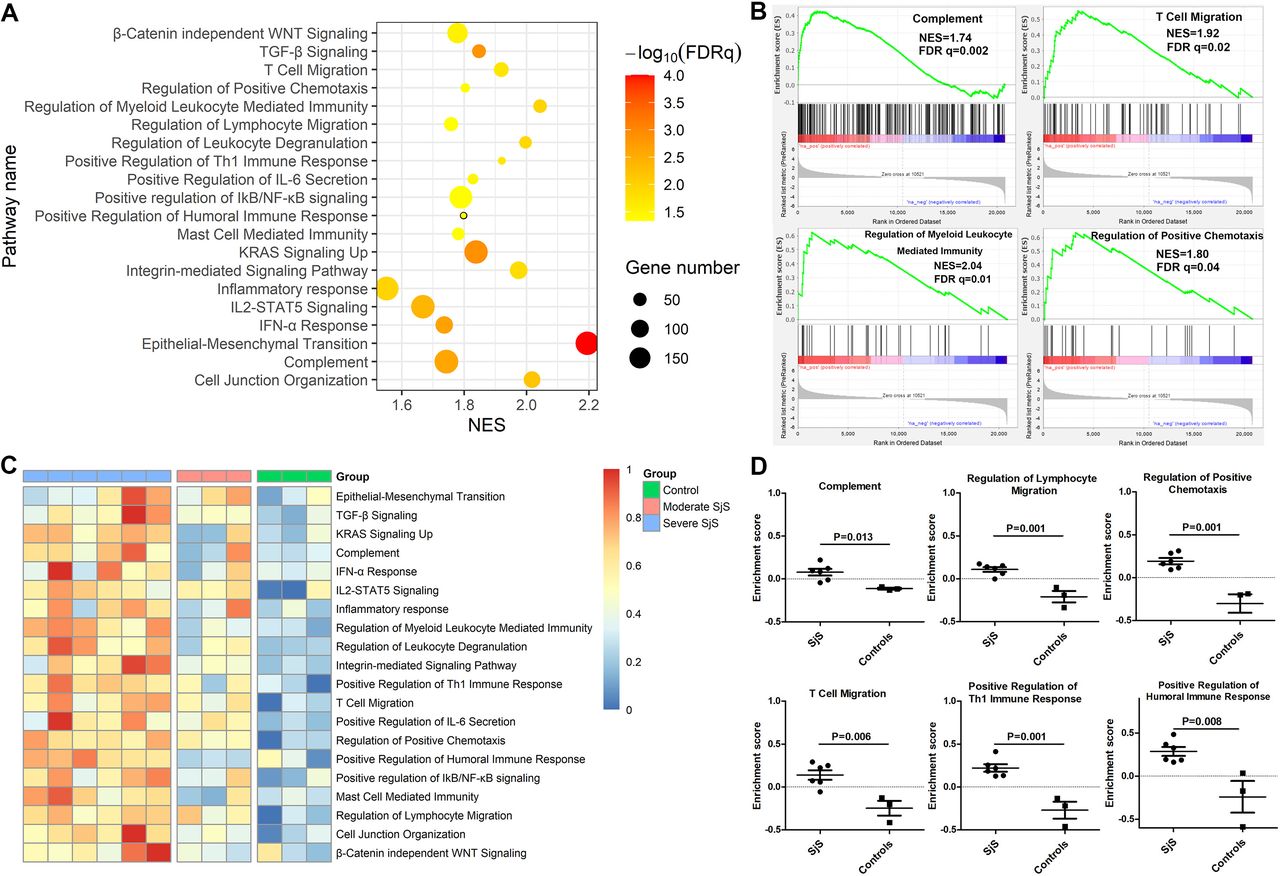
Crucial functional pathways involved glandular injuries of patients with Sjögren’s syndrome (SjS). (A) GSEA of transcriptomic data of glandular epithelial cells revealed certain key pathways involving SjS glandular injuries. (B) Enrichment plots of four key pathways abnormally activated in salivary glandular epithelial cells of patients with SjS. (C) Heatmap of GSVA enrichment scores of key biological pathways abnormally activated in salivary glandular epithelial cells of patients with SjS, and the size of enrichment scores was reflected by the depth of red colour. (D) Difference in the GSVA enrichment scores of key biological pathways in salivary glandular epithelial cells between SjS and non-SjS controls. FDR, false discovery rate; GSEA, Gene set enrichment analysis; GSVA, gene set variation analysis; NES, Normalised Enrichment Score.
The alternations of these key biological pathways in the glandular injuries of SjS were further validated through GSVA. As shown in figure 5C, the enrichment scores of these key biological pathways were increased in the glandular epithelial cells of most patients with SjS with heavy immune infiltrations and were low in the glandular epithelial cells of non-SjS controls. Patients with moderate immune infiltration had modest changes in the enrichment scores of these key biological pathways in the glandular epithelial cells. The enrichment scores of these key biological pathways were statistically higher for SjS with heavy immune infiltrations than non-SjS controls, as follows: complement pathway (p=0.013), T cell migration (p=0.006), regulation of positive chemotaxis (p=0.001), positive regulation of Th1 immune response (p=0.001) and regulation of leucocyte migration (p=0.001) (figure 5D).
Results of case–control study
From 2020 to 2022, 133 patients were evaluated according to the screening criteria. Further, 44 patients meeting the inclusion and exclusion criteria were enrolled. Among them, 13 patients were included in non-SjS control group, and 31 patients were included in SjS group (figure 6). There were no adverse events associated with the biopsy procedure.
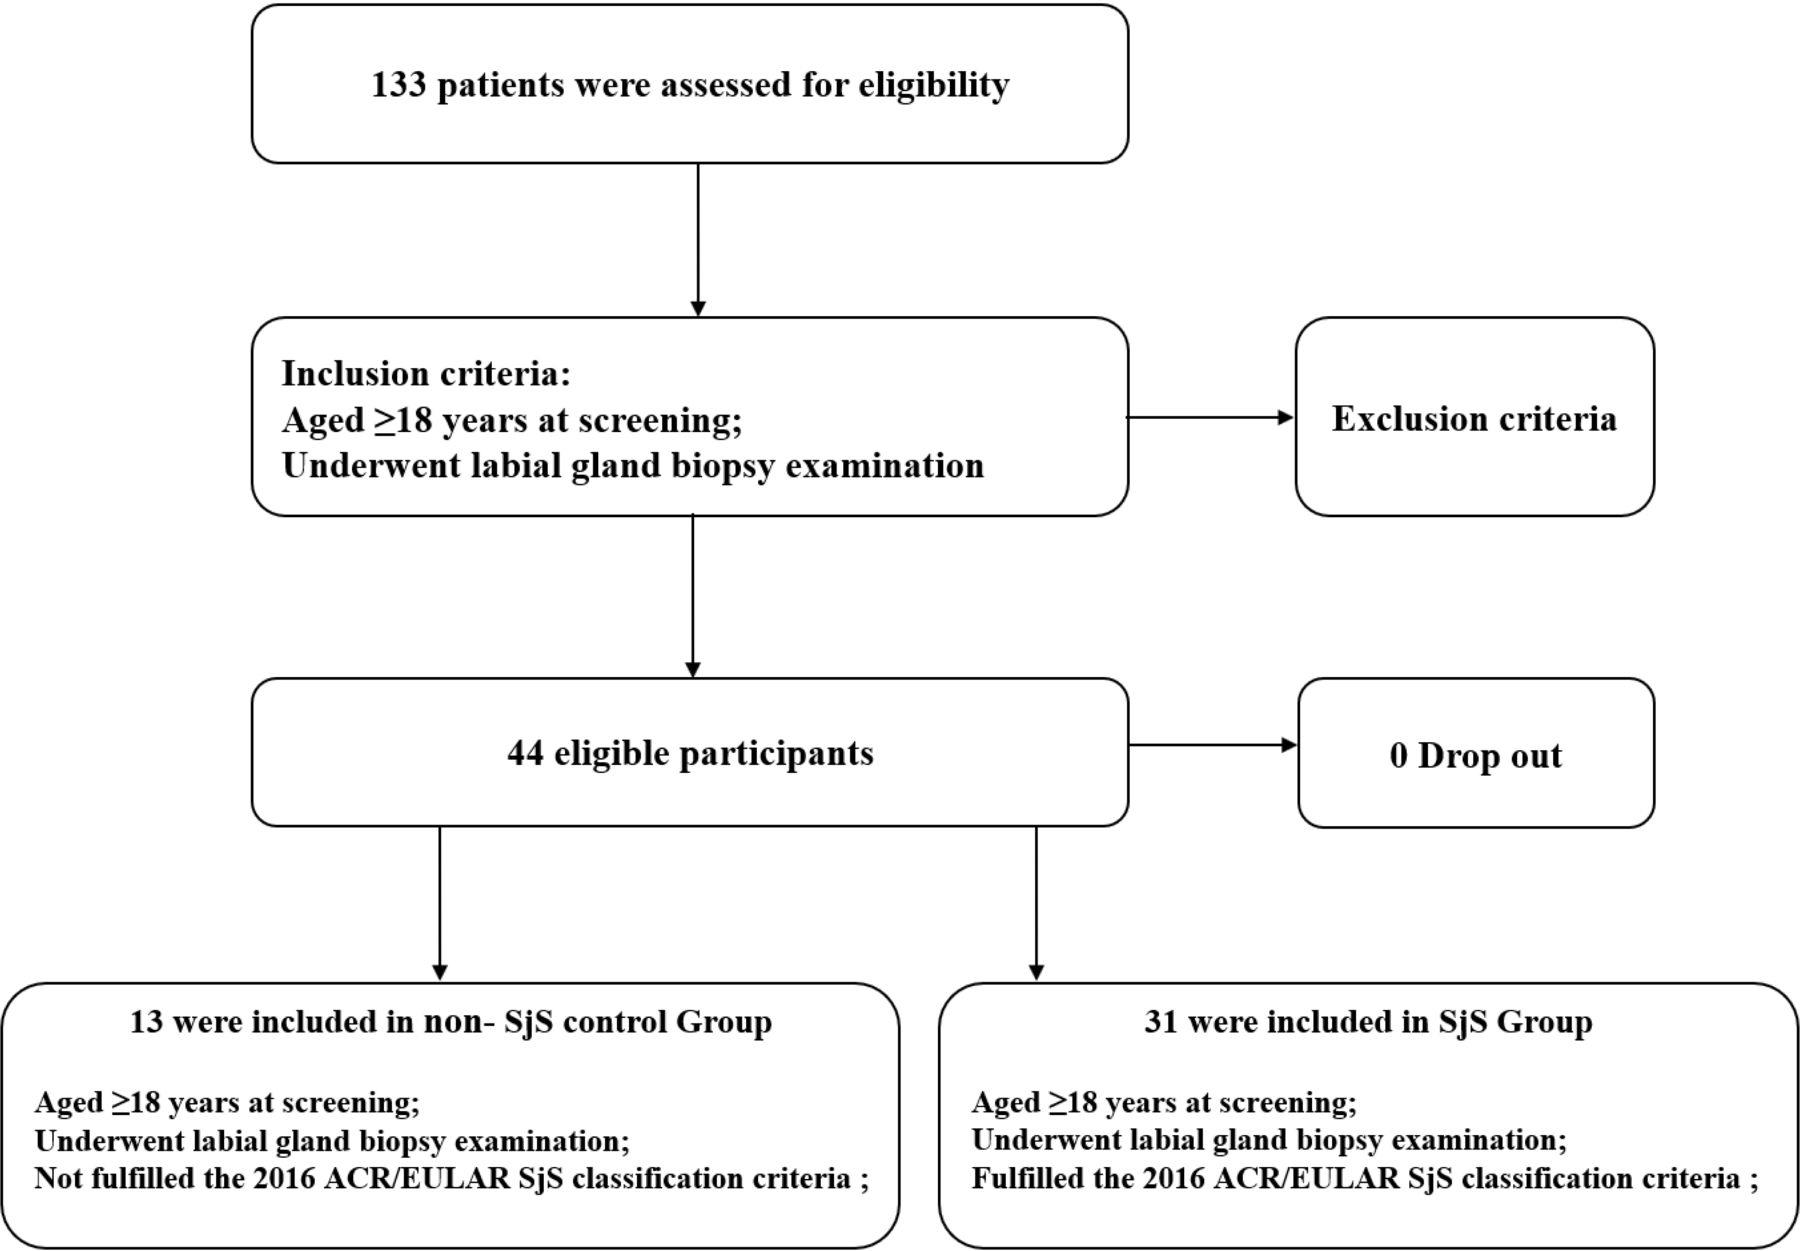
Enrolment of participants. ACR, American College of Rheumatology; SjS, Sjögren’s syndrome.
There were no significant differences in sex and age between the non-SjS control and SjS groups (p>0.05). There was no significant difference between the control group and the SjS group associated with dry mouth and dry eye symptoms (p>0.05). The percentages of cases with positive Anti-SSA/Ro antibodies, and ANA antibodies were significantly different between the two groups (p<0.05). Serum IgG concentrations were significantly different as well (p<0.05). The cases with positive lymphatic foci in the control and SjS groups were 0 (0.0%) and 14 (45.2%), respectively (p<0.05, online supplemental table 7).
Supplemental material
The results of p-STAT1 IHC analyses showed that the p-STAT1 expressions were detected in the SjS group, regardless of the presence of lymphatic focal aggregates. The p-STAT1 expressions were located in the ductal epithelium of LSGs, consistent with the literature.30 Further, the p-STAT1 expression was undetectable in the control group, and the isotype control was undetectable in all groups (figure 7 A, E, F, G & H).

(A) Immunohistochemical analyses of the p-STAT1 expressions in the non-SjS control group. (B) p-STAT1 expressions of the SjS group with positive lymphatic foci. (C) p-STAT1 expressions of SjS group with negative lymphatic foci. (D) p-STAT1 expressions of SjS group with negative anti-SSA/Ro. (E–H) Isotype-specific antibody staining of the non-SjS control group, SjS group with positive lymphatic foci, SjS group with negative lymphatic foci, and SjS group negative with anti-SSA/Ro. Red arrows represent p-STAT1 positive staining. Red asterisks represent positive lymphatic foci. (I) The IOD values of p-STAT1 staining between the non-SjS control and SjS groups. (J.) The IOD values of p-STAT1 staining between the non-SjS control, SjS lymphatic foci-negative, and SjS lymphatic foci-positive groups. (K) ROC curve for IOD values of p-STAT1. AUC, area under the curve, IOD, integrated opticaldensity; SjS, Sjögren’s syndrome.*** p<0.001 and **** p<0.0001.
The IOD values of p-STAT1 staining revealed a significant difference between the control and SjS groups (p<0.05). There was a significant difference in the IOD values between the control and the SjS lymphatic foci negative groups as well (p<0.05). In contrast, in the SjS group, there was no significant difference in the IOD values between the lymphatic foci negative and positive groups (p>0.05, figure 7G,H). The above results suggested that IHC analyses of p-STAT1 expressions could distinguish the SjS group from the control group. Moreover, p-STAT1 further distinguished the patients with SjS but with negative lymphatic foci from the non-SjS control group.
The 2016 ACR/EULAR classification criteria for SjS were used as the reference standard,1 and the IOD value of p-STAT1 was used as an index test to plot the ROC, calculate the AUC and determine the optimal cut-off point.32 The results suggest that the AUC was 0.990 (95% CI 0.969 to 1.000). The optimal cut-off point was 5734.0 (sensitivity and specificity: 100%–96.8%) (figure 7I).
The IOD values of p-STAT1 were transformed into dichotomous variables with the optimal cut-off point. The accuracy, sensitivity, specificity and Jorden index of p-STAT1 and FS were separately calculated.32 The results suggested significant differences in the accuracy and sensitivity between p-STAT1 and FS (p<0.05). The Jorden index for p-STAT1 was 0.968 (95% CI 0.586 to 0.999); while the Jorden index for FS was 0.452 (95% CI 0.026 to 0.640) (table 1). It suggested that the accuracy and sensitivity of the pathological results of p-STAT1 were higher compared with those of the FS, while the specificity was comparable to that of the FS. Therefore, p-STAT1 achieved a good diagnostic value and may be used as a diagnostic marker for SjS, together with FS.
The accuracy, sensitivity, specificity and Jorden index of p-STAT1 and Focus Score
In post hoc analyses, we divided the included participants into p-STAT1 negative and positive groups. Between the two groups, there were significant differences in the concentrations of anti-SSA/Ro antibodies, ANA antibodies, IgG and FS (p<0.05, online supplemental table 8). The correlation analyses suggested a significant correlation between p-STAT1 and IgG concentrations (R=0.394, p<0.05, online supplemental figure 2D).
Supplemental material
Supplemental material
Discussion
In this study, key pathogenic pathways in SjS were first analysed, and the results suggested that the IFN pathway played a key role in the pathogenesis of SjS. p-STAT1, a marker of IFN pathway activation, was found to be highly expressed in the SG samples from patients with SjS, but not in the non-SjS controls.
Increased IFNs expression was detected in peripheral blood and SG specimens from SjS patients and SjS animal models.33 Together with IL-12, IFN can induce the differentiation of naive T lymphocytes into Th1 cells.34 Th1 cells release proinflammatory factors, that disrupt the cellular integrity of SG tissue, leading to impairment of glandular function.35 CD4+ T infiltrates SG in SjS, transcribes IL-2 and IFN, disrupting glandular function.36 IFN promotes apoptosis of salivary epithelial cells.37 The alterations in the salivary tissue microenvironment can overactivate the IFN pathway, and subsequently promote the activation of self-reactive B cells, which drive autoantibody production and contribute to the development of SjS.38
The upregulation of STAT1 expression in SG epithelial cells sorted from SjS SG compared with controls was found in the study by Rivière et al39 p-STAT1 is a key step in the activation of the IFN pathway,12 37 and this activation is particularly required for phosphorylation of STAT1 Ser727.40 Thus, p-STAT1 Ser727 plays an important role in the destruction of SG in SjS.41 The staining of p-STAT1 Ser727 in tissues or cells has been widely used as a biomarker of the activation of type 1 IFN pathway.42
In our study, the IHC test of p-STAT1 can distinguish SG samples of the SjS group from the control group. p-STAT1 was highly expressed in SG samples from patients with SjS with negative lymphatic foci, suggesting that it could help to differentiate patients with SjS with negative lymphatic foci from the controls. Further, the p-STAT1 expressions were localised to the ductal epithelium of LSGs, consistent with the literature.30 43 Therefore, p-STAT1 achieved good a diagnostic value, suitable for use as a diagnostic marker for SjS, together with FS.
In the post hoc analyses, the concentrations of Anti-SSA/Ro antibody, ANA antibody, IgG and the focal score showed significant differences between the negative and positive p-STAT1 groups, suggesting that p-STAT1 was associated with the pathology of SjS. The significant increase in IgG was observed in patients with SjS.44 In this study, the correlation of p-STAT1 with IgG suggested that p-STAT1 may contribute to the diagnosis of SjS, with the potential to reflect the activity of SjS. These results further suggested the feasibility of p-STAT1 as a diagnostic marker for SjS.
Chisholm et al proposed to classify SjS SG lesions into grades 0–4,4 according to lymphocytic infiltration, which was confirmed by Greenspan et al,45 and further work established FS as a pathological criterion.29 Although the FS pathology system is used as a diagnostic tool, it is far from serving as the gold standard for SjS diagnosis.6 Importantly, these pathological diagnostic criteria do not allow for the diagnosis of SG samples with negative lymphatic foci.7 In this study, among patients with a clinical diagnosis of SjS, the positive rate of FS in pathological sections was only 46.7%. Therefore, further exploration of pathological markers is required to improve the consistency of pathological diagnosis with clinical diagnosis.
In this study, the current pathological diagnostic criteria of SjS based on the presence or absence of lymphatic foci cannot effectively identify pathological samples of patients with SjS with negative lymphatic foci, while p-STAT1 is expected to identify SG samples of SjS with negative lymphatic foci, thus improving the consistency between clinical and pathological diagnosis. The sensitivity of the p-STAT1 pathological results was higher than that of FS, thus promising to mitigate the disadvantage of the low sensitivity of SjS pathological diagnosis. This result may shed light on unresolved issues associated with FS system.
This study has some limitations. First, it is necessary to discover other potential pathological indicators based on bioinformatics studies. Second, as a first step to evaluate the clinical application value of p-STAT1, we first designed a case–control study to initially explore the diagnostic value of this index for SjS. We will design diagnostic accuracy studies to further confirm the value of p-STAT1.46 We will also explore the cut-off value for qualitative or semiquantitative analysis of p-STAT1 in IHC in further diagnostic practice.
Third, most participants were from outpatient clinics, such that the representation of inpatients with SjS was insufficient. We will focus on the including of inpatients while expanding the sample size in future studies. In addition, FS should be applied in the setting of FLS and should exclude chronic nonspecific sialadenitis as well as chronic sclerosing sialadenitis.6 We strictly adhered to this pathological recommendation and 45% of patients in the SjS group have a positive FS in this study, which was lower than other SjS cohorts (63.5%–93.7%).3 This may also be related to the small sample size, and it could be addressed by extending the sample size in future studies.
Finally, cell culture may cause some changes in the intracellular transcriptome, and the dataset of epithelial cells used in this study included cultured epithelial cells, which might introduce a bias to the analysis. Future studies using primary epithelial cells are recommended to correctly determine the transcriptome changes in SG epithelial cells.
Conclusion
Bioinformatics analyses revealed that the IFN pathway was the key pathogenic pathway in SjS. We found that p-STAT1, an activation marker of the IFN pathway, may serve as a potential diagnostic marker, as revealed by a case–control study. Further, p-STAT1, in addition to lymphocytic infiltration, may aid in the diagnosis of SjS, particularly for SG samples with negative lymphatic foci.
Supplemental material
Supplemental material
Supplemental material
Supplemental material
Data availability statement
Data are available on reasonable request.
Ethics statements
Patient consent for publication
Ethics approval
Ethics approval for this study, including the consent procedure, was granted by the Research Ethics committee of the First Affiliated Hospital of Xiamen University (National Natural Science Foundation of China U1605223: 'Experimental study on the key nodes of glandular damage in SjS and its use as a target for early diagnosis and treatment') in compliance with the Declaration of Helsinki V and the Danish legislation. All participants granted written informed consent prior to their inclusion in this study. Patients’ data were collected in accordance with the requirement for confidentiality of clinical research data.
References
Supplementary materials
Supplementary Data
This web only file has been produced by the BMJ Publishing Group from an electronic file supplied by the author(s) and has not been edited for content.
Footnotes
QZ, LL and BW are joint first authors.
QZ, LL and BW contributed equally.
Contributors QZ, LL and BW are co-first authors and contributed equally to this study. GS is the corresponding author and guarantor. Signature unit of the first author: Department of Rheumatology and Clinical Immunology, The First Affiliated Hospital of Xiamen University, School of Medicine, Xiamen University, Xiamen, China.
Funding The study was supported by National Natural Science Foundation of China (grant number U1605223, 82171779, 81971536, 81701556); Scientific and Technological Projects of Xiamen City (grant number 3502Z20209004); Joint Funds for the Innovation of Science and Technology, Fujian Province (grant number 2021Y9103, 2021Y9092); Natural Science Foundation of Fujian Province (grant number 2020J01954).
Competing interests None declared.
Provenance and peer review Not commissioned; externally peer reviewed.
Supplemental material This content has been supplied by the author(s). It has not been vetted by BMJ Publishing Group Limited (BMJ) and may not have been peer-reviewed. Any opinions or recommendations discussed are solely those of the author(s) and are not endorsed by BMJ. BMJ disclaims all liability and responsibility arising from any reliance placed on the content. Where the content includes any translated material, BMJ does not warrant the accuracy and reliability of the translations (including but not limited to local regulations, clinical guidelines, terminology, drug names and drug dosages), and is not responsible for any error and/or omissions arising from translation and adaptation or otherwise.