Article Text

Abstract
Objectives Dryness, fatigue and joint/muscle pain are typically assessed in Sjögren’s trials using European Alliance of Associations for Rheumatology Sjögren’s Syndrome Patient Reported Index (ESSPRI). A Patient Acceptable Symptom State of <5 and a Minimal Clinically Important Improvement (MCII)/responder definition (RD) of ≥1 point or 15% on ESSPRI have previously been defined. This study explored alternative RDs to better discriminate between active treatment and placebo in trials.
Methods Anchor-based and distribution-based methods were used to derive RD thresholds in blinded phase IIb trial data (N=190) and confirm these in blinded data pooled from three early phase II trials (N=126). The populations consisted of individuals with moderate-to-severe systemic primary Sjögren’s. Anchors were prioritised by ESSPRI correlations and used in similar conditions. Triangulated estimates were discussed with experts (N=3). The revised RD was compared with the original using unblinded data to assess placebo and treatment responder rates.
Results Patients were predominantly female (>90%), white (90%), with mean age of 50 years. Receiver operating characteristic estimates supported an MCII threshold of 1.5–1.6 in the phase II data, whereas correlation-weighted mean change estimates supported a low/minimal symptom severity threshold of ≥2. A low/minimal symptom severity of ≤3 showed the greatest sensitivity/specificity balance. Analyses in the pooled data supported these thresholds (MCII: 1.5–2.1; low/minimal symptom severity: 2.7–3.7). Unblinded analyses confirmed the revised RD reduced placebo rates.
Conclusions Completing a trial with an improvement of ≥1.5 points compared with baseline and an ESSPRI score of ≤3 points is a relevant RD for moderate-to-severe systemic Sjögren’s and reduces placebo rates.
- Sjogren's Syndrome
- Patient Reported Outcome Measures
- Outcome Assessment, Health Care
Data availability statement
All data relevant to the study are included in the article or uploaded as supplemental information.
This is an open access article distributed in accordance with the Creative Commons Attribution Non Commercial (CC BY-NC 4.0) license, which permits others to distribute, remix, adapt, build upon this work non-commercially, and license their derivative works on different terms, provided the original work is properly cited, appropriate credit is given, any changes made indicated, and the use is non-commercial. See: http://creativecommons.org/licenses/by-nc/4.0/.
Statistics from Altmetric.com
WHAT IS ALREADY KNOWN ON THIS TOPIC
Interpretative guidelines suggest that an improvement of ≥1 point or 15% compared with baseline on European Alliance of Associations for Rheumatology Sjögren’s Syndrome Patient Reported Index (ESSPRI) represents a Minimal Clinically Important Improvement/responder definition (RD). However, this RD often results in poor sensitivity and specificity within trial settings and thus high placebo rates.
WHAT THIS STUDY ADDS
This study explored alternative RDs for ESSPRI by using anchor-based and distribution-based methods to explore thresholds for a total score cut-off representing low/minimal symptom severity and for more stringent thresholds representing meaningful improvement compared with baseline.
Interpretation of results prioritised the optimisation of sensitivity (the ability to correctly identify improved patients) and specificity (the ability to correctly identify stable/worsened patients) to improve confidence that patients will be correctly classified as ‘improved’ in future trial analyses.
Completing a trial with an ESSPRI score of ≤3, with an improvement of ≥1.5 points compared with baseline, is a conservative, relevant and meaningful RD for clinical trials. This revised RD ensures that patients achieve low/minimal symptom severity and exceed minimally important change by the end of the trial while reducing responder/non-responder misclassification and placebo rates.
HOW THIS STUDY MIGHT AFFECT RESEARCH, PRACTICE OR POLICY
This revised RD should facilitate efforts to identify products that make a true difference to patients’ symptoms.
Introduction
Sjögren’s is a heterogeneous, chronic autoimmune disease affecting the exocrine glands. Patient-reported symptoms include dryness, fatigue, and/or joint/muscle pain, and these symptoms are associated with an increased risk of sleep problems, cognitive problems, female sexual dysfunction, anxiety and depressive disorders.1–17 Patient-reported symptoms are important to assess in clinical trials to explore treatment benefit from the patient perspective, particularly as these symptoms are difficult to assess objectively.
The three-item European Alliance of Associations for Rheumatology (EULAR) Sjögren’s Syndrome Patient Reported Index (ESSPRI) is a reliable and valid1 18–20 assessment of dryness, fatigue and joint/muscle pain. Items are rated on a 0–10 Numerical Rating Scale, and a mean total score is calculated, with higher scores indicating greater symptom severity. ESSPRI is used in European clinical practices to assess symptom severity,1 11 20 in clinical trials to assess treatment efficacy21 22 and is well-regarded within the EULAR community.21–23 Although ESSPRI is responsive to change,24–26 a high placebo rate exists in clinical trials.13 27 28 This may partially be due to the variable natural course of Sjögren’s symptoms and a proportion of patients truly improving in the absence of active treatment. However, another explanation could be that endpoint thresholds are not conservative enough to detect and demonstrate treatment efficacy above the level of placebo.
Within-group analyses of observational data from two large prospective cohorts (n=790) suggested a Minimal Clinically Important Improvement (MCII) of ≥1 point or 15% on ESSPRI should be used as a treatment responder definition (RD).29 The results also suggested a Patient Acceptable Symptom State (PASS; that is, a low/minimal symptom severity threshold) of ESSPRI score of <5. However, it should be recognised that this threshold was developed to define the disease state rather than to track changes over time.30 The above MCII is often used to classify patients who have experienced meaningful within-individual change. However, these thresholds may be strengthened by exploring within-individual change using data from controlled interventional studies. Additionally, it may be more relevant to patients to incorporate thresholds for low (not just ‘acceptable’) symptom severity and a higher-than-minimum threshold for improvement. Such thresholds are also likely to be more relevant to clinical trial outcomes, accurately classify patients in trial analyses and reduce placebo rates.
This study explored alternative RDs for ESSPRI scores based on the optimal balance of sensitivity (the ability to correctly identify improved patients) and specificity (the ability to correctly identify stable/worsened patients).31
Methods
Sample
A two-stage approach was used to first derive a range of RD thresholds using blinded data from a phase IIb clinical trial (stage 1),32 and then confirm these in blinded data pooled from three early phase II trials (stage 2). Patients provided informed consent prior to their involvement in these trials, including consent for their information to be used in data analysis and interpretation, and for findings to be published.
Stage 1 used data from 190 patients enrolled in a randomised, double-blind, placebo-controlled interventional phase IIb dose ranging trial of ianalumab (CVAY736A2201 (NCT02962895); online supplemental table 1). Subjects had a diagnosis of primary Sjögren’s according to the revised American European Consensus Group classification criteria,33 and moderate-to-severe systemic disease defined as having a EULAR Sjögren’s Syndrome Disease Activity Index (ESSDAI) score ≥6 on the biological, haematological, articular, cutaneous, glandular, constitutional and lymphadenopathy domains (a subset of ≥30% of patients must have had an ESSDAI ≥10). Stage 1 is hereafter referred to as the ‘phase IIb data’ or ‘phase IIb analyses’.
Supplemental material
Stage 2 used data pooled across three clinical trials: CCVAY736X2201 (NCT02149420), CCFZ533X2203 (NCT02291029), CCDZ173X2203 (NCT02775916) (total N=126). Each trial was an early phase II randomised, double-blind, placebo-controlled trial evaluating the safety, tolerability and preliminary therapeutic efficacy of different compounds (VAY736, CFZ533, CDZ173, respectively). Patients had a diagnosis of primary Sjögren’s and moderate-to-severe systemic disease (as above). Data were pooled due to similar trial designs, time points for response (ie, week 24) and populations (online supplemental table 1). Stage 2 is hereafter referred to as the ‘pooled data’ or ‘pooled analyses’.
Measures
ESSPRI, ESSDAI, 36-item Short-Form Survey (SF-36), Physician’s Global Assessment (PhGA) and Patient Global Assessment (PaGA) were administered at regular intervals in all trials. Functional Assessment of Chronic Illness Therapy–Fatigue (FACIT-F) was administered in the phase IIb trial, whereas the Multidimensional Fatigue Inventory (MFI) was administered in the trials included in the pooled analyses (online supplemental table 2).
Statistical analysis
For both the phase IIb data and pooled data, statistical analyses were performed in four steps in accordance with US Food and Drug Administration (FDA) patient-reported outcome (PRO) industry guidelines for deriving meaningful change thresholds of PROs.31 34 In summary, multiple methods were used to estimate meaningful change thresholds, resulting in range of values. These values were then triangulated (ie, the process of converging estimates into a single or small range of values) using predefined criteria. More specifically, FDA and The Professional Society for Health Economics and Outcomes Research (ISPOR) taskforce guidance were followed during triangulation, meaning anchor-based methods were prioritised over distribution-based methods and multiple methods and anchors were used to arrive at a triangulated result.31 34 When considering the hierarchy of estimates from the different approaches, anchor-based estimates are assigned more weight than distribution-based estimates, as they are more closely related to the patient perspective. Specific to anchor-based analyses, the proximity of anchor to the target PRO instrument was also considered, with more importance to estimates generated from more closely linked concepts and highly correlated pairings (ie, patient report rather than clinician report).
Additionally, to guide triangulation of estimates (but not explicitly define them), graphing assessments using a forest plot were supplemented by a correlation-weighted average31 34 of all estimates, where estimates are weighted by the observed correlations between change in anchor and score.
An overview of the methods is provided in figure 1.

Overview of methods used to examine ESSPRI thresholds of improvement and severity in the phase IIb and pooled analyses. *Phase IIb analyses only. **Pooled analyses only. ESSDAI, EULAR Sjögren’s Syndrome Disease Activity Index; ESSPRI, EULAR Sjögren's Syndrome Patient Reported Index; EULAR, European Alliance of Associations for Rheumatology; FACIT-F, Functional Assessment of Chronic Illness Therapy–Fatigue; MCS, Mental Component Score; MFI, Multidimensional Fatigue Inventory; PaGA, Patient Global Assessment; PCS, Physical Component Score; PhGA, Physician’s Global Assessment; SF-36, 36-item Short-Form Survey.
Step 1: anchor-based approaches to exploring meaningful change thresholds
Assessing potential anchors
An ‘anchor’ is a simple measure assessing a specific concept used to validate and interpret an instrument assessing the same concept,34 in this case symptom severity. Potential anchors were selected based on conceptual overlap with ESSPRI total score and their relevance was confirmed by clinical experts in the research team. Polyserial correlations indicated whether anchors correlated sufficiently (≥0.3) with ESSPRI total score.34
PaGA and PhGA scores were stratified in three ways: (a) based on literature indicating a 2-point/20 mm change is meaningful35 36; (b) based on stratification used in rheumatic arthritis37 and (c) based on literature suggesting 0.5 SD change can be used to support meaningful change thresholds.38 See online supplemental table 3 for information on how the anchor groups used for meaningful change threshold analyses were defined.
Within-group mean change
Patients were classified as ‘moderate-major improvement’, ‘minimal improvement’, ‘stable’, ‘minimal worsening’ or ‘moderate-major worsening’ based on predefined anchor definitions from the literature (see online supplemental table 3). To assess whether patients classified as improved had achieved a meaningful benefit, a mixed-effects analysis of covariance model for repeated measures (MMRM) was used to assess whether mean ESSPRI score at week 24 for each group was significantly different and exceeded the score for the minimally improved patients (defined as the least squares mean change score for the minimally improved group). Specifically, the minimal improvement group was relied upon for assessing the smallest amount of change that might be meaningful. The SE of measurement refers to the smallest difference between groups that can be distinguished from measurement error (SEM).
Within-individual change
Meaningful improvement was also assessed at an individual level to determine how to classify patients in clinical trials as ‘responders’ based on ESSPRI scores.
Receiver operating characteristic (ROC) curves were plotted to find the ESSPRI change score that optimally discriminated between groups of patients who were classified as having either a ‘minimal improvement or better’ versus a ‘stable or decline’ for each anchor. The optimal cut-off point was determined based on the most sensitive and specific change score using Youden’s J index39 (maximising the difference between true positive and false positive rates), and the sum of squares method40 (selecting the threshold linearly closest to a perfect classification).
ROC curves with an area under the curve (AUC) >0.70 were used to derive ESSPRI meaningful change estimates.41 Empirical cumulative distribution function (eCDF) and probability density function (PDF) curves were also produced to evaluate how well anchors separated the distributions of ESSPRI change scores.
Step 2: distribution-based methods to explore meaningful change thresholds
Distribution‐based estimates of o.5 SD at baseline and 1 SEM at baseline were also calculated to identify the amount of change exceeding measurement error.31 42 Given that SEM is calculated using reliability thresholds of 0.75, Cronbach’s alpha at baseline was used for measures with ≥three items and kappa coefficients based on inter-rater reliability were used for clinician assessments with <three items.
Step 3: triangulation of anchor and distribution-based methods to derive meaningful change thresholds
Multiple meaningful change estimates were produced from the anchor-based and distribution-based methods and triangulated as per recommendations in the literature,31 34 forming a recommended threshold for RDs.43 Estimates were presented on a forest plot to identify convergence around a small range of values. Anchor‐based estimates were given primary consideration and distribution‐based methods were considered supplementary.34 A weighted average was also calculated to produce a single threshold across anchors (Mweighted).43
Step 4: approaches to explore symptom severity thresholds
ROC curves were used to estimate cut-off points for symptom severity for ESSPRI scores. Specifically, the ESSPRI score that defined between the lowest (group 1) and middle (group 2) severity groups, and the ESSPRI score that defined between the middle (group 2) and highest (group 3) severity groups were identified. Group definitions were informed by definitions used in previous studies (table 1). AUC (approximately >0.70), specificity and sensitivity were used to determine anchor appropriateness. To aid interpretation, boxplots displaying the spread of ESSPRI scores for the three severity groups were produced and superimposed with a scatter plot of patient responses and reference lines indicating the range of potential appropriate thresholds.
Anchor groups and hierarchy for defining severity groups
Comparison of ESSPRI original and revised RDs using unblinded trial data
Finally, the trials were unblinded and a responder analysis was conducted to compare results between the original ESSPRI RD (ESSPRI total score is reduced by ≥1 point or 15%)29 and the revised thresholds identified here (completing a Sjögren’s trial with an ESSPRI score ≤3, which has reduced by ≥1.5 points). The percentage of participants who met the RDs was evaluated by treatment group.
Patient and public involvement
While the primary methods were statistically and psychometrically based, at each stage, clinical expert opinion (n=3) was sought to ensure that the thresholds chosen for ESSPRI severity and change were clinically relevant and feasible within the context of clinical trials. As recommended by the FDA,31 a separate interview study with individuals with Sjögren’s was also conducted in parallel to this quantitative study to help refine and contextualise the revised RD.44
Results
Patient characteristics
Patients were predominantly female (>90%), with a mean age of approximately 50 years, reflecting the broader population with Sjögren’s (table 2).45 See online supplemental table 4 for clinical outcome assessment descriptive statistics.
Demographic characteristics for both datasets
Derivation of a revised RD using phase IIb data and confirmation of revised RD using pooled data
Step 1: anchor-based approaches to exploring meaningful change thresholds
Assessing potential anchors
Using the phase IIb data, change correlations (online supplemental table 5A) showed that PaGA stratifications (A: 2-point change; B: 4-point change; C: 0.5 SD change), PhGA stratifications (A: 2-point change; B: 3-point change; C: 0.5 SD change), FACIT-F and SF-36 Physical Component Score (PCS) were appropriate for use (r>0.30)34 as anchors.
Change correlations in the pooled data (online supplemental table 5B) demonstrated that all of the above anchors plus MFI and SF-36 Mental Component Score met the criteria for use (>0.30).34 However, PaGA and PhGA stratifications A (2-point change) and C (0.5 SD change) had small group numbers for ‘minimal improvement’ and ‘stable’ change categories, making it hard to justify their results as meaningful. As such, PaGA stratification B (4-point change), PhGA stratification B (3-point change) and SF-36 PCS were prioritised in both analyses.
Within-group mean change
Within-group mean change scores highlighted that patients who experienced minimal improvement on the anchors had ESSPRI total score improvements ranging from 1.5 to 2.3 between baseline and week 24 in the phase IIb data and between 1.5 and 2.2 in the pooled data. The moderate-major improvement group had a mean score range between 2.0 and 4.1 in the phase IIb data and between 2.9 and 4.5 in the pooled data. Sample sizes for ‘worsened’ groups were too small in both datasets (n≤25) for meaningful interpretation.
Within-individual change
ROC curves suggested a change between 1.3 and 2.0 in the phase IIb data and between 0.7 and 3.0 in the pooled data could be considered a threshold to define the minimal meaningful improvement in an individual.
Consideration of eCDF and PDF curves supported the range of thresholds derived in within-group assessment of minimal meaningful improvement and the ROC curve analysis identified across both datasets.
Step 2: distribution-based methods
Distribution-based methods suggested that a meaningful improvement threshold should be ≥1.4 (range: 0.6–1.4) in the phase IIb data and only slightly lower at ≥1.1 in the pooled data (range: 0.5–1.1).
Step 3: triangulation
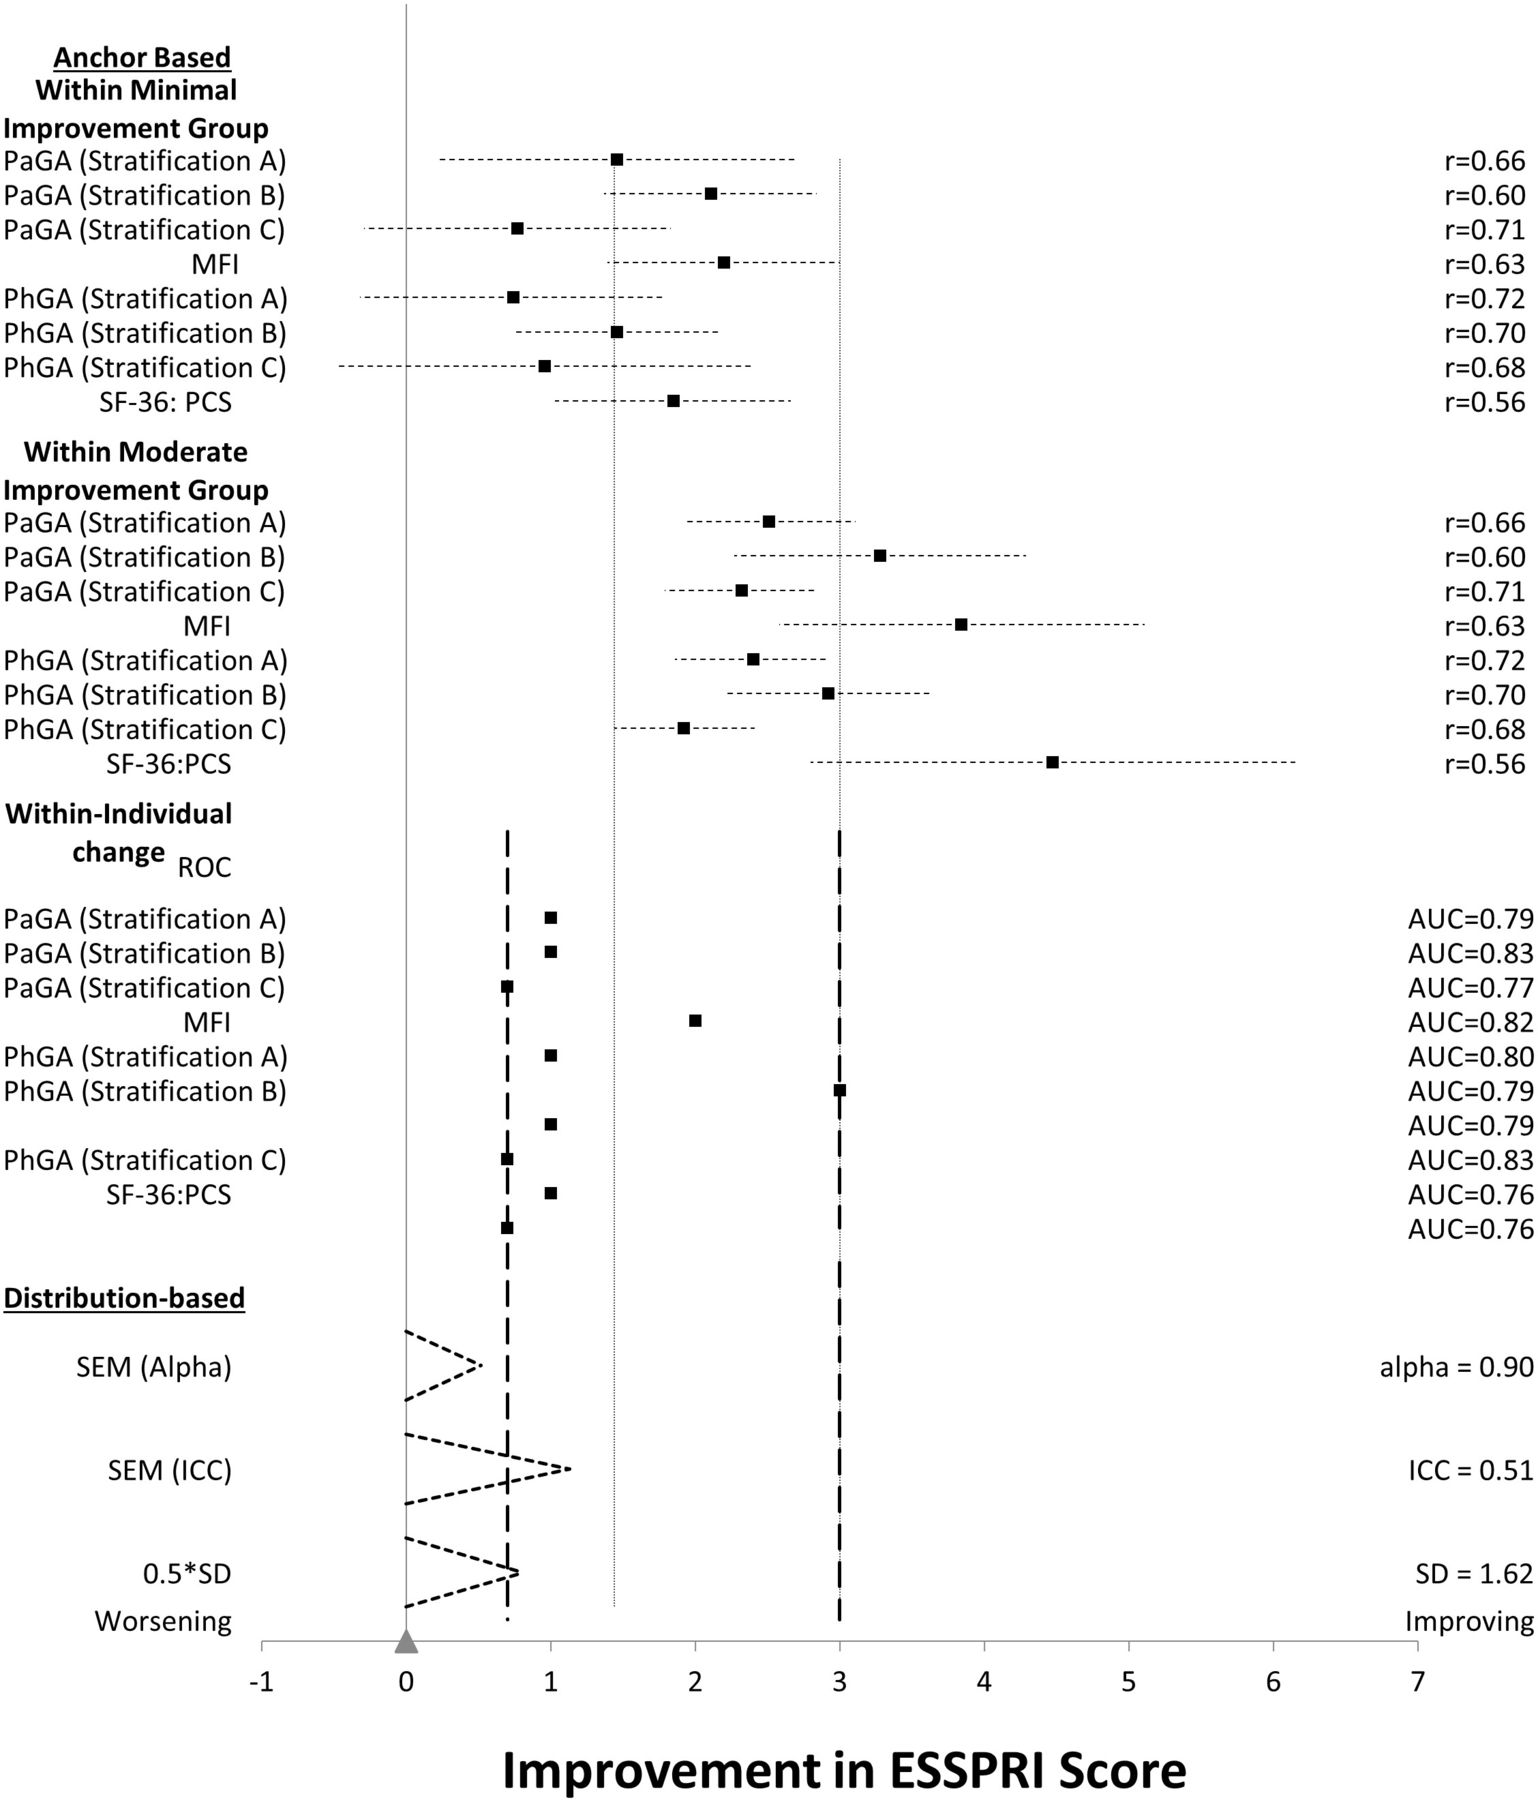
To narrow the range and inform a recommended threshold for the revised RD, all estimates from the phase IIb data were triangulated (figure 2).43 We considered that estimates of ≥1, ≥1.5 or ≥2 were supported by the data and selected ≥1.5 (as higher than the threshold suggested by the distribution methods) for a meaningful yet realistic improvement for RD. This was reinforced by the correlation-weighted average of estimates arising from the mean of the minimal improvement group in the MMRM and the ROC estimates (Mweighted=1.6). This was further supported by clinical expert (n=3) feedback, with ≥2.0 points representing a more stringent but possibly less achievable improvement.

Triangulation of ESSPRI meaningful change estimates in the phase IIb data. (1) Dashed reference lines show the minimum and maximum improvement thresholds from the ROC curves; (2) dotted reference lines show the minimum and maximum of the lower confidence limit of moderate group estimates and upper confidence limit of minimal estimates; (3) note some ROC curve estimates have two entries, reflecting contrasting results being suggested by Youden’s J and sum of squares methods. AUC, area under the curve; ESSPRI, EULAR Sjögren's Syndrome Patient Reported Index; EULAR, European Alliance of Associations for Rheumatology; FACIT-F, Functional Assessment of Chronic Illness Therapy–Fatigue; ICC, intraclass correlation coefficient; PaGA, Patient Global Assessment; PCS, Physical Component Score; PhGA, Physician’s Global Assessment; ROC, receiver operating characteristic; SF-36, 36-item Short-Form Survey.
To assess if the ≥1.5 threshold chosen following the analyses of the phase IIb data was confirmed by the pooled data, the estimates from the pooled data were also triangulated (figure 3).43 Looking at the pooled data on their own, an estimate of ≥1 is probably best supported by the pooled data. However, the pooled data also supported estimates of ≥1.5 or ≥2. Hence, we considered that the pooled data confirmed the ≥1.5 threshold chosen following the analyses of the phase IIb data.
Triangulation of ESSPRI meaningful change estimates in the pooled data. (1) Dashed reference lines show the minimum and maximum improvement thresholds from the ROC curves; (2) dotted reference lines show the minimum and maximum of the lower confidence limit of moderate group estimates and upper confidence limit of minimal estimates; (3) note some ROC curve estimates have two entries, reflecting contrasting results being suggested by Youden’s J and sum of squares methods. AUC, area under the curve; ESSPRI, EULAR Sjögren's Syndrome Patient Reported Index; EULAR, European Alliance of Associations for Rheumatology; ICC, intraclass correlation coefficient; MFI, Multidimensional Fatigue Inventory; PaGA, Patient Global Assessment; PCS, Physical Component Score; PhGA, Physician’s Global Assessment; ROC, receiver operating characteristic; SF-36, 36-item Short-Form Survey.
Step 4: approaches to explore symptom severity thresholds
Using phase IIb data, ROC curves, boxplots and clinical input regarding a cut-off point for ‘low/minimal symptom severity’ all indicated that a threshold of 3.0 was sufficiently conservative, clinically meaningful, and an optimal balance between sensitivity and specificity. Similar results were found using the pooled data (range 3.3–3.7; table 3 and online supplemental figures 1–4).
ROC results for priority anchors in derivation of ‘low/minimal symptom severity’
Taken together, these results suggest that an ESSPRI total score of ≤3, with an improvement in ESSPRI since baseline of ≥1.5 points, is conservative, relevant and meaningful for use in a clinical trial. This RD accounts for patients achieving ‘low/minimal symptom severity’ and exceeding minimally important improvement by the end of the trial while reducing misclassification.
Of note, we focused on the anchor analysis results for PaGA and PhGA due to their consistent use across the trials and FDA’s endorsement of global items for anchor analysis.31 Other anchors, such as FACIT, MFI and SF-36, were not used across all trials, which resulted in smaller sample sizes and larger CIs for these measures. However, when considering the small sample sizes and larger CIs, the estimates were consistent with the other anchors.
Comparison of ESSPRI original and revised RDs using unblinded trial data
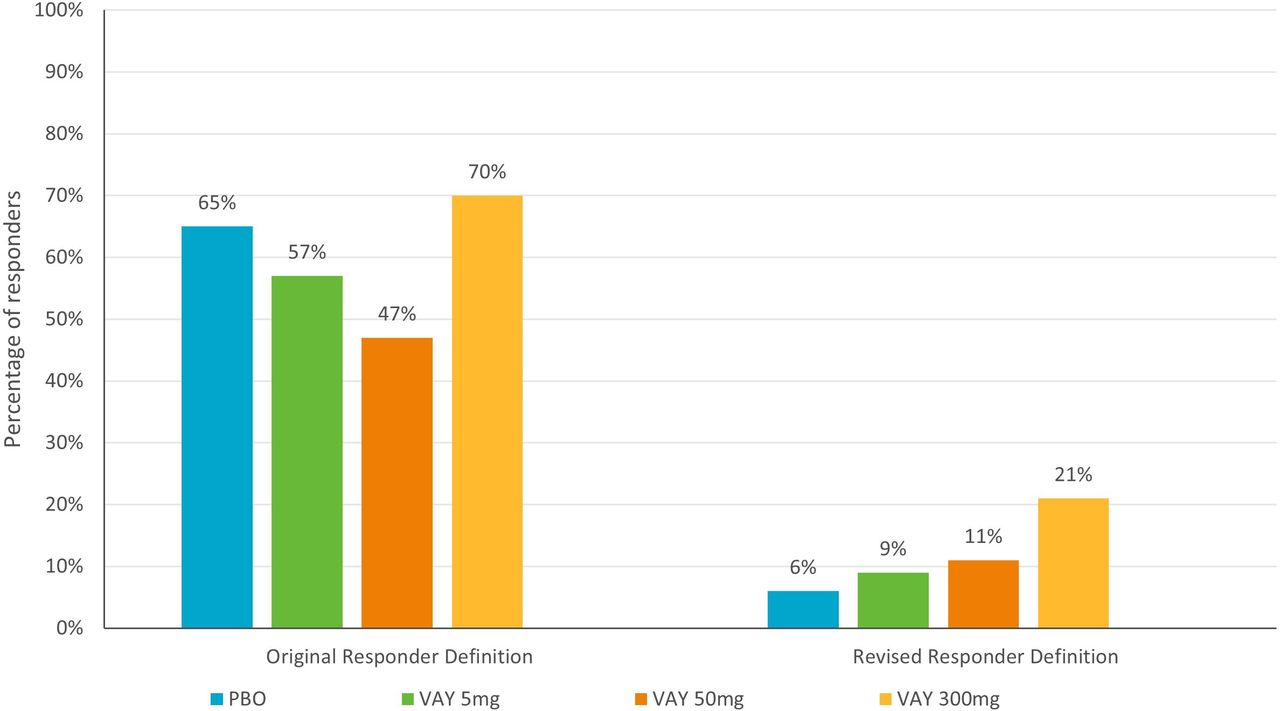
As shown in figure 4, when using the phase IIb data, the percentage of responders in the placebo group reduced from 65% (using the original RD)29 to 6% (revised RD). A similar reduction from 39% (original) to 4% (revised) was found when using the pooled data. The percentage of responders in the treatment groups was also reduced with the revised RD (eg, 70% to 21% for VAY 300 mg). However, the delta between the placebo and treatment group increased from 5% to 15% for VAY 300 mg, confirming a better balance of sensitivity and specificity.

Comparison of ESSPRI original and revised responder definitions using unblinded trial data. ESSPRI, EULAR Sjögren's Syndrome Patient Reported Index; EULAR, European Alliance of Associations for Rheumatology; PBO, placebo.
Discussion
In accordance with methodological guidelines,34 42 46 this study incorporated the results of both anchor-based and distribution-based methods to propose a revised RD for ESSPRI: completing a trial with an ESSPRI score of ≤3, with an improvement in ESSPRI of ≥1.5 points compared with baseline. This revised RD not only increases the MCII threshold (ie, ≥1.5 points—previously ≥1 point or 15% improvement) and is supported by qualitative data from an interview study,44 but also incorporates a low/minimal symptom severity threshold that at ≤3 points was lower than the previously identified PASS of <5.
Estimates for meaningful improvement ranged between 0.73 and 4.47 (including both ‘minimal’ and ‘moderate-major’ improvement) and estimates for a cut-off point for ‘low/minimal symptom severity’ ranged between 3.0 and 4.3. Clinical experts provided input on the clinical relevance, appropriateness and feasibility of achieving these improvements within a clinical trial. During discussions, an improvement of 2 points compared with baseline was given thorough consideration. However, it was agreed that this would be challenging to achieve given Sjögren’s trial designs and is generally based on moderate-major improvement on PaGA and PhGA stratification B, thus representing a relatively higher level of improvement than other anchor-based methods. Therefore, an improvement in ESSPRI total score of 1.5 points compared with baseline was considered both meaningful and realistic in the context of Sjögren’s trials. This was further supported by evidence from an interview study with individuals with Sjögren’s whereby a 1-point or 2-point improvement on ESSPRI was considered meaningful.44
In an effort to develop a ‘treat to target endpoint’ (ie, a patient-relevant definition of a disease state that would improve their feeling and functioning), it was agreed that a cut-off point of ≤3 for ‘low/minimal symptom severity’ should be included in the revised RD. This was a fundamentally different goal than the original PASS, which was developed as a diagnostic criterion rather than to assess change, and the original PASS was not used as a comparator during analyses. However, the ≤3 cut-off was deemed more conservative and an optimal balance of sensitivity and specificity.
Applying the revised RD to unblinded data confirmed that it not only reduced placebo rates but also increased the difference in the number of responders between placebo and treatment groups. This suggests that the revised RD is better able to distinguish true responders from patients with stable/worsened symptom severity. When each element of the composite was examined on its own, the ≥1.5 improvement from baseline threshold showed increased responders (including placebo response), while a final ESSPRI score of ≤3 has a similar outcome as the composite score. Thus, depending on the study, the endpoints could be used separately rather than as part of a composite approach. However, we consider the combined definition to be both clinically and psychometrically valid while also reflecting a patient-relevant endpoint of a disease state that improves how a patient feels and functions. Having a more accurate sense of true placebo effects has implications for pharmaceutical companies when making decisions to move forward with products in early development, as well as for clinicians and patients who can use the information to make appropriate risk/benefit analyses when deciding on approved treatments.
It is expected that estimates may vary in other analyses depending on patient populations and trial design. Further research may benefit from using additional anchors such as patient and clinician global impression of change items and a dry eye severity score (given that dry eyes are a hallmark symptom of Sjögren’s) to assess change and severity thresholds. However, it is reasonable to speculate that the revised RD will be associated with a better balance between sensitivity and specificity in this patient-reported composite endpoint. Of note, composite endpoints that include both clinician and patient-reported outcomes, as well as clinical tests, have been able to reduce placebo response rates and discriminate between active treatment and placebo (see CRESS and STAR Studies) and are worth exploring further dependent on the trial design and measurement strategy.47 48 However, when using these composite endpoints, patients can be considered ‘responders’ based on improvements in clinical tests alone. As such, the revised ESSPRI RD presented in this paper is a more patient-centric approach and is therefore of interest to regulators.31
Limitations
We acknowledge that the triangulation results support other potential values. However, selection of an RD of ≥1.5 improvement from baseline is an appropriate balance between the less stringent ≥1 threshold which has poor specificity, and the more stringent ≥2 threshold which clinical experts stated would likely not be feasible, leading to poor sensitivity. Ultimately, this balance reduces responder/non-responder misclassification and placebo rates.
All data analysed here were from trials with defined eligibility criteria; thus, results may not be fully generalisable to the wider population with Sjögren’s and estimates may be inflated due to trial inclusion criteria (ESSDAI ≥6 at screening in all trials; ESSPRI ≥5 at screening in two of the four trials). However, there were no criteria relating to ESSPRI for two trials in the pooled dataset, which did lead to some patients having a baseline score of <5. Further, patients with an ESSPRI score ≥5 or ESSDAI score ≥6 at screening may have had a score of <5 or <6, respectively, by baseline. Similarly, subgroup analyses could not be conducted to determine whether the revised RD is applicable to different racial and ethnic groups due to small sample sizes across the subgroups. However, this work was exploratory in nature and will be confirmed in a larger sample during further validation work.
It should be acknowledged that previous thresholds were derived in studies with larger samples.29 However, as described above, further validation will be conducted in a larger sample. It is also acknowledged that some of the change group sizes in the pooled analyses were small due to fewer week 24 datapoints. Nevertheless, the results of the pooled data analyses are supportive of the phase IIb data analyses, which had a larger sample size. In both datasets, thresholds for meaningful worsening could not be explored due to low sample sizes for ‘worsened’ groups (n≤25; range n=1–25; median n=3 and 6), potentially limiting specificity to some degree despite higher sample sizes in the stable group across the majority of anchors and trials.49–52 This is likely to be a recurring issue in clinical trials, and given the high placebo effect in Sjogren’s trials, it may be necessary to use longitudinal observational studies to examine thresholds for meaningful ‘worsening’. However, data from the aforementioned interview study with individuals with Sjögren’s suggest that meaningful change thresholds are similar in both directions as most individuals thought a 1-point or 2-point worsening as well as improvement would be meaningful on ESSPRI.44
The similar set of anchors used, and analyses conducted in the phase IIb and pooled analyses may have introduced optimism or bias. However, the analyses performed in the two datasets were conducted by two independent psychometricians who came to similar conclusions, and the further validation work could be used to eliminate this.
Conclusion
Completing a trial with an ESSPRI score of ≤3, with an improvement of ≥1.5 points compared with baseline, is a conservative, relevant and meaningful RD for clinical trials. This revised RD ensures that patients achieve low/minimal symptom severity and exceed minimally important change by the end of the trial while reducing responder/non-responder misclassification and placebo rates. Ultimately, this revised RD should facilitate efforts to identify products that make a true difference to patients’ symptoms. Future work could use the revised RD to assess molecular, clinical and treatment differences.
Data availability statement
All data relevant to the study are included in the article or uploaded as supplemental information.
Ethics statements
Patient consent for publication
Ethics approval
Not applicable.
Acknowledgments
We wish to thank Mike Greenwood for his statistical advice. SB’s salary is part-funded by the NIHR Birmingham Biomedical Research Centre.
References
Supplementary materials
Supplementary Data
This web only file has been produced by the BMJ Publishing Group from an electronic file supplied by the author(s) and has not been edited for content.
Footnotes
Contributors SW contributed to the design of the study (including the statistical analysis plan) and interpretation of the results, was a major contributor to writing and revising the manuscript, and provided final approval of the manuscript. LA-W contributed to the design of the study (including the statistical analysis plan), interpretation of the results and revising the manuscript, and provided final approval of the manuscript. EA contributed to data analysis and interpretation of the results, and provided final approval of the manuscript. PGr contributed to the design of the study, data analysis, interpretation of the results and revising the manuscript, and provided final approval of the manuscript. SB made a substantial contribution to the interpretation of the results and revising the manuscript to ensure important intellectual content, and provided final approval of the manuscript. WH contributed to the design of the study, data analysis, interpretation of the results and revising the manuscript, and provided final approval of the manuscript. BN contributed to the design of the study, interpretation of the results and revising the manuscript, and provided final approval of the manuscript. DK contributed to the design of the study, data analysis, interpretation of the results and revising the manuscript, and provided final approval of the manuscript. PGo supervised the research and contributed to the design of the study, interpretation of the results and revising the manuscript, provided final approval of the manuscript and is responsible for the overall content as guarantor.
Funding This study was funded by Novartis.
Competing interests Authors on this manuscript are either employees of or consultants to Novartis, a pharmaceutical company developing products for patients with Sjogren’s. SB has consulted in the field of Sjogren’s in the past 3 years for AbbVie, AstraZeneca, BMS, Galapagos, Novartis and Resolve Pharmaceuticals.
Provenance and peer review Not commissioned; externally peer reviewed.
Supplemental material This content has been supplied by the author(s). It has not been vetted by BMJ Publishing Group Limited (BMJ) and may not have been peer-reviewed. Any opinions or recommendations discussed are solely those of the author(s) and are not endorsed by BMJ. BMJ disclaims all liability and responsibility arising from any reliance placed on the content. Where the content includes any translated material, BMJ does not warrant the accuracy and reliability of the translations (including but not limited to local regulations, clinical guidelines, terminology, drug names and drug dosages), and is not responsible for any error and/or omissions arising from translation and adaptation or otherwise.