Article Text

Abstract
Objective To assess the finger vascularity of systemic sclerosis patients with Raynaud’s phenomenon (RP-SSc) using various ultrasound techniques.
Methods All fingers (except thumbs) of 18 RP-SSc patients and 18 controls were imaged at room temperature using four ultrasound vascular imaging techniques. The percent vascular area was quantified by counting blood flow pixels in a 25 mm2 square centred at the nail fold for the dorsal side and in 25 mm2 and 100 mm2 square from the fingertip for the ventral side. The mean vascular intensity was calculated from the corresponding areas for dorsal and ventral sides.
Results The percent vascular areas and mean vascular intensities in RP-SSc were significantly lower than those in controls for both dorsal and ventral sides (p<0.01). The mean vascular intensities showed slightly higher area under the curve (AUC) than the percent vascular areas (0.53–0.91 vs 0.53–0.90) regardless of imaging technique and assessment side. For each imaging technique, the ventral side vascularity showed a higher AUC (0.74–0.91) compared with the dorsal side (0.53–0.81). Moreover, ventral side abnormalities were associated with a history of digital ulcers.
Conclusions Ultrasound demonstrated potential to quantify finger vascularity of RP-SSc. The ventral side of the fingers showed a higher accuracy in detecting RP-SSc than the dorsal side.
- Autoimmune Diseases
- Ultrasonography
- Scleroderma, Systemic
Data availability statement
Data are available on reasonable request. Quantified ultrasound data may be available on reasonable request but patients’ data are not available to the public.
This is an open access article distributed in accordance with the Creative Commons Attribution Non Commercial (CC BY-NC 4.0) license, which permits others to distribute, remix, adapt, build upon this work non-commercially, and license their derivative works on different terms, provided the original work is properly cited, appropriate credit is given, any changes made indicated, and the use is non-commercial. See: http://creativecommons.org/licenses/by-nc/4.0/.
Statistics from Altmetric.com
WHAT IS ALREADY KNOWN ON THIS TOPIC
Currently, nailfold capillaroscopy (NFC) is the most widely used imaging method to evaluate the microangiopathy of systemic sclerosis (SSc) patients. However, the vascular evaluation with NFC is limited to the nail fold area and is mainly a qualitative structural evaluation based on the shape, size and density of capillaries.
WHAT THIS STUDY ADDS
This study showed that ultrasound vascular imaging on the ventral side of the fingers can be useful to quantify the microangiopathy of SSc patients with Raynaud’s phenomenon.
HOW THIS STUDY MIGHT AFFECT RESEARCH, PRACTICE OR POLICY
Our study results encourage further exploration of quantitative digital vascularity to complement current clinical tools such as NFC in supporting the diagnosis of SSc and other autoimmune rheumatic diseases.
Introduction
Raynaud’s phenomenon (RP) is a hallmark for systemic sclerosis (SSc) vasculopathy, being present almost universally in SSc patients.1 2 Cumulative evidence has shown that objective assessment of vasculopathy is crucial for early diagnosis of SSc3–5 Currently, the most widely used method for this assessment is nailfold capillaroscopy (NFC). Specific NFC patterns were identified in SSc and published in 2000.5 The presence of three NFC scleroderma patterns were included as a criteria for SSc, in the 2013 American College of Rheumatology (ACR)/EULAR classification criteria5 6 The presence of these specific NFC abnormalities is a key clinical finding for differentiating primary from secondary RP.1 6 7 Additionally, the presence of SSc NFC patterns in patients with positive specific SSc antibodies allows the diagnosis of ‘early’ or ‘very early’ SSc in patients without any other organ involvement including the skin.3 Furthermore, NFC patterns have shown potential for the prediction of organ involvement severity, risk prediction of the new digital ulcer formation and evaluation of the clinical effect of treatment.8–11 However, the NFC evaluation is mainly a qualitative structural evaluation based on the shape, size and density of capillaries.6 7 Moreover, the vascular evaluation with NFC is limited to the microcirculation of the nailfold area, as opposed to the ventral side of the finger, away from the area where digital ulcers usually develop.
A newer imaging technique, such as laser speckle contrast analysis (LASCA, also known as laser speckle contrast imaging) or photoacoustic imaging (PA), has been applied to evaluate the peripheral blood flow5 12–14 or blood oxygenation levels15 16 of patients with SSc, respectively. The peripheral blood perfusion (PBP) quantified by LASCA was significantly lower (p<0.0001) in SSc patients than in healthy controls and the ‘early’, ‘active’ and ‘late’ patterns from NFC showed a progressively decreasing trend of PBP (p=0.04).13 PA studies showed that the oxygenation levels were lower in patients with SSc compared with healthy volunteers or patients with primary RP.15 16 However, LASCA is highly sensitive to unwanted movement causing artefact or inaccuracy in flow measurements with a limited imaging depth of 0.2–1.0 mm.17–19 Additionally, the imaging depth of PA is limited to 2–3 cm depth from skin.20
The accuracy of ultrasound vascular imaging has improved with the development of high-frequency transducers (including frequencies >20 MHz).21 The qualitative evaluation of power Doppler imaging (PDI) in SSc demonstrated a correct classification of 88.9% between the healthy controls, primary RPs and secondary RPs with cold water stimulation.22 The peak systolic velocity and distal resistive index obtained from digital arteries and nail fold area using spectral Doppler imaging differentiated the patients with SSc from healthy controls.23
New ultrasound microvascular imaging techniques such as Superb Microvascular Imaging (SMI; Canon Medical Systems) and Microvascular Imaging (MVI; GE Healthcare) have been used to evaluate the finger microvasculature in patients with SSc and healthy controls.24 25 These microvascular techniques enhance the presentation of low-velocity blood flow signals from very small vessels by separating them from tissue motion artefacts, while conventional Doppler imaging removes clutter by suppressing low-velocity signals.24–27 Flower et al used colour-coded SMI (cSMI) to measure the vascularity indices (VIs: the percentage of colour pixels to total pixels in the region of interest) at three regions of interest (dorsovolar, nailfold and fingertip) and found the VIs from all three regions were significantly reduced in SSc compared with healthy controls.24 However, no significant differences were detected between the NFC scleroderma patterns.24 Very recently, Rademacher et al evaluated the feasibility of using MVI in the assessment of blood flow velocity in patients with SSc.25 In that study, the peak systolic and end-diastolic velocities obtained from fingertips were significantly higher in controls than in SSc patients (p<0.05).25
Ultrasound vascular imaging has advantages of easy applicability on the body and deeper penetration depth compared with the optic-based imaging techniques. Although previous studies showed potential to use ultrasound Doppler imaging or new microvascular imaging to assess finger vascularity of SSc patients, the diagnostic performance between different vascular imaging techniques or between the dorsal (nailfold area) and ventral (fingertip area) of fingers was not compared. The objective of this pilot study was (1) to detect and quantify finger vascularity of SSc patients with RP (RP-SSc) at the dorsal and ventral sides using ultrasound Doppler and microvascular imaging techniques and (2) to compare the diagnostic performance of quantified finger vascularity between the imaging techniques and locations (ie, dorsal and ventral sides).
Methods
Patient and public involvement
Patients and/or the public were not involved in the design, or conduct, or reporting, or dissemination plans of this research.
Subjects
This prospective study enrolled consecutive patients diagnosed with RP-SSc and healthy volunteers between May 2021 and February 2022. RP-SSc patients fulfilled the 2013 ACR/EULAR classification criteria28 and presented with RP. Age-matched and sex-matched healthy volunteers were also enrolled.
Nailfold capillaroscopy
Participating RP-SSc patients had NFC performed by videocapillaroscopy in all fingers except thumbs at room temperature following the recently proposed standards and prior to our ultrasound study (performed on the same day).6 The NFC evaluation was performed by a single rheumatologist (FM, with 13 years of experience in NFC) at the Scleroderma Centre of our institutional hospital.
Ultrasound imaging
All subjects were acclimated to room temperature first and all fingers except thumbs were imaged in the seated position by a single sonographer (CEW, with 10 years of experience). The blood flow of each finger was evaluated on the dorsal (showing nail) and ventral (showing palm) sides using an i24LX8 probe (bandwidth of 9–24 MHz) on an Aplio i800 system (Canon Medical Systems USA, Tustin, California, USA). Blood flow images were obtained using colour Doppler imaging (CDI) and PDI as well as using colour-coded and monochrome SMI (cSMI and mSMI).21 29 The imaging settings for each technique such as colour map, gain, postprocessing filter, focus, and frequency were kept the same for all subjects.
Quantification of finger vascularity
The percent area of vascularity was quantified offline by counting pixels of blood flow in a 25 mm2 square centred at the nail fold for the dorsal side and in 25 mm2 (to match the dorsal side analysis) and 100 mm2 squares from the fingertip for the ventral side (see figure 1) using Matlab (R2022a, MathWorks, Natick, Massachusetts, USA). The mean vascular signal intensity was calculated by dividing the sum of blood flow intensities by the sum of blood flow pixels in the corresponding areas for the dorsal and ventral sides. The percent vascular areas and mean vascular intensities from dorsal and ventral sides were averaged over all eight fingers.
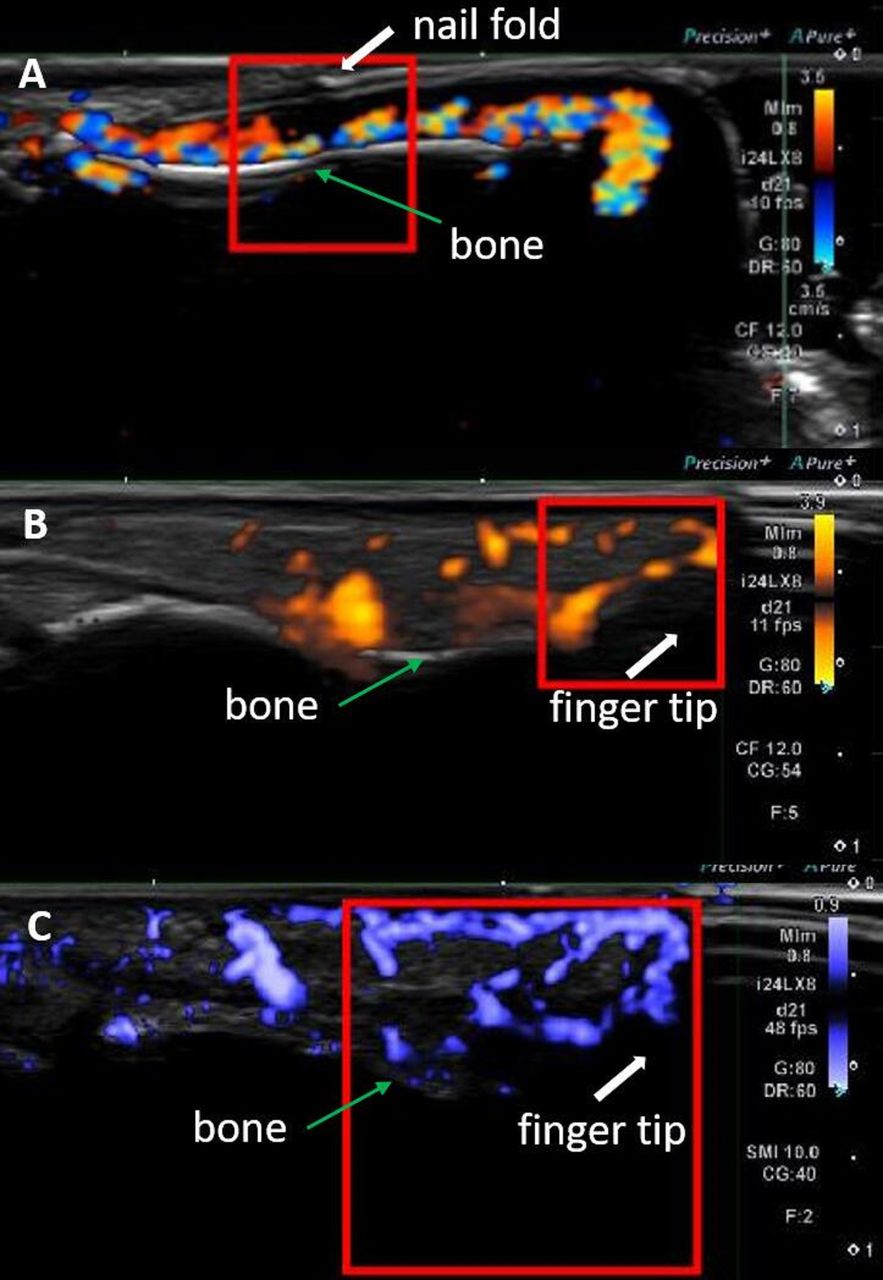
Examples of finger vascularity quantification for (A) colour Doppler imaging from the dorsal side with a 25 mm2 quantification box, (B) power Doppler imaging from the ventral side with a 25 mm2 quantification box and (C) colour-coded superb microvascular imaging from the ventral side with a 100 mm2 quantification box.
Statistical analysis
Statistical analyses were performed using Matlab with Statistics and Machine Learning Toolbox. Student’s t-tests and receiver operating characteristic (ROC) curve analyses were performed to differentiate RP-SSc patients with a history of digital ulcers from those without one as well as to differentiate RP-SSc patients from controls. A generalised linear regression was used to combine the study values for the ROC curve analyses. The diagnostic cut-off point was determined as the maximum Youden’s index.30 The significance level for all statistical tests was set to 0.05.
Results
Twenty RP-SSc patients were enrolled in the study. Due to technical errors, two patients’ data were excluded and 18 RP-SSc patients (15 women and 3 men, mean age 57±16 years old) were included for the analysis. Accordingly, 18 age-matched and sex-matched controls (15 women and 3 men, mean age 50±11 years old) were enrolled. Seventeen out of 18 RP-SSc patients were taking vasoactive drugs (including calcium channel blockers and phosphodiesterase inhibitors) and 1 RP-SSc patient was an active smoker. None of the controls was taking vasoactive drug and one of the controls was using nicotine.
Thirteen patients (72%) display the limited cutaneous SSc phenotype, whereas five patients had diffuse cutaneous SSc.31 The disease duration was 17±12 years (mean±SD) and 10 patients had a history of digital ulcers. Seventeen out of 18 RP-SSc patients underwent NFC and the results showed 2 normal, 7 early, 3 late and 5 abnormal or non-specific patterns (see table 1)
Characteristics of the RP-SSc patients
The percent vascular areas from the 100 mm2 ventral side were significantly lower in RP-SSc patients with history of digital ulcers than in those without regardless of imaging technique (see, table 2; p=0.02–0.05), while the dorsal side results from any imaging technique showed no differences (p≥0.19). The area under the curve (AUC) to identify RP-SSc patients with a history of digital ulcers were 0.75–0.76 with 50%–75% specificity and 80%–100% sensitivity based on the percent vascular areas from the ventral side. Furthermore, mean vascular intensities showed a significant difference between the RP-SSc patients with and without a history of digital ulcers as well at the 100 mm2 ventral side from CDI and PDI (both p=0.03). The AUCs were 0.75 and 0.76, respectively, with the same 63% specificity and 90% sensitivity.
The percent area of vascularity from various ultrasound techniques (mean±SD; unit: %) and their diagnostic performance in detecting the RP-SSc patients with history of digital ulcers
In differentiating RP-SSc from controls, the percent vascular areas and mean vascular intensities in RP-SSc were significantly lower than those in controls except for the mSMI dorsal side result (see, figures 2 and 3, tables 3 and 4). The mean vascular intensities showed slightly higher diagnostic accuracy than the percent vascular areas (AUC 0.80–0.91 vs 0.77–0.90) regardless of imaging technique and assessment side. For each imaging technique, the ventral side vascularity showed significantly higher diagnostic accuracy (AUC 0.75–0.90 and 0.77–0.91 for 25 mm2 and 100 mm2, respectively) compared with the dorsal side (AUC 0.53–0.81; p=0.01 for both 25 mm2 and 100 mm2). Among the vascular imaging techniques, CDI showed the highest diagnostic accuracy. The percent vascular areas from CDI at the 100 mm2 ventral side achieved an AUC of 0.90 with 89% specificity and 78% sensitivity. In combining values using a generalised linear regression, the percent vascular areas from CDI and PDI (AUC of 0.84 with 100% specificity and 56% sensitivity) at the 100 mm2 ventral side showed the highest diagnostic value with the AUC, specificity and sensitivity improved to 0.95, 94% and 94%, respectively (see, figure 4A). Combining the per cent vascular areas from CDI and cSMI (AUC of 0.87 with 100% specificity and 72% sensitivity) at the 100 mm2 ventral side showed the AUC, specificity and sensitivity of 0.90, 89% and 83%, respectively. Similarly, the mean vascular intensities from CDI at the 100 mm2 ventral side achieved an AUC of 0.91 with 89% specificity and 83% sensitivity. By combining the mean vascular intensities from CDI and PDI (AUC of 0.84 with 100% specificity and 56% sensitivity) at the 100 mm2 ventral side, the AUC, specificity and sensitivity improved to 0.94, 83% and 94%, respectively (see, figure 4B). The combination of the mean vascular intensities from CDI and cSMI (AUC of 0.88 with 100% specificity and 72% sensitivity) at the 100 mm2 ventral side showed the AUC of 0.90 with the 89% specificity and 83% sensitivity. However, combining the percent vascular areas and mean vascular intensities did not improve the AUC further.

Example images obtained from an RP-SSc patient. Left and right columns are from the dorsal side and ventral side, respectively. (A, B) colour-Doppler imaging, (C, D): power-Doppler imaging, (E, F) colour-coded superb microvascular imaging, (G, H) monochrome superb microvascular imaging. RP, Raynaud’s phenomenon; SSc, systemic sclerosis.

Example images obtained from a control. Left and right columns are from the dorsal side and ventral side, respectively. (A, B) Colour-Doppler imaging, (C, D) power-Doppler imaging, (E, F) colour-coded superb microvascular imaging, (G, H) Monochrome superb microvascular imaging.

Receiver operating characteristic curves of (A) per cent vascular area and (B) mean vascular intensity in differentiating the RP-SSc patients from controls. The area under the curves of combined per cent vascular area and mean vascular intensity using colour Doppler imaging (CDI) and power Doppler imaging (PDI) results from the 100 mm2 ventral side were 0.95 and 0.94, respectively.
The percent area of vascularity from various ultrasound techniques (mean±SD, unit:%) and their diagnostic performance in detecting the RP-SSc patients
The mean vascular intensities from various ultrasound techniques (mean±SD, unit: arbitrary unit) and their diagnostic performance in detecting the RP-SSc patients
Discussion
Vasculopathy is a key early feature of SSc that persist through the disease progression affecting large and small vessels.32 33 In addition, the abnormalities of vascular structure and function in SSc are interdependent.32 While NFC is the clinical standard of care for the digital vascular assessment in SSc, this study demonstrated potential use of ultrasound vascular imaging to assess and quantify the vasculopathy of RP-SSc. The percent vascular area and mean vascular intensity in a fixed assessment box were suggested as quantitative markers, which are affected by avascularity, ischaemia and flow velocity. Even though nearly all RP-SSc patients were taking vasoactive drugs, the markers could differentiate them from the controls who were not taking any vasoactive drug.
The exploration of the ventral side was motivated by the fact that main finger vessels run closer to the ventral side. Interestingly, the results from the ventral side showed a better diagnostic performance than the dorsal side and the differentiation of RP-SSc patients with a history of digital ulcers was only possible with the ventral side measurements. No significant scars or calcinosis impeding proper imaging and quantification were appreciated.
The mean vascular intensities showed a little higher diagnostic accuracy than the percent vascular area in differentiating RP-SSc from controls. The percent vascular area is not affected by the flow velocity or flow intensity, though it can be affected by the detection sensitivity of each imaging technique. In contrast, the mean vascular intensity is affected by flow velocity or flow intensity as well as the detected flow area.
Ultrasound vascular imaging techniques have been used to assess the digital vasculopathy in SSc.29 34–36 However, this study demonstrated a standardised quantification of blood flow signals using a uniform size of the region of interest for comparing various imaging techniques. Although this pilot study did not investigate the reproducibility of the technique including intraobserver and interobserver variability, our results encourage to establish a standardised ultrasound assessment for SSc. Comparing ultrasound vascular imaging techniques, conventional CDI showed a marginally better diagnostic accuracy than a new microvascular imaging technique cSMI, though they were comparable (AUC 0.90–0.91 vs 0.87–0.88). This could be explained by the fact that SMIs can be more easily affected by minimal movements such as breathing or finger motion during the procedure (ie, low-velocity motion) compared with CDI and PDI. Additionally, mSMI showed the lowest sensitivity for flow detection.
Since this was a pilot study with a small sample size focusing on the diagnostic value of quantified vascular ultrasound signals in detecting the RP-SSc patients, there were limitations. Whereas the RP-SSc patients were enrolled consecutively, their NFC patterns showed an unusual distribution (no patient displayed an active pattern and two had a normal pattern). Thus, the comparison between the NFC patterns and ultrasound results were omitted. Also, the lack of quantitative measurement of capillary density (capillaries/mm) or the capillaroscopic skin ulcer risk index did not allow further comparison for this study.37 38
Although the ventral side results from 25 mm2 (the same size used for the dorsal side) showed higher diagnostic value than the dorsal side results, the use of a bigger quantification box (100 mm2) improved its diagnostic performance. In the future, the optimum size and shape of quantification box will be investigated. Also, with expanded study population, the proposed finger vascularity quantified using ultrasound vascular imaging (ie, percent vascular area and mean vascular intensity) will be further validated and assessed for the differentiation between primary RP and secondary RP.
This study’s results encourage further exploration of quantitative digital vascularity to complement current clinical tools such as NFC in supporting the diagnosis of SSc and other autoimmune rheumatic diseases as well as the evaluation of a potential outcome from interventions such as the vasodilators and drugs aimed to improve SSc microangiopathy.
Data availability statement
Data are available on reasonable request. Quantified ultrasound data may be available on reasonable request but patients’ data are not available to the public.
Ethics statements
Patient consent for publication
Ethics approval
This study involves human participants and was approved by Thomas Jefferson University IRB with the IRB control number: 16D.016. Participants gave informed consent to participate in the study before taking part.
Acknowledgments
The part of this study was presented at 2022 European congress of rheumatology (POS0127 Quantitative assessment of finger vascularity in systemic sclerosis patients with Raynaud’s phenomenon using ultrasound vascular imaging. Annals of the Rheumatic Diseases, 81; Suppl 1:289, 2022).
References
Footnotes
Contributors KN is repsonsible for the overall content as a guarantor and takes responsibility for the intergrity of the data and the accuracy of the data analysis. KN, FM and FF contributed to the study design, data collection and data analysis; CEW and TCA contributed to the data collection and data analysis. KN drafted the manuscript and all authors contributed to the development and completion of the manuscript.
Funding Canon Medical Systems, USA provided partial funding for this study. However, the authors had a sole control of data and this manuscript.
Competing interests CEW is a consultant of Bracco Diagnostics and a speaker bureau of Canon Medical Systems, USA. Canon Medical Systems, USA provided equipment support.
Provenance and peer review Not commissioned; externally peer reviewed.