Article Text

Abstract
Objectives To assess construct validity of the CT Syndesmophyte Score (CTSS) for the measurement of structural spinal damage in patients with radiographic axial spondyloarthritis.
Methods Low-dose CT and conventional radiography (CR) were performed at baseline and 2 years. CT was assessed with CTSS by two readers and CR with modified Stoke Ankylosing Spondylitis Spinal Score (mSASSS) by three readers. Two hypotheses were tested: (1) syndesmophytes scored with CTSS are also detected with mSASSS at baseline or 2 years later; (2) CTSS is non-inferior to mSASSS in correlations with spinal mobility measures. Presence of a syndesmophyte was determined per reader per corner for all anterior cervical and lumbar corners on CT at baseline and CR at baseline and 2 years. Correlations of CTSS and mSASSS with six spinal/hip mobility measurements plus Bath Ankylosing Spondylitis Metrology Index (BASMI) were tested.
Results Data from 48 patients (85% male, 85% HLA-B27+, mean age 48 years) were available for hypothesis 1 and 41/48 were available for hypothesis 2. At baseline, syndesmophytes were scored with CTSS in 348 (reader 1, 38%) and 327 (reader 2, 36%) corners out of 917. Of these, depending on reader pairs, 62%–79% were also seen on CR at baseline or after 2 years. CTSS correlated well (rs0.46–0.73), and with higher correlation coefficients than mSASSS (rs0.34–0.64), with all spinal mobility measures and BASMI.
Conclusions The good agreement between syndesmophytes detected by CTSS and mSASSS and the strong correlation of CTSS with spinal mobility support the construct validity of the CTSS.
- Spondylitis, Ankylosing
- Epidemiology
- Low Back Pain
Data availability statement
Data are available on reasonable request. The data underlying this article will be shared on reasonable request to the corresponding author.
This is an open access article distributed in accordance with the Creative Commons Attribution Non Commercial (CC BY-NC 4.0) license, which permits others to distribute, remix, adapt, build upon this work non-commercially, and license their derivative works on different terms, provided the original work is properly cited, appropriate credit is given, any changes made indicated, and the use is non-commercial. See: http://creativecommons.org/licenses/by-nc/4.0/.
Statistics from Altmetric.com
WHAT IS ALREADY KNOWN ON THIS TOPIC
Low-dose CT is an upcoming imaging modality to assess syndesmophyte presence and progression in the whole spine.
WHAT THIS STUDY ADDS
The CT Syndesmophyte Score (CTSS) correlates well with measures of spinal mobility, better than radiographs assessed with modified Stoke Ankylosing Spondylitis Spinal Score (mSASSS).
Detection of syndesmophytes with the CTSS correlates well with detection on the mSASSS.
The CTSS is a valid measure to detect syndesmophytes in patients with radiographic axial spondyloarthritis.
HOW THIS STUDY MIGHT AFFECT RESEARCH, PRACTICE OR POLICY
The CTSS can contribute to more sensitive detection of syndesmophytes in studies.
Introduction
Axial spondyloarthritis (axSpA) is a chronic inflammatory disease, with predominant involvement of the spine. Common symptoms include chronic back pain and spinal stiffness.1 Sustained disease activity can lead to structural spinal damage which in turn can lead to decreased spinal mobility and poor functioning.2 This suggests that it is important to keep disease activity as low as possible to prevent structural damage progression.3–6 In axSpA, the most well-known type of structural spinal damage is the syndesmophyte. Syndesmophytes are osseous spikes on the vertebral rim which grow in the direction of the adjacent vertebra and, when reaching this, cause ankylosis.7 For studies on prevention of structural spinal damage and for the monitoring of spinal damage in the individual patient, proper imaging methods are important. The modified Stoke Ankylosing Spondylitis Spinal Score (mSASSS) has been deemed the most appropriate scoring method for the evaluation of radiographic progression on conventional radiography (CR).8–10 The mSASSS is well validated, and its relative low costs and wide availability make it a feasible measure.11 Unfortunately, however, the mSASSS does not assess the thoracic spine which is where most syndesmophytes occur.12 As an alternative imaging technique which allows assessment of structural damage in all spinal segments, CT has been investigated. While CT can provide clear images of all vertebrae and posterior elements, it comes at the cost of an increased ionising radiation dose. Low-dose CT (LDCT) has subsequently been used to combine the strengths of CT (visibility of the whole spine) and CR (acceptable radiation doses).
The CT Syndesmophyte Score (CTSS) was developed for the assessment of syndesmophytes on LDCT images.13 Previous studies reported good inter-reader reliability and sensitivity to change of the CTSS, namely detecting more syndesmophyte progression than mSASSS.13 14 Since the use of the CTSS in studies is relatively recent, its psychometric properties have not been extensively studied and need to be better understood before the CTSS can be considered a fully validated scoring method.
Construct validity is an important aspect of the truth pillar in the Outcome Measures in Rheumatology (OMERACT) filter15 and essential to the overall validity of a test. Construct validity assesses the degree to which the scores of an instrument relate to other measures according to a priori defined hypotheses.15 The CTSS is designed to assess the presence and size of syndesmophytes. A first question is whether the CTSS truly measures syndesmophytes or whether another lesion, such as a degenerative osteophyte, or normal anatomy is mistaken for a syndesmophyte. Therefore, it is hypothesised that (1) a vertebral corner which is deemed to have a syndesmophyte according to the CTSS, also has a syndesmophyte according to the mSASSS at the same time point or 2 years later. The latter component is added because it is plausible that the CTSS detects syndesmophytes earlier than the mSASSS. This is because LDCT allows for better visibility within the vertebra through its multiple slices, and the CTSS, contrary to the mSASSS, is designed to also detect small syndesmophytes. Second, the mSASSS is known to correlate with spinal mobility.11 16 Because the CTSS is assumed to measure the construct of spinal damage, just like the mSASSS, the CTSS should also correlate with spinal mobility. Hence as the second part to assess construct validity we hypothesise that (2) the CTSS is non-inferior to the mSASSS in correlations with spinal mobility measures.
Methods
Data from the Sensitive Imaging in Ankylosing Spondylitis (SIAS) cohort were used, which assessed patients from Leiden (the Netherlands) and Herne (Germany) at baseline and 2-year follow-up with LDCT and CR. Patients had a clinical diagnosis of axSpA, fulfilled the modified New York criteria, had 1–18 syndesmophytes assessed on CR and at least one inflammatory spinal lesion on MRI.13
Image acquisition and scoring
LDCT images were obtained on a 64-section CT scanner (at Leiden: Aquilion 64, Toshiba Medical Systems, Otawara, Japan) or a 16-section CT scanner (at Herne: Somatom Emotion 16, Siemens, Erlangen, Germany). Spiral CT scans were performed with 60 mAs at 120 kVp and a pitch of 53/64 using AEC with 30 SD/60 reference mAs. Images were assessed independently by two centrally trained readers. Time points were paired and blinded for time order. The CTSS assesses four vertebral quadrants (further referred to as ‘corners’) per vertebral unit from the bottom half of C2 to the top half of S1 on two planes (n=184).13 A vertebral unit is the bottom half of a vertebra, the top half of the vertebra underneath and the vertebral disc space (IDS) in between. Anterior and posterior corners are assessed on the sagittal plane; left and right corners on the coronal plane. Scores are given on a range 0–3: 0, normal; 1, syndesmophyte reaching <50% of the IDS; 2, syndesmophyte reaching ≥50% of the IDS and 3, bridging syndesmophyte. Thus, the range of the CTSS is 0–552.
CR images were plain lateral radiographs of the cervical and lumbar spine. Images were assessed independently by three centrally trained readers. Time points were paired together and blinded for time order. The mSASSS assesses 12 anterior cervical and 12 anterior lumbar vertebral corners on a range 0–3: 0, normal; 1, erosion, sclerosis or squaring; 2, syndesmophyte and 3, bridging syndesmophyte.8 Thus, the range of the mSASSS total score is 0–72.
Syndesmophyte presence on LDCT compared with CR: hypothesis 1
To test this hypothesis, analyses are performed on the vertebral corner level and per LDCT*CR reader pair (n=6). For direct comparison, only corners with scores for both LDCT and CR were included. Thus, apart from missing scores, 12 anterior cervical and 12 anterior lumbar corners per patient are used of the CTSS to match the corners assessed with mSASSS. Per corner, syndesmophytes are present (CTSS 1, 2 or 3; mSASSS 2 or 3) or not present (CTSS 0; mSASSS 0 or 1). Per reader pair, proportions are given of corners with a syndesmophyte according to the LDCT reader, which also have a syndesmophyte at the same time or 2 years later according to the CR reader. Syndesmophytes on CR do not have to be consistent over time, thus a syndesmophyte can be present on CR at baseline only, 2 years only or at both time points. Although inter-reader reliability is known to be good to excellent for both the CTSS and mSASSS, some degree of scoring error or unexplained variability is to be expected. This is especially so since the analyses were performed on a very small level (the corner level) across modalities.9 13 Hence, the hypothesis was accepted if for each reader pair the majority (>50%) of syndesmophytes seen on LDCT was also seen on CR. We furthermore separated the CR time points to assess whether the number of syndesmophytes that was seen on both LDCT and CR increased over time, as would be expected under the assumption that syndesmophytes that are visible on LDCT but not on CR can become visible later on. Thus, as a second condition for the hypothesis, the proportion of syndesmophytes seen on both LDCT and CR should be larger after 2 years. Furthermore, of the syndesmophytes seen on CR at baseline, we provide the proportions of syndesmophytes that were seen on LDCT at the same timepoint.
Correlations with spinal mobility: hypothesis 2
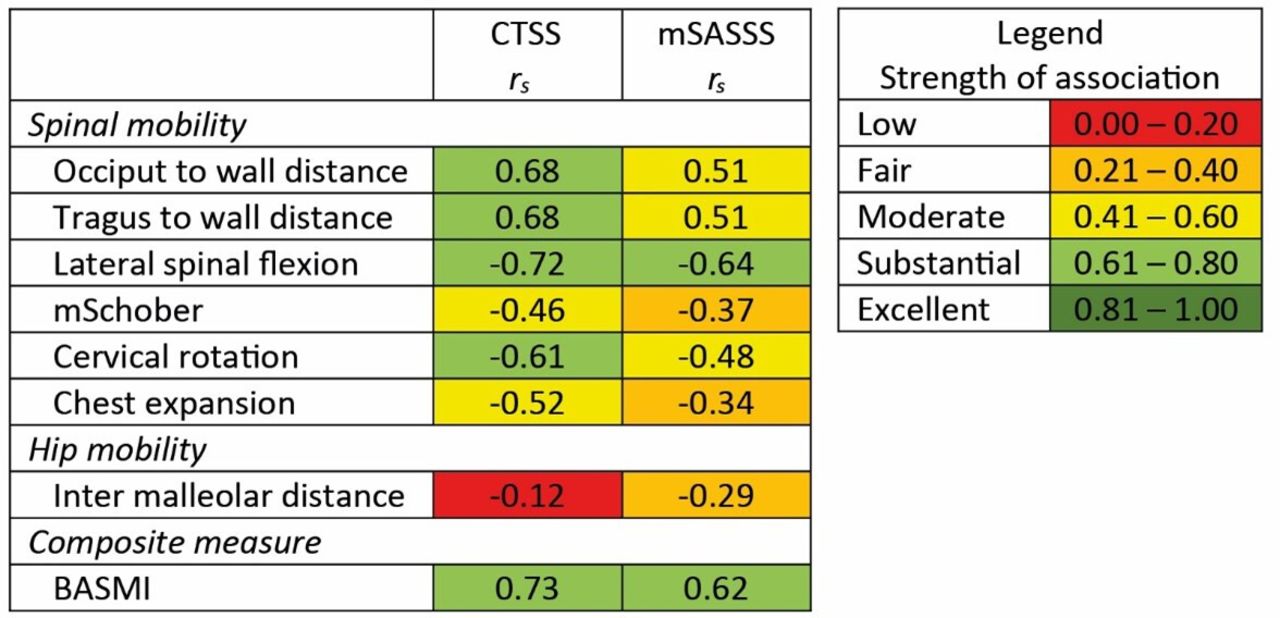
Spearman’s rank correlation coefficients were calculated for the CTSS and mSASSS in combination with each of seven mobility measures. Analyses were performed on the patient level. Cut-offs to categorise the strength of the Spearman’s correlations (low (0.0–0.2), fair (0.21–0.4), moderate (0.41–0.6), substantial (0.61–0.8), excellent (0.81–1.0)) were used as proposed by Castro et al.16 To visualise the data, cumulative probability plots are made per combination of a mobility measure with CTSS or mSASSS.
In the analyses on the correlation of the CTSS with spinal mobility, only data from one timepoint is used (baseline). However, for both the CTSS and mSASSS only patients were included that had both a baseline and 2 years assessment, due to the method used to calculate the scores.13 17 The CTSS and mSASSS are patient-level scores, thus, there is one CTSS and one mSASSS agreement score of the readers per patient. All corners assessable for CTSS (184) and mSASSS (24) are used to calculate the total scores for structural damage.
A total of five spinal mobility measures, one hip flexibility measure and one composite measure is used: occiput to wall distance (OWD), lateral spinal flexion (LSF), modified Schober (mSchober), cervical rotation, chest expansion, intermalleolar distance (IMD) and the Bath Ankylosing Spondylitis Metrology Index (BASMI). Measurements were performed according to the ASAS handbook.18 The BASMI is a composite score consisting of the LSF, mSchober, cervical rotation, IMD and tragus to wall distance (TWD). The TWD was calculated by adding 11.1 to the OWD according to a previously described method.19 The TWD was needed to calculate the BASMI but was not otherwise used in analyses since it would yield the same correlations as the OWD. The CTSS is hypothesised to have at least moderate correlations with all spinal mobility measures and the BASMI, and that these are non-inferior to the mSASSS. The IMD measures hip flexibility and is therefore expected not to correlate with the CTSS and mSASSS.
Results
Syndesmophyte presence on LDCT compared with CR: hypothesis 1
A total of 48 patients were included, contributing a total of 917 vertebral corners with scores at baseline for all LDCT and CR readers and at 2 years for all CR readers. Patients with radiographic axial spondyloarthritis were predominantly male (85%) and HLA-B27+ (85%) and had a mean age of 48 years (SD 9.8) (online supplemental table 1).
Supplemental material
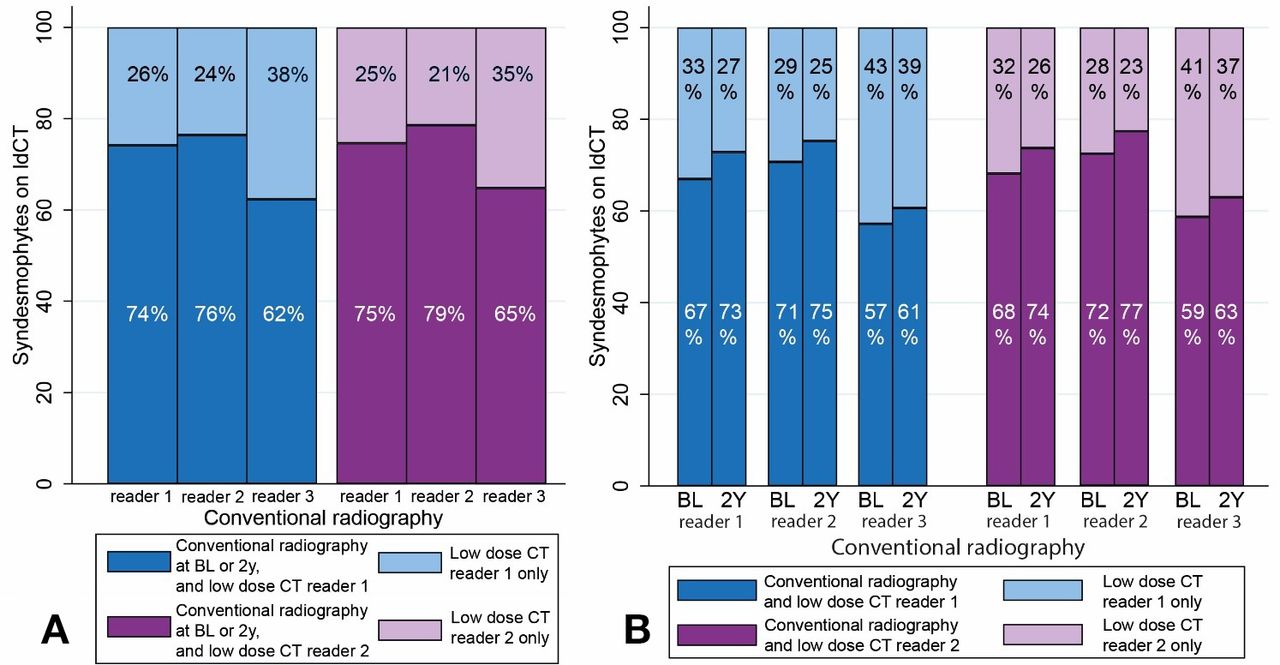
Baseline syndesmophytes on LDCT were seen in 348/917 (38%, reader 1) and 327/917 (36%, reader 2) anterior cervical and lumbar corners. In corners that had a syndesmophyte on LDCT at baseline, of all six reader pairs, the percentages of corners that also had a syndesmophyte on CR at the same time or 2 years later ranged from 62% to 79% (figure 1A). For both LDCT readers 65% of the syndesmophytes occurred in the lumbar spine. Agreements were 67%–83% for the cervical spine compared with 60%–76% for the lumbar spine. Figure 1B considers both CR timepoints separately. Of the 348 and 327 corners with a syndesmophyte on LDCT, 57%–72% has a syndesmophyte on CR as well at the same time, and 61%–77% has a syndesmophyte on CR 2 years later. These achieved agreements are well above the preset threshold of 50%. For all reader pairs, there was an increase in the proportion of corners with syndesmophytes on both imaging modalities over time. Percentages for the 2-year time point alone are slightly lower than for the timepoints combined due to corners that had a syndesmophyte at baseline only on CR but not at 2 years. This can be considered a scoring error because syndesmophytes are not expected to resolve over time. When looking at agreement on syndesmophytes the other way around, we see that of the corners with syndesmophytes on CR at baseline, 86%–95% (range of 6 reader pairs) had a syndesmophyte on LDCT as well.

Proportions of corners with syndesmophytes on LDCT and conventional radiography at baseline and 2 years combined (A) and baseline and 2 years separately (B). Per reader pair, proportions are given of anterior cervical and lumbar corners with a syndesmophyte according to the low dose CT reader, that also have a syndesmophyte at the same time or 2 years later according to the CR reader. These two timepoints are combined in graph (A), and shown separately in graph (B). BL, baseline; CR, conventional radiography; LDCT, low-dose CT.
Correlations with spinal mobility: hypothesis 2
A total of 41/48 patients had scores for CTSS, mSASSS and all mobility measures, and were included in the analyses. Descriptive statistics of the CTSS, mSASSS and all mobility measures are presented in online supplemental table 2). The CTSS showed substantial correlations with the OWD (rs=0.68), LSF (rs=−0.72), cervical rotation (rs=−0.61) and BASMI (rs=0.73) and moderate correlations with the mSchober (rs=−0.46) and chest expansion (rs=−0.52) (figure 2). According to expectations, the CTSS did not correlate with hip flexibility (IMD, rs=−0.12). The mSASSS showed substantial correlations with LSF (rs=−0.64) and BASMI (rs=0.62), moderate correlations with OWD (rs=0.51) and cervical rotation (rs=−0.48) and fair correlations with mSchober (rs=−0.37) and chest expansion (rs=−0.34). The mSASSS also had a fair correlation with hip flexibility (IMD, rs=−0.29). All spinal mobility measures correlated stronger with the CTSS than with mSASSS. Cumulative probability plots visualise the associations between the mobility scores and the CTSS and mSASSS (online supplemental figure S1).
Spearman’s correlations between CTSS, mSASSS and spinal mobility measures. The figure presents Spearman’s rank correlation coefficients for the CTSS and mSASSS for each of the seven mobility measures. All corners assessable for CTSS (184) and mSASSS (24) are used to calculate the total scores for structural damage. Higher rs values, either positive or negative, show a higher strength of the association. cutoffs were derived from Castro et al.16 BASMI, Bath Ankylosing Spondylitis Metrology Index; CTSS, CT Syndesmophyte Score; mSASSS, modified Stoke Ankylosing Spondylitis Spinal Score; mSchober, modified Schober test; rs,Spearman’s r.
Discussion
In the current study, we assessed the construct validity of the CTSS. The CTSS assesses syndesmophyte presence and size on (LD)CT images in patients with r-axSpA. Construct validity assesses the degree to which a measure correlates to other measures according to a priori defined hypotheses.15 The mSASSS was used as a comparator in the current study because the CTSS is intended to measure the same construct, namely that of spinal damage, and the mSASSS is fully validated according to the OMERACT filter.9 10 17 20 21 Two hypotheses were tested in a population with established r-axSpA with existing structural spinal damage. We showed that most syndesmophytes that were detected by CTSS were also detected by mSASSS at the same time, and more became visible by mSASSS 2 years later. We further showed that the CTSS correlated at least moderately with all spinal mobility measures and the component mobility measure and that these correlations were non-inferior, and in fact stronger, than for mSASSS. These results confirm our hypothesis that the CTSS is correlated with the construct of spinal mobility.
For the agreement on syndesmophyte presence between the two modalities, only vertebral corners were included that could be assessed by both the CTSS and the mSASSS. This meant that for the CTSS, only 24 out of 184 corners that could be assessed were compared with syndesmophyte presence on mSASSS, which limits conclusions to the anterior cervical and lumbar corners. However, in these corners, we did see that the vast majority of the syndesmophytes that were seen with CTSS, were also seen with mSASSS. Furthermore, according to the second part of the hypothesis, the proportions of syndesmophytes that were also seen with mSASSS increased over time, corroborating the belief that syndesmophytes seen on LDCT might become visible only later on CR. Thus, apart from some degree of scoring error, syndesmophytes that were seen on LDCT but not on CR might still become visible on CR sometime later, that is, beyond the 2-year follow-up of this study. Studies with longer follow-up may address whether this is the case. With these results our hypothesis is confirmed, suggesting that lesions that are scored as syndesmophytes with CTSS are indeed syndesmophytes as confirmed by the method that is currently used as the gold standard.
For the correlations with spinal mobility measures, according to expectations, the CTSS showed strong associations with all spinal mobility measures and did not correlate with hip flexibility. Both the CTSS and mSASSS correlated strongest with the LSF and BASMI. From literature, these measures are also shown to discriminate best between patients with and without structural spinal damage.6 It is of note that the correlation of the CTSS with OWD was quite strong . Furthermore, this correlation was numerically higher compared with the correlation of the mSASSS with the OWD. This is in line with expectations since the OWD is a valid and reliable tool to assess thoracic kyphosis.22 Since the thoracic spine is included in the CTSS but not in the mSASSS, it makes sense that the CTSS correlates better with OWD and this only corroborates that the CTSS measures spinal damage and is related to the construct of spinal mobility.
Concluding, we studied the construct validity of the CTSS and found evidence supporting this, adding to the validation of the CTSS. Previously the CTSS was found to have excellent inter-reader reliability.13 Furthermore, to assess longitudinal validity, a 2-year assessment of the CTSS in comparison with the mSASSS reported data on the responsiveness of the CTSS and concluded that the CTSS showed more progression than the mSASSS.14 Thus, these studies together show that the CTSS is an instrument that can reliably measure structural spinal damage and progression thereof, and that it is a valid measure that indeed assesses the construct of structural spinal damage.
Data availability statement
Data are available on reasonable request. The data underlying this article will be shared on reasonable request to the corresponding author.
Ethics statements
Patient consent for publication
Ethics approval
The medical ethical committees from both centres approved the studies (Leiden: Medisch Ethische Toetsings Commissie, P10.021; Herne: Ethikkommission der Ruhr Universität Bochum, 4366-12) and all patients provided written informed consent. Participants gave informed consent to participate in the study before taking part.
References
Supplementary materials
Supplementary Data
This web only file has been produced by the BMJ Publishing Group from an electronic file supplied by the author(s) and has not been edited for content.
Footnotes
Contributors Study coordination: DvdH, FAvG, XB and JB. Data collection: RvdB, XB and JB. Radiology protocol preparation and excecution: MR. Preparation of database, manuscript draft, tables and figures: RS. Analyses excecution: RS. Analyses supervision and advising: SR, DvdH and FAvG. All authors contributed to the writing by reviewing and editing. Guarantor: RS.
Funding This work as supported by Reuma Nederland and Novartis
Competing interests DvdH: grant from Dutch Rheumatism Association, consulting fees from AbbVie, Gilead, Glaxo-Smith-Kline, Lilly, Novartis and UCB Pharma, Other interest as director of Imaging Rheumatology bv; FAvG: grants from Stichting vrienden van Sole Mio, Stichting ASAS, Jacobus stichting, Novartis and UCB, consulting fees from Novartis, MSD, AbbVie, Bristol Myers Squibb and Eli Lilly; MR: fees for ASAS CLASSIC study; SR: grants from AbbVie, Galapagos, MSD, Novartis, Pfizer and UCB, consulting fees from AbbVie, Eli-Lilly, MSD, Novartis, Pfizer, UCB and Sanofi, honoraria from Eli-Lilly, MSD, Novartis and UCB; JB, RS, RvdB and XB: nothing to declare.
Provenance and peer review Not commissioned; externally peer reviewed.
Supplemental material This content has been supplied by the author(s). It has not been vetted by BMJ Publishing Group Limited (BMJ) and may not have been peer-reviewed. Any opinions or recommendations discussed are solely those of the author(s) and are not endorsed by BMJ. BMJ disclaims all liability and responsibility arising from any reliance placed on the content. Where the content includes any translated material, BMJ does not warrant the accuracy and reliability of the translations (including but not limited to local regulations, clinical guidelines, terminology, drug names and drug dosages), and is not responsible for any error and/or omissions arising from translation and adaptation or otherwise.