


Abstract
Aims The role of uric acid (UA) in the process of atherosclerosis and atherotrombosis is controversial. Epidemiological studies have recently shown that UA may be a risk factor for cardiovascular diseases and a negative prognostic marker for mortality in subjects with pre-existing heart failure.
Methods and results We evaluate a relationship between UA levels and several inflammatory markers in 957 subjects, free of severe renal failure, from a representative Italian cohort of persons aged 65–95. Plasma levels of UA and white blood cell (WBC) and neutrophil count, C-reactive protein, interleukin-1 receptor antagonist (IL-1ra), interleukin-6 (IL-6), soluble IL-6 receptor (sIL-6r), interleukin-18 (IL-18), and tumor necrosis factor-α (TNF-α) were measured. Complete information on potential confounders was collected using standard methods. WBC (P=0.0001), neutrophils (P<0.0001), C-reactive protein (P<0.0001), IL-1ra (P<0.0001), IL-6 (P=0.0004), sIL-6r (P=0.002), IL-18 (P<0.0001), TNF-α (P=0.0008), and the percentage of subjects with abnormally high levels of C-reactive protein (P=0.004) and IL-6 (P=<0.0001) were significantly higher across UA quintiles. After adjustment for age, sex, behaviour- and disease-related confounders, results were virtually unchanged. In subjects with UA within the normal range, UA was significantly and independently associated with neutrophils count, C-reactive protein, IL-6, IL-1ra, IL-18, and TNF-α, whereas non-significant trends were observed for WBC (P=0.1) and sIL-6r (P=0.2).
Conclusion A positive and significant association between UA and several inflammatory markers was found in a large population-based sample of older persons and in a sub-sample of participants with normal UA. Accordingly, the prevalence of abnormally high levels of C-reactive protein and IL-6 increased significantly across UA quintiles.
Introduction
Uric acid (UA) is a product of the metabolism of purine nucleotides that are the principal constituents of cellular energy stores, such as ATP, and components of DNA and RNA. In most mammals, the liver enzyme uricase converts urate into allantoin, substantially reducing UA plasma levels. Interestingly, the human uricase gene is non-functional,1 resulting in serum UA levels that are both higher and more fluctuating in humans than in other mammals.2 Ames hypothesized that mutation of the uricase gene gave humans an evolutionary advantage over other primates due to the UA anti-oxidant properties.3 Researchers have suggested that the higher UA levels in subjects with cardiovascular diseases (CVD) might be a compensatory response designed to counteract excessive oxidative stress.4 This theory has a strong rationale in the biochemical characteristics of UA as anti-oxidant and is supported by pre-clinical studies performed in vitro and in experimental animals.5 However, the role of UA in humans is still uncertain. In fact, although it has been demonstrated that the infusion of UA reduces exercise-induced oxidative stress,6 it is not known whether persons with hypouricemia experience accelerating aging. In addition, although women have UA levels about 20% lower than men, their average life expectancy is about 7.5 greater.7
Although the notion that UA is a risk factor for poor health outcome in the general population8,9 is not universally acknowledged, a number of studies demonstrated that high UA is an independent risk factor for hypertension,10 diabetes,11,12 CVD, and mortality.13 Even after controlling for associated risk factors, high UA is an independent risk factor for cardiovascular events in patients affected by hypertension,10 diabetes,14 pre-existing cerebrovascular,15 and CVD.10,16 There is evidence that high UA is a negative prognostic factor in patients with mild-severe heart failure,17 although the development of hyperuricemia is almost always associated with worsening of renal failure in these patients.18 Therefore, it is difficult to dissect the roles played by reduced renal function and high UA in affecting prognosis of these patients. Some evidences suggest that UA may exert a negative effect on CVD by stimulating inflammation, which is clearly involved in the pathogenesis of CVD.19,20
A crude correlation between serum C-reactive protein and UA levels has been found in a German population-based survey,21 and a significant positive correlation between UA and inflammation was found in a small clinical series of heart failure patients.22,23 Studies have demonstrated that after cellular death or injury, the degradation of nucleotides into UA serves as an endogenous ‘danger signal’ for the maturation and immunostimulatory action of dendritic cells.24
In experimental studies, UA stimulates the release of chemokine monocyte chemoattractant protein-1,25 and interleukin-1β (IL-1β), interleukin-6 (IL-6), and tumor necrosis factor-α (TNF-α) synthesis.26 In spite of the evidence that UA might contribute to the development of human vascular disease and atherosclerosis through a pro-inflammatory pathway, the relationship between UA and inflammation has been little investigated. We explored a possible association between UA levels and markers of inflammation in a population-based sample of participants in the InCHIANTI study.
Methods
Study sample
The present analyses are based on data from the ‘Invecchiare in Chianti’ (aging in the Chianti area, InCHIANTI) study, an epidemiological study performed in two Italian towns located in the Chianti countryside. The Ethics Committee of the Italian National Institute of Research and care of Aging approved the study protocol. The data collection started in September 1998 and was completed in March 2000.
Using a multistage sampling method, 1453 subjects (age range 20–102; 91.6% of the eligible population) were enrolled in the InCHIANTI study from the two catchment areas.
From the overall samples, we selected 1155 subjects aged 65 and older. After exclusion of 113 subjects without blood UA determination and 85 subjects affected by severe renal failure (creatinine clearance ≤30 mL/min), the final sample used in our analyses consisted of 957 subjects.
Blood samples were collected in the morning after the participants had been fasting for at least 12 h and after sitting for 15 min. Aliquots of serum and plasma were immediately obtained and stored in a deep freezer at −80°C, and were subsequently used for the assessment of cytokines. A detailed description of the sampling procedure and data collection method has been previously published.27
Uric acid
UA (mg/dL) was measured using enzymatic–colorimetric methods (Roche Diagnostics, GmbH, Mannheim, Germany). The lower limits of detection were 0.2 mg/dL, range 0.2–25.0 mg/dL, intra-assay and inter-assay coefficients of variation were equal to 0.5 and 1.7%, respectively. Hyperuricemia was defined as a serum urate concentration >7.5 mg/dL (450 mcmol/L) in men and >6.2 mg/dL (372 mcmol/L) in women, in agreement with the normal value provided by our clinical laboratory.
Inflammatory markers
Serum levels of interleukin-1 (IL-1), interleukin-1 receptor antagonist (IL-1ra), IL-6, interleukin 6 receptor (sIL-6r), interleukin-10 (IL-10), and TNF-α were measured by enzyme linked immunosorbent assay (ELISA) using ultrasensitive commercial kits (Human Ultrasensitive, Biosource International Inc., Camarillo, CA, USA). Serum interleukin-18 (IL-18) was also measured by ELISA using a different commercial kit (Quantikine HS, R&D Systems, Minneapolis, MN, USA). We previously demonstrated that older persons with IL-6 plasma level >2.5 pg/mL are at high risk of mobility–disability.28
Serum levels of interleukin-12 (IL-12) and interleukin-8 (IL-8) were determined by multicytokine detection system (Bio-Rad, Hercules, CA, USA) using a Luminex System (Austin, TX, USA) and calculated using BIO-plex software (Bio-Rad).
Assays were done in duplicate for all cytokine measures (except IL-10) and were repeated if the second measure was >10% greater or smaller than the first. The average of the two measures was used in the analyses.
Serum C-reactive protein was measured by ELISA high sensitivity test using purified protein and polyclonal anti-C-reactive protein antibodies (Calbiochem, San Diego, CA, USA) with standardization according to the WHO first International Reference Standard. According to the American Heart Association recommendations, persons with C-reactive protein levels >3 mg/L were considered at high cardiovascular risk.29
Serum and urinary creatinine levels (mg/dL) were measured by kinetic colorimetric assay based on modified Jaffé method. Erythrocyte-sedimentation rate (ESR) was measured automatically using TEST1 FAST, Alifax-spa. Measurements were expressed in millimeters at the first hour. White blood cells (WBC), lymphocytes, and neutrophils were determined using automatic analyzer Coulter LH 750 (BECKMAN Coulter, Instrumentation Laboratory, Milano), and expressed in K/µL. Neutrophils were considered marker of inflammation for a count >7.0 K/µL.
Covariates
Pack-years, a measure of smoking exposure that combines intensity and duration, was calculated as (packs smoked per day) × (years of smoking) on the basis of self-report. On the basis of responses to multiple questions, physical activity in the previous year was rated as (a) sedentary: inactive or light-intensity physical activity (i.e. walking, light housework) <1 h per week; (b) light physical activity: light-intensity physical activity 2–4 h per week; (c) moderate-high physical activity: light physical activity >4 h per week or moderate physical activity (i.e. brisk walking, playing soccer, gardening) at least 1 to 2 h per week.
Plasma vitamin E (α-tocopherol) concentrations were measured by reverse-phase high performance liquid chromatography and the measure unit was expressed in mcmol/L.30
Average daily alcohol intake (<30 vs. 30 g per day), animal protein intake (g/day) and energy intake (Kcal/day) were asked by interviewers using the European Prospective Investigation into Cancer (EPIC) and Nutrition food frequency questionnaire.31 The information provided by the questionnaire was transformed into average daily intake of macro- and micronutrients by custom software that uses as a reference the table of food composition for Italian epidemiological studies edited by the European Institute of Oncology.32
Major chronic diseases were ascertained according to pre-established criteria that combined information from physician diagnosis, medical records, clinical examination, and blood tests.33 In the analysis presented here, CVD is defined as the occurrence of angina, or/and myocardial infarction, or/and congestive heart failure, whereas cerebrovascular disease includes stroke and/or transient ischaemic attack. Metabolic syndrome is defined according to the criteria from the National Cholesterol Education Program's Adult Treatment Panel III.34 Atherosclerosis was defined as bilateral carotid atherosclerotic plaques, and/or any carotid stenosis more severe than 40%, and/or presence of peripheral arterial disease. Carotid atherosclerosis plaques and stenosis were estimated by Doppler flow ultrasonography. Peripheral artery disease is defined as ankle–brachial index, ABI <0.90 using standardized measurement of the Winsor index.35 All participants underwent carotid ultrasound and ABI estimation at the initial evaluation.
Statistical analyses
Variables with symmetric distribution were reported as means and standard deviations (SD). Variables with asymmetric distribution were summarized as medians and interquartile ranges and were used log-transformed in regression analyses and back-transformed for data presentation. The significance level used for two-sided tests was P<0.05.
Differences in levels of inflammatory markers across UA quintiles were tested by age- and sex-adjusted linear regression models. Variables not significantly associated with UA in these exploratory analyses were not considered in further analyses. Difference in percentage of abnormal inflammatory markers across the UA quintiles was assesed using χ2 tests.
Inflammatory markers that were found significantly associated with UA were expressed as the number of SD from their means and plotted according to UA quintiles.
Differences in inflammatory markers between hyperuricemic and normal subjects were tested by the analysis of variance. General linear models were used to examine the association of UA levels with inflammatory markers independent of age, sex, and other covariates in the whole sample and in subjects with normal levels of UA.
We started the analysis by fitting age- and sex-adjusted models to the whole study population (model 1). Then, we fitted subsequent model adjusted for a progressively increasing number of potential confounders. The model 2 was adjusted for age, sex, serum creatinine, protein and total energy intake, alcohol intake, smoking, physical activity, and vitamin E. The following model was also adjusted for relevant clinical condition such as hypertension, cardiovascular and cerebrovascular diseases, diabetes, metabolic syndrome, cancer, atherosclerosis, chronic renal failure, arthritis, and use of diuretics. The final full adjusted model was also fitted in a subgroup of participants with normal UA levels (model 4). The linearity of the relationship between UA and inflammatory markers was explored by scatterplots and by looking at average inflammatory markers values according to UA quintiles. In addition, the assumption of constant variance was explored by residual plots. All analyses were performed using the SAS statistical package, version 8.2 (SAS Institute, Cary, NC, USA).
Results
The main demographic and clinical characteristics of the overall study population and according to sex are presented in Table 1. The mean serum UA in the overall population was 5.1±1.3 mg/dL. UA levels tended to be higher at older ages, although the age-trend was not statistically significant. The prevalence of hyperuricemia was 9.3% in the whole population, 12.0% of women and 8.0% of men, respectively (P<0.0001). The prevalence of hypertension, metabolic syndrome, cancer, and arthritis was higher in women than in men, whereas signs of carotid and peripheral atherosclerosis were more prevalent in men than in women.
Characteristics of the overall study population
| All subjects (n=957) | Women (n=520) | Men (n=437) | |
|---|---|---|---|
| Variables (mean±SD) | |||
| Age (years) | 74±7 | 75±7 | 74±6 |
| Uric acid (mg/dL) | 5.1±1.3 | 4.8±1.2 | 5.5±1.3 |
| Serum creatinine (mg/dL) | 0.9±0.2 | 0.8±0.1 | 1.0±0.2 |
| Behaviour related variables (mean±SD) | |||
| Protein intake (g/day) | 47.9±14.8 | 45.4±14.5 | 50.8±14.7 |
| Smoking (packs/year) | 13±21 | 3±9 | 25±25 |
| Energy intake (Kcal/day) | 1944±555 | 1742±473 | 2185±550 |
| Alcohol intake (g/day) | 7.6±4.2 | 7.1±10.3 | 24.36±25.1 |
| Physical activity (hours/week) | 3.3±0.9 | 3.0±0.9 | 3.5±1.0 |
| Vitamin E (µmol/L) | 30.2±8.4 | 31±4 | 28.8±8.0 |
| Conditions (n and %) | |||
| Hypertension | 634 (66.3) | 365 (70.5) | 269 (61.6) |
| Cardiovascular diseases | 271 (28.4) | 140 (27.0) | 131 (30.1) |
| Cerebrovascular diseases | 60 (6.4) | 26 (5.1) | 34 (7.9) |
| Diabetes | 152 (15.8) | 72 (13.9) | 80 (18.2) |
| Metabolic syndrome | 219 (23.0) | 150 (29.0) | 69 (15.9) |
| Cancer | 56 (5.9) | 38 (7.3) | 18 (4.1) |
| Atherosclerosis | 182 (20.8) | 79 (16.6) | 103 (25.8) |
| Chronic renal failure | 264 (27.6) | 186 (35.7) | 78 (17.9) |
| Knee and hip arthritis | 102 (10.7) | 78 (15.1) | 24 (5.5) |
| Use of diuretics | 89 (9.2) | 52 (9.9) | 37 (8.5) |
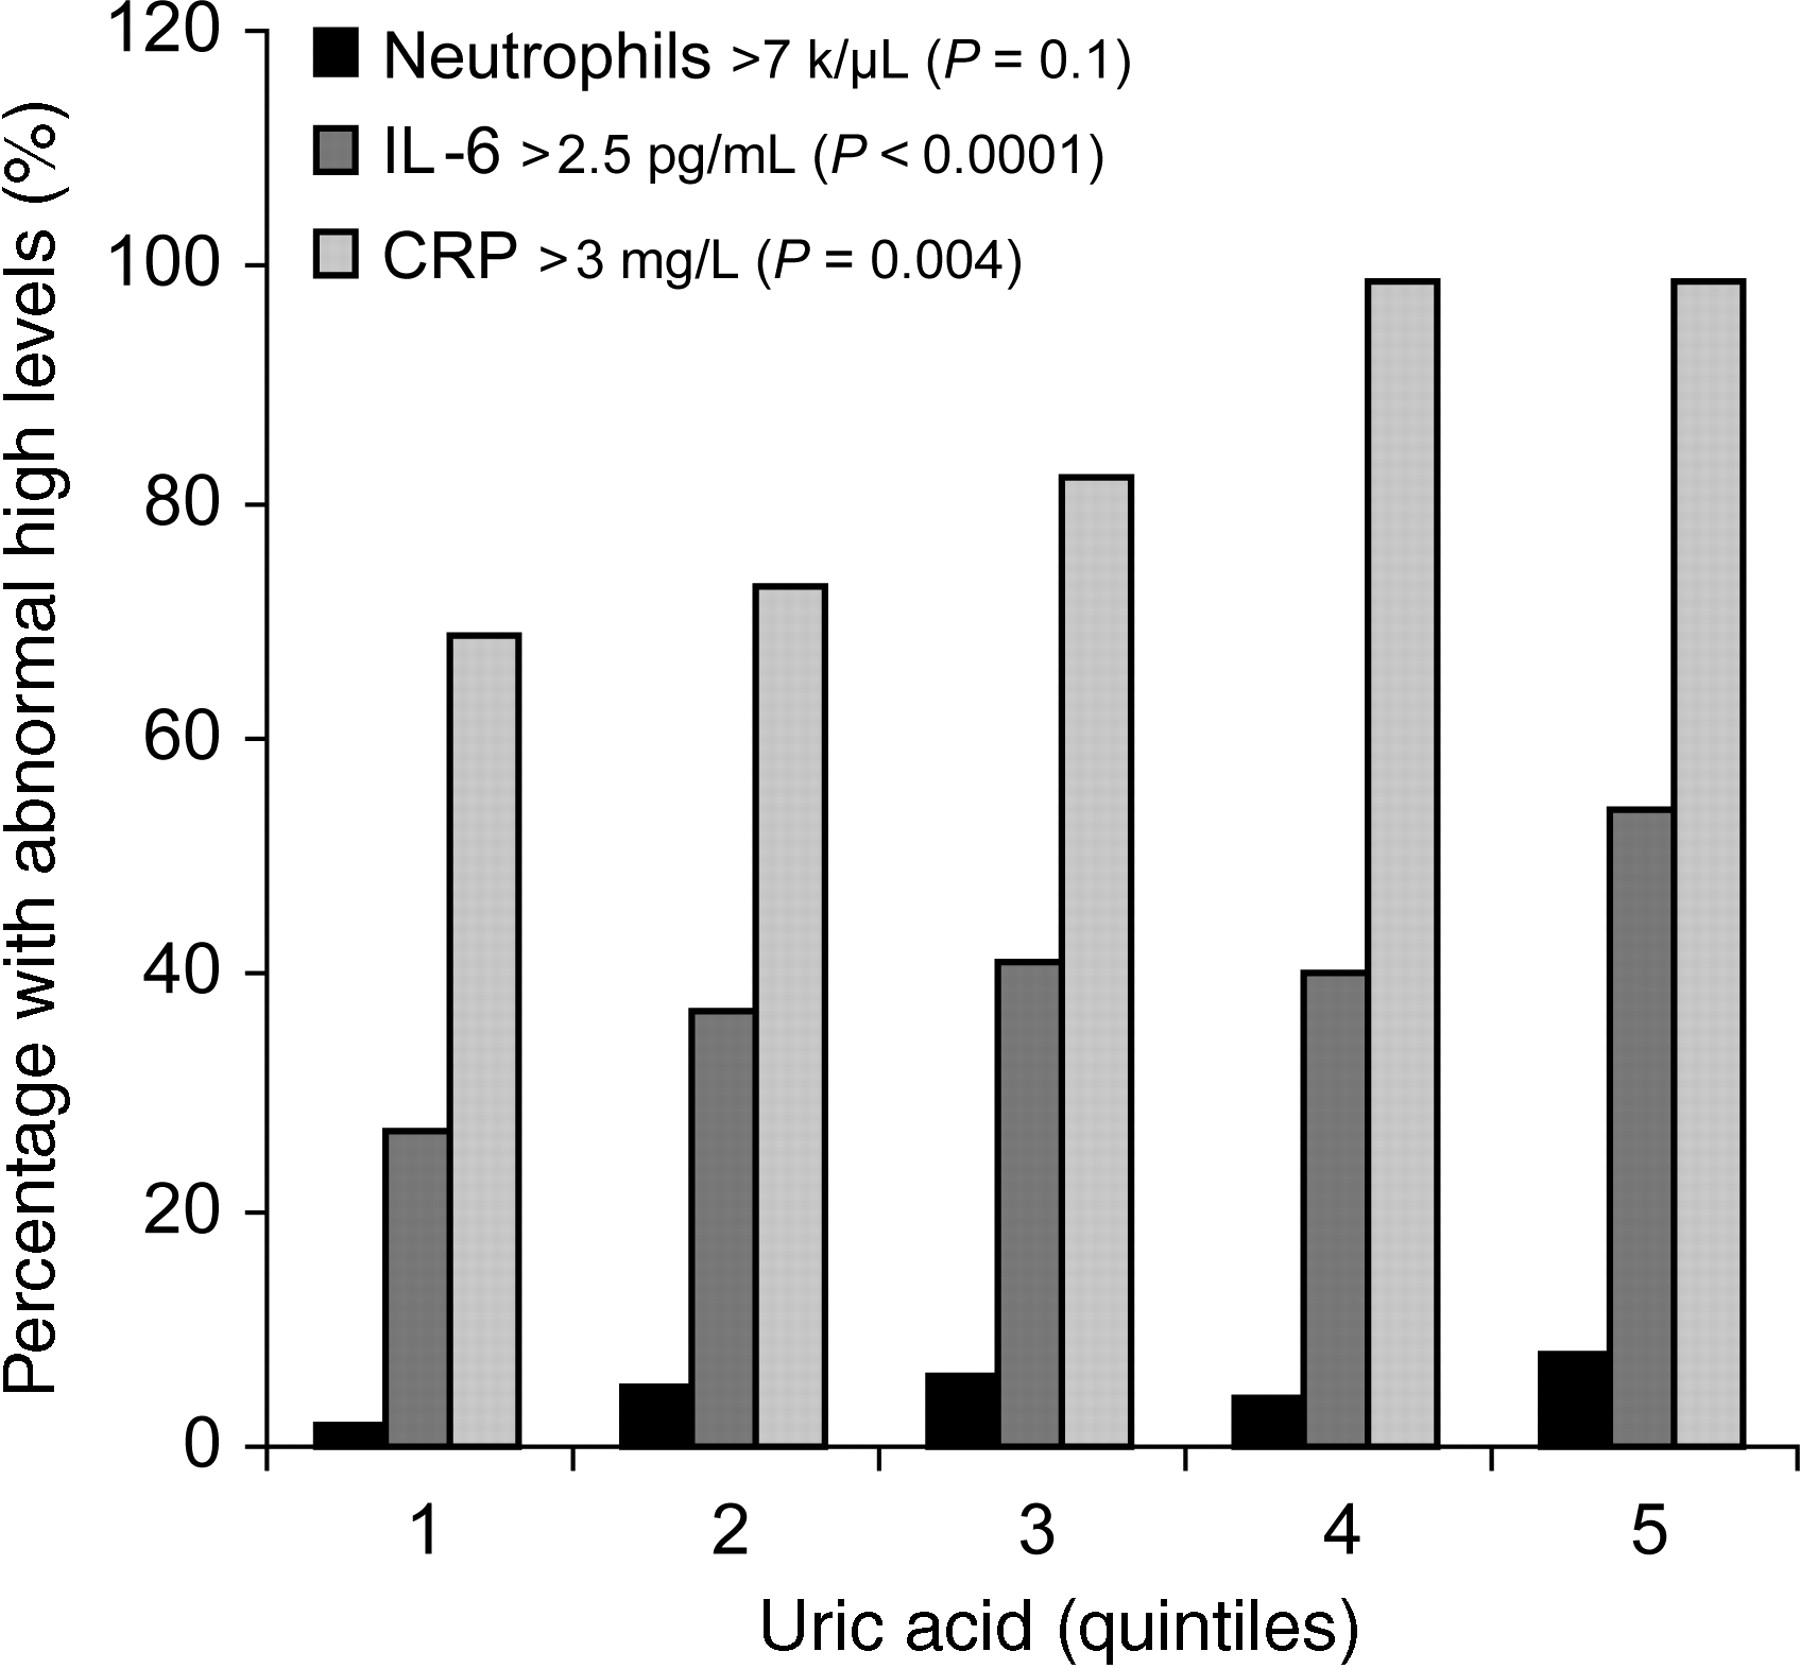
Mean values and 95% confidence interval of inflammatory markers are reported in Table 2, according to UA quintiles. The prevalence of participants with IL-6 >2.5 pg/mL, (P=0.004), and C-reactive protein >3.0 mg/L, (P<0.0001), was progressively and significantly higher from the bottom to the top UA quintiles. The prevalence of abnormal neutrophils count (>7.0 K/µL) tended to be higher in subjects with high UA levels, although this trend was not statistically significant (Figure 1).
Prevalence of subjects with high levels of neutrophils, IL-6, and CRP according to uric acid quintiles.
Linear regression model of uric acid and inflammatory parameters, and their mean levels across the quintiles
| Inflammatory parameters | Serum uric acid (mg/dL) | Serum uric acid (quintiles)a | |||||
|---|---|---|---|---|---|---|---|
| β±SEb | P-valueb | 1 (n=196) | 2 (n=190) | 3 (n=205) | 4 (n=185) | 5 (n=181) | |
| 1.4–4.0 mg/dL | 4.1–4.7 mg/dL | 4.8–5.3 mg/dL | 5.4–6.1 mg/dL | 6.2–11.6 mg/dL | |||
| White blood cells (K/µL) | 0.18±0.04 | <0.0001 | 5.8 (5.5–6.2) | 6.0 (5.7–6.3) | 6.1 (5.7–6.4) | 6.2 (5.9–6.5) | 6.5 (6.4–6.6) |
| Neutrophilsc (K/µL) | 0.04±0.01 | <0.001 | 3.3 (3.1–3.6) | 3.4 (3.2–3.7) | 3.5 (3.3–3.8) | 3.7 (3.4–3.9) | 3.8 (3.7–3.9) |
| Lymphocytesc (K/µL) | 0.02±0.01 | 0.069 | 1.8 (1.6–1.9) | 1.7 (1.6–1.9) | 1.7 (1.6–1.8) | 1.8 (1.6–1.9) | 1.9 (1.8–2.0) |
| CRPc (µg/mL) | 0.14±0.03 | <0.0001 | 2.2 (1.8–2.8) | 2.5 (2.0–3.2) | 2.6 (2.1–3.2) | 3.0 (2.5–3.8) | 3.5 (3.4–3.6) |
| ESRc (mm/h) | 0.03±0.02 | 0.087 | 14.8 (12.6–17.4) | 15.1 (12.9–17.7) | 13.6 (11.7–15.9) | 16.8 (14.4–19.7) | 16 (13.6–18.7) |
| IL-1c (pg/mL) | 0.10±0.08 | 0.185 | 1.0 (0.5–2.0) | 1.1 (0.5–2.1) | 1.0 (0.6–2.0) | 1.6 (0.8–3.1) | 1.0 (0.5–2.0) |
| IL-1rac (pg/mL) | 0.11±0.01 | <0.0001 | 112 (100–126) | 122 (108–137) | 131 (117–147) | 143 (127–160) | 162 (144–182) |
| IL-6c (pg/mL) | 0.08±0.02 | 0.0002 | 1.2 (1.0–1.4) | 1.4 (1.2–1.6) | 1.4 (1.2–1.7) | 1.5 (1.2–1.8) | 1.7 (1.5–1.9) |
| sIL-6rc (ng/ml) | 0.04±0.01 | 0.0021 | 86.0 (77.1–96.0) | 87.0 (78.0–96.7) | 90.6 (81.6–100.5) | 92.0 (82.4–02.0) | 102.0 (90.8–115.0) |
| TNF-αc (pg/mL) | 0.1±0.01 | <0.0001 | 2.2 (1.3–2.7) | 2.3 (1.9–2.6) | 2.3 (2.0–2.7) | 2.7 (2.4–3.2) | 2.8 (2.7–3.2) |
| IL-8c (pg/mL) | 0.03±0.05 | 0.574 | 5.4 (3.5–8.2) | 4.6 (3.0–7.0) | 6.2 (4.2–9.2) | 5.4 (3.6–8.1) | 5.0 (4.5–5.7) |
| IL-10c (pg/mL) | 0.11±0.04 | 0.007 | 0.9 (0.6–1.3) | 0.8 (0.6–1.1) | 1.1 (0.8–1.4) | 0.9 (0.7–1.3) | 1.1 (0.9–1.2) |
| IL-12c (pg/mL) | 0.10±0.05 | 0.052 | 3.1 (2.0–4.9) | 3.0 (1.9–4.8) | 3.1 (2.1–4.7) | 3.8 (2.5–6.0) | 3.8 (3.4–4.3) |
| IL-18c (µg/mL) | 0.03±0.01 | <0.0001 | 351 (332–382) | 355 (331–380) | 379 (354–404) | 411 (384–440) | 399 (355–449) |
aData are reported as mean ±95% confidence intervals according to uric acid quintiles.
bβ Coefficients±standard errors and P-test are from age- and sex-adjusted linear models using UA as a continuous independent variable.
cLog-transformed values were then back-transformed for data presentation.
White blood cells (WBC), neutrophils, C-reactive protein, IL-1ra, IL-6, sIL-6r, IL-18, and TNF-α were progressively and significantly higher from the lowest to the highest UA quintiles, and this significant trend was confirmed after adjustment for age and sex. Lymphocyte count showed a similar but non-significant trend (P=0.069). Markers of inflammation that were not substantially different according to UA quintiles, (lymphocytes, IL-1, IL-8, IL-10, IL-12, and ESR) were not considered in further analyses.
The levels of inflammatory markers that in previous analysis had been found independently and significantly associated with UA are plotted in Figure 2 according to UA quintiles. Values are expressed as the number of SD from the population mean, to make them directly comparable. Interestingly, the trajectories of all inflammatory markers considered in this analysis were almost superimposed.
Mean values of inflammatory parameters, (expressed as a number of SD from the population mean), according to uric acid quintiles.
In linear models adjusted for age and sex, UA expressed as a continuous variable was a significant predictor of IL-1ra, IL-6, sIL-6r, IL-18, TNF-α, WBC, neutrophils and C-reactive protein (Table 3, model 1). After adjustment for the first set of covariates, the beta coefficients for UA were slightly reduced and, except for sIL-6r, they remained statistically significant (Table 3, model 2). After further adjustment for co-morbid conditions, the results were virtually unchanged (Table 3, model 3).
Linear regression models on the relationship between uric acid and inflammatory markers
| Overall population | IL-1ra (pg/mL)a | IL-6 (pg/mL)a | sIL-6r (ng/mL)a | IL-18 (µg/mL)a | TNF-α (pg/mL)a | White blood cells (K/µL) | Neutrophils (K/µL)a | CRP (µg/mL)a |
|---|---|---|---|---|---|---|---|---|
| Model 1b | ||||||||
| β±SE | 0.11±0.01 | 0.08±0.02 | 0.04±0.01 | 0.03±0.01 | 0.06±0.02 | 0.14±0.02 | 0.04±0.01 | 0.14±0.03 |
| P | <0.0001 | 0.0002 | 0.0021 | <0.0001 | 0.0008 | 0.0001 | <0.0001 | <0.0001 |
| Model 2b | ||||||||
| β±SE | 0.12±0.01 | 0.08±0.02 | 0.02±0.01 | 0.03±0.01 | 0.07±0.02 | 0.14±0.04 | 0.03±0.01 | 0.14±0.02 |
| P | <0.0001 | 0.0002 | 0.15 | <0.0001 | 0.0005 | 0.0002 | <0.0001 | <0.0001 |
| Model 3b | ||||||||
| β±SE | 0.09±0.02 | 0.05±0.02 | 0.02±0.01 | 0.02±0.01 | 0.05±0.02 | 0.11±0.04 | 0.03±0.01 | 0.12±0.03 |
| P | <0.0001 | 0.030 | 0.27 | 0.046 | 0.030 | 0.027 | 0.0016 | 0.0001 |
| Normo-uricemic subjects | ||||||||
| Model 4b | ||||||||
| β±SE | 0.1±0.02 | 0.06±0.03 | 0.01±0.02 | 0.03±0.01 | 0.06±0.03 | 0.11±0.06 | 0.03±0.01 | 0.15±0.04 |
| P | <0.0001 | 0.029 | 0.5 | 0.006 | 0.031 | 0.085 | 0.014 | 0.0003 |
aVariables expressed as log value.
bNote that the statistic reported here is from parsimonious models obtained by removing all covariates that were not statistically associated with the outcome. Model 1: adjusted for age and sex. Model 2: adjusted for age, sex, energy intake, protein intake, alcohol intake, smoking, physical activity, vitamin E, serum creatinine. Models 3 and 4: adjusted for all variables in model 2, and hypertension, cardiovascular diseases, cerebrovascular diseases, diabetes, metabolic syndrome, cancer, atherosclerosis, chronic renal failure, arthritis and use of diuretics.
In the fully adjusted models fitted in subjects within the normal UA range (2–7.5 mg/dL in men and 2–5.7 mg/dL in women), a significant and positive association was confirmed between UA and neutrophils count, C-reactive protein, IL-6, IL-1ra, IL-18, and TNF-α (Table 3, model 4). Similar non-significant trends across the normal UA levels were found for WBC (P=0.09) and sIL-6r (P=0.26).
Discussion
In community-dwelling older persons, randomly selected from the general population, we found a positive and significant association between UA and inflammatory markers, such as WBC, neutrophil count, C-reactive protein, IL-6, IL-1ra, IL-18, and TNF-α. These associations were independent of multiple potential confounders, and in most cases remained statistically significant after restricting the analysis to subjects within the normal UA levels. Moreover, across the UA quintiles, we found a progressive increase in the percentage of subjects with abnormally high levels of IL-6 and CRP, which are considered solid markers of inflammation in clinical practice. These findings suggest that the relationship between UA and inflammatory markers is linear across the entire range of UA and that such a relationship may be clinically relevant even in subjects with UA within the normal range. However, the nature of such a relationship remains unknown.
Although several studies have found that higher UA is an independent risk factor for CVD and mortality in subjects with cardiovascular risk profile and a negative prognostic factor for survival in heart failure patients, it is still controversial whether high UA is a compensatory attempt to counteract increased oxidative stress, an independent cause of CVD, or just a condition associated with other well-established risk factors such as hypertension, diabetes, and an accelerated clinical evolution of the disease.13–17
Allopurinol, a xanthine oxidase (XO) inhibitor, has been shown to improve contractile capacity and myocardial efficiency both in CHF patients and in experimental models.36–41 Furthermore, in post-myocardial infarction primary angioplasty and aorto-coronary bypass surgery, allopurinol reduced the oxidative damage related to reperfusion and increased immediate and late left ventricular contractility.42,43 It has been suggested that these beneficial effects of allopurinol are mediated by XO inhibition or radical scavenger properties or both. However, an additional protective contribution due to the UA reduction may not be excluded.
Some authors suggested that high UA levels may promote the development and the progression of arteriolosclerosis,26 atherosclerosis,44 or hypertensive organ damage,45 perhaps by exerting a deleterious effect on endothelial function.10 Recently, an intrinsic negative effect of UA on the arterial wall has been demonstrated in hyperuricemic subjects,46 but this finding was not confirmed in healthy and relatively young subjects exposed to UA infusion.47
However, building on the finding that excess mortality risk attributable to UA is particularly evident in women,9,16,48 older persons,49,50 and subjects with pre-existing CVD,51,52 and considering that immunosenescence is less pronounced in women than in men53 and that aging and CVD are both characterized by a proinflammatory state,19,54,55 we imply that UA may contribute to mortality through proinflammatory mechanisms. Indeed, a significant association between high UA levels and inflammatory markers has been demonstrated in subjects affected by heart failure.22,23 By demonstrating a positive association between UA and several pro-inflammatory markers our study adds to this evidence. Interestingly, the association between UA and inflammation was found in large sample representative of the general population and was not limited to subjects with hyperuricemia. Actually, a significant linear trend was also detected within the UA ‘normal range’. These findings suggest that UA is not only a marker of catabolic rate but also might be actively involved in systemic inflammation, which is an important component of the causal pathway leading to hypertension, vascular diseases, and renal failure.10
Given the epidemiological nature of our observations, whether UA is a marker of pro-inflammatory state or causes inflammation ‘per se’ remains uncertain. However, considerable pre-clinical data support the latter hypothesis. Soluble UA activates the proliferation of rat vascular smooth muscle cells, stimulates the pro-inflammatory response and up-regulates the cyclo-oxygenase-2 activity and vascular C-reactive protein.10,25,56 Human mononuclear cells exposed to UA increase their production of IL-1β, IL-6, and TNF-α,10 whereas neutrophils release proinflammatory proteins.57
Overall, these findings support the idea that UA may negatively impact the health status, perhaps by activating a complex vicious cycle involving inflammatory and oxidative related mechanisms. Briefly, in inflammatory related diseases chronic hypoxia causes cellular damage that upregulates the XO enzyme, leading to parallel increase of UA and free radicals production,58 resulting into endothelial dysfunction.59 Cytokines (TNF-α, IL-1, and IFN-γ) may increase the UA production through the enhancement of XO activity, the ROS-mediated cell damage,60 and the promotion of apoptosis.61 In support to this hypothesis, UA released from cytoplasm into local tissue microenvironments may boost the proinflammatory immune responses, even when its concentration is within normal physiological limits.24 The pathogenetic relevance of this vicious cycle in the clinical evolution of CVD is likely to be particularly important in the presence of predisposing conditions, such as old age or high burden of comorbidity.
The main strength of this study is that the InCHIANTI project is especially suited to address the association between UA levels and multiple cytokines, because they were systematically measured in all participants, together with information about major confounders.
Potential limitations of the study should be considered as well. First, because of the cross-sectional nature of our data, a casual pathway from UA to inflammation is suggested but not definitively proven by our findings. Indeed, a possible mechanism of reverse causality is supported by some pre-clinical data and may account for the UA–inflammation–UA vicious cycle described previously.60 In addition, we could only measure circulating UA, which is only a weak reflection of tissue deposits.
In spite of this limitation, our findings may have significant clinical and speculative implications. The increased level of inflammatory markers as well the progressively higher percentage of subjects with abnormally elevated inflammatory markers across the UA levels suggest that UA might contribute to the proinflammatory state that characterizes many chronic diseases typical in old age. This hypothesis would have to be tested in future clinical studies.
Conflict of interest: none declared.

