


Abstract
To determine the clinical value of six traditional and three IFN-related biomarkers in monitoring disease activity (DA) in SLE.
Prospective longitudinal study of IFNα, IFNγ-inducible protein 10 (IP-10) and sialic acid-binding Ig-like lectin 1 (SIGLEC1) vs antibodies against dsDNA (ELISA and Farr radioimmunoassay), dsDNA-complexed nucleosomes (anti-dsDNA-NcX: ELISA), nucleosomes (ANuA: ELISA) and complement C3/C4 for correlation with DA (measured by BILAG 2004 index) in 26 SLE patients (77 visits). Optimal upper and lower longitudinal thresholds for the biomarkers and their accuracies for reflecting clinically relevant changes in DA (flares and remission) were determined by receiver operating characteristic and Youden index analysis.
Increases in IP-10, SIGLEC1 and ANuA to + 101.6 pg/ml, +5.01 relative mean fluorescence intensity and +16.20 IU/ml above the calculated upper longitudinal threshold significantly reflected lupus flares, with a sensitivity and specificity of 50 and 95% for IP-10, 83 and 90% for SIGLEC1 and 58 and 95% for ANuA. Decreases in anti-dsDNA (ELISA), IFNα and anti-dsDNA (Farr assay) to − 64.7 IU/ml, −16.69 pg/ml and −3.3 IU/ml below lower longitudinal thresholds, respectively, best reflected remission, with sensitivity and specificity of 75 and 95%, 62 and 90%, and 75 and 90%, respectively.
IP-10, SIGLEC1 and ANuA emerged as advantageous biomarkers for monitoring disease activity. This is the first study in SLE that provides longitudinal biomarker thresholds and test accuracies for SLE flares and remitting disease. In the context of IFN-directed therapies, chemokines and fluorescence-activated cell sorting-based IFN biomarkers for monitoring SLE activity should be further studied.
Rheumatology key messages
IFNα and its response proteins IP-10 and SIGLEC1 correlate longitudinally with SLE disease activity.
Longitudinal biomarker thresholds and test accuracies were calculated for SLE.
Biomarker analysis revealed that IP-10 and SIGLEC1 could be useful for monitoring lupus activity.
Introduction
Expert knowledge and experience as well as accurate disease activity (DA) indices and biomarkers are essential for monitoring DA and improving clinical care in SLE patients. The consumption of complement components such as C3 and C4 and the appearance of antibodies against anti-dsDNA have represented the gold standard biomarkers of SLE for more than five decades. However, their use regarding longitudinal assessment is limited [1]. To our knowledge, only the IFNγ-inducible protein 10 chemokine (IP-10), erythrocyte-bound C3d/C4d and anti-nucleosome antibodies (ANuA) have been investigated longitudinally and compared with the gold standard laboratory tests for lupus [2–5]. While IP-10 outperformed complement factors and anti-dsDNA antibodies in two independent and large longitudinal studies [2, 3], erythrocyte-bound C3d and C4d did not exceed the gold standards [5]. In 2011, we reported that ANuA and dsDNA-complexed nucleosomes (dsDNA-NcX) were more specific for SLE than anti-dsDNA antibodies and detected changes in DA over time better than complement factors or anti-dsDNA antibodies [4].
IFNα and its surrogate markers are cross-sectionally and longitudinally correlated to DA in SLE [3, 6–10]. In contrast, the IFN type I induced gene signature in whole blood did not correlate to longitudinal changes in DA in SLE patients [11, 12]. In 1979, Hooks et al. [6] reported a correlation between elevated IFN levels and DA in SLE; their study of samples from nine SLE patients demonstrated a longitudinal correlation between antiviral effects (indicating IFN bioactivity) and DA. In 2000, Bengtsson et al. [10] showed that IFNα levels in serial samples from 30 SLE patients, as measured by a dissociation-enhanced lanthanide fluorescence immunoassay (DELFIA), increased during flares [10]. Two recent studies demonstrated that IP-10, inducible by IFNα, correlated longitudinally with lupus activity [2, 3]. However, two independent studies analysing the whole blood IFN signature did not find any such longitudinal correlation with SLE activity [11, 12]. Landolt-Marticorena et al. [11] described a lack of association between the IFN signature and longitudinal changes in SLEDAI scores in 27 SLE patients. Petri et al. [12] confirmed this in a longitudinal analysis of IFN response scores over consecutive pairs of visits in different subsets of SLE patients.
Although many studies provided evidence of longitudinal correlations of biomarkers with DA, they did not affect clinical decision-making or provide the level of evidence needed to include these biomarkers as endpoints in clinical trials. To determine the usefulness of a biomarker to monitor lupus activity, the following clinical questions have to be answered: what is the optimal threshold for a longitudinal biomarker to reflect clinically relevant changes in DA? How sensitive is the biomarker of interest for detecting a flare or remitting disease? How predictive is a significant change in a biomarker for a substantial change in SLE activity?
In addition to reliable laboratory tests, longitudinal test accuracy data are needed to answer these questions. So far, these issues have only been addressed in a single study including 14 patients with lupus flares [13]. Knowledge of the longitudinal test accuracies of biomarkers enables their benchmarking and improves their interpretation; this is necessary to guide decision-making based on clinically relevant changes.
Recently, we compared the ability of IFNα and the two dependent proteins IP-10 and sialic acid-binding Ig-like lectin 1 (SIGLEC1) vs the traditional biomarkers anti-dsDNA-NcX and ANuA to detect and predict DA in SLE [9, 14]. Here, we report on a longitudinal extension of this previous study designed to benchmark IFN-related biomarkers (IFNα, IP-10, SIGLEC1) in comparison with standard laboratory tests for lupus (anti-dsDNA by ELISA and Farr radioimmunoassay, C3 and C4) and other assays (ANuA and anti-dsDNA-NcX by ELISA).
Methods
Study participants and detection of biomarkers
Twenty-six SLE patients (23 female and 3 male, 25 Caucasian and 1 Asian, mean age 38 years, age range 21–69 years) meeting at least 4 of the 11 components of the ACR criteria for SLE [15] in combination with a previous or present history of positive ANuA tests were prospectively recruited at the Department of Rheumatology and Clinical Immunology of the Charité University Hospital Berlin. Seventy-seven visits by these 26 patients were included in the analysis. Written informed consent according to the Declaration of Helsinki was obtained from all participants. The ethics committee of the Charité University Hospital Berlin approved the study. General information about the patients and their medication is provided in supplementary Table S1, available at Rheumatology Online. Patients with an increase in prednisolone dose within the last 4 weeks because of inhibitory effects of IFN were excluded from the analysis. Patients receiving dialysis therapy (n = 1) as well as those with psychiatric symptoms (n = 1) or infections (n = 7) were also excluded. SLE patients were seen 3-monthly at their regular followup visits or earlier if disease was worsening. There were no fixed time points between the visits. Lupus DA was assessed throughout the study by the same physician. BILAG 2004 categories were converted into numerical scores as follows: A = 12, B = 5, C = 1, D = 0, E = 0 [16, 17]. The individual scores were then summed to yield an overall DA score. DA was also assessed by SLEDAI [18].
Biomarker detection methods
All sera were stored at −80 °C. IP-10 levels were analysed by using a Quantikine ELISA (R&D Systems, Minneapolis, MN, USA) based on anti-human IP-10 antibodies and were processed according to the manufacturer’s instructions. Miltenyi Biotec (Bergisch Gladbach, Germany) analysed serum IFNα levels by using a time-resolved, fluorimetry-based DELFIA non-commercial immunoassay. Auto-antibodies were determined with commercially available tests by Euroimmun (Lübeck, Germany) (anti-dsDNA ELISA, Farr assay, anti-dsDNA-NcX ELISA, anti-Nuc ELISA). All measurements, except for C3 and C4, were performed in duplicate.
Flow cytometric detection of SIGLEC1 on monocytes
Whole blood samples, of 90 µl, were stained with anti-CD14-FITC (Miltenyi Biotec) and anti-CD169 RPE (clone 7-329) (AbD Serotec, Oxford, UK) mAb for flow cytometric analysis for 15 min on ice. As a control, the same staining omitting anti-CD169 antibody was performed. Erythrocytes were lysed on ice for 15 min by using fluorescence-activated cell sorting (FACS) Lysing Solution (Becton Dickinson, Heidelberg, Germany). Cells were washed twice using PBS containing 2% BSA and 5 mmol/l EDTA. Cells were fixed using Cellfix (Becton Dickinson) and analysis was done within 24 h using an LSR II cytometer (Becton Dickinson) with DIVA software 6.0 (Becton Dickinson). Relative median fluorescence intensity (rMFI) for SIGLEC-1 was calculated by dividing the SIGLEC1 expression on CD14+ monocytes by the intensity of negative controls.
Longitudinal biomarker threshold analysis for classification of changes in DA in SLE patients
The clinical relevance of changes in biomarker levels in lupus is unknown. In order to use a biomarker to prospectively identify clinically relevant changes in DA, reliable upper and lower thresholds for biomarkers are needed. The results of the present analysis could be applied to biomarkers that are assessed during a fluctuating or therapy-modified disease (e.g. tumour markers in cancer).
In this study, between-visit changes in lupus activity were categorized into three groups: increasing (flare), stable (inactive) or decreasing (remitting) (Fig. 1A). The first group consisted of 12 consecutive pairs of visits showing increasing DA (flare), which was defined as a new BILAG A or B score [19] and no improvement by A or B between visits. The second group consisted of 21 pairs of visits showing stable (inactive) disease, which was defined by two consecutive visits with a C, D or E but no A or B in the BILAG systems. The third group included eight pairs of visits characterized by decreasing (remitting) DA between visits, which was defined by an improvement of a prior documented A or B in the BILAG systems but no new A or B. Consecutive visits (n = 10) that did not meet the criteria of flare, remitting or inactive disease were excluded.
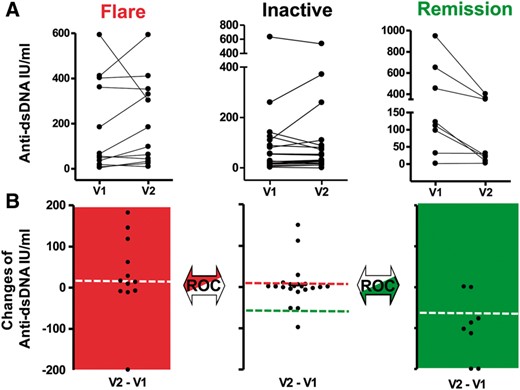
Longitudinal biomarker analysis
(A) Changes in lupus activity between two consecutive visits were categorized as worsening (flare), stable disease (inactive) or improvement (remission). Representative plots for anti-dsDNA between visits (V) 1 and 2 are shown. (B) The dots for serial visits were connected by a line, and differences in biomarker changes were calculated to yield the dot plot. ROC analysis for determination of upper thresholds compared differences in biomarker changes between the Flare and Inactive groups (red). ROC analysis for determination of the lower threshold included the Inactive and Remission groups (green).
The change (Δ) in biomarker levels (BLs) between each pair of consecutive visits was calculated for all biomarkers and patients as follows: ΔBL = BLvisit2 – BLvisit1 (Fig. 1B). Receiver operating characteristic (ROC) analysis for upper threshold determination for each studied biomarker compared differences in ΔBL between the groups Flare and Stable (Inactive). ROC analysis for determination of the respective lower thresholds included the Stable (Inactive) and Remission groups. The upper and lower thresholds were defined as the highest Youden index values (sensitivity + specificity − 1). The Youden index is a well-investigated summary measure for selecting optimum cut-off points in statistics [20].
Statistical analysis
Statistical analyses were performed with GraphPad Prism 6.0 (GraphPad, La Jolla, CA, USA) and STATA 12 software (StataCorp., College Station, TX, USA). The change (delta, Δ) in each parameter (P), including biomarkers, laboratory values, BILAG-2004 scores, BILAG-2004 systems and mSLEDAI scores, between all included serial visits of each SLE patient were calculated as follows: ΔP[n−1] = parameter visit[n] – parameter visit[n−1]. Analyses were done by using a linear mixed model (see supplementary Fig. S1, available at Rheumatology Online) and an analytically weighted linear regression model with weighting for the number of included visits between Δbiomarker and Δparameter to take into account the different numbers of consecutive visits per patient.
The definition of active disease characterized by an A or B category in BILAG is recommended [21]. The Youden index provides a widely accepted method for estimating thresholds. The threshold associated with the Youden index corresponds to the point with the maximum risk difference in the outcome (e.g. flare) and the dichotomized biomarker [22]. This method results in reliable threshold estimates in small sample sizes [22]. Bias-corrected confidence intervals for the area under the curve (AUC) in receiver operating characteristics were estimated by bootstrapping based on 1000 bootstrap replications [23]. The one-tailed significance test in ROC analyses achieves a statistical power of > 80% when assuming an area under curve of at least 0.7, and a balanced sample size in the two groups of patients with the biomarker below or above the selected limit. The statistical power decreases to 65% in case of an unbalanced sample size assuming 20% of the patients in the group with the biomarker above the limit.
Results
IFNα and SIGLEC1 reflect longitudinal changes in DA
The clinical course of a lupus patient is characterized by cycles of stable, relapsing and remitting disease, which often result in changes in lupus medication. This might ultimately affect the type I IFN system, represented here by serum levels of IFNα and SIGLEC1 expression levels on monocytes. Therefore, we plotted these parameters against the BILAG-2004 and medication characteristics of nine lupus patients over time (total of 51 visits) to test for relationships (supplementary Fig. S2, available at Rheumatology Online).
Statistical analysis of changes in biomarker levels vs changes in SLE activity
Seventy-seven total visits by 26 patients led to 51 delta visits (consecutive visits). Changes in BILAG-2004 scores were plotted against changes in all nine selected biomarkers (supplementary Fig. S3, available at Rheumatology Online). All measured IFN biomarkers—IP-10 (r = 0.50, P = 0.0002), SIGLEC1 (r = 0.45, P = 0.001) and IFNα (r = 0.42, P = 0.0022)—correlated with DA scores (BILAG-2004), while anti-dsDNA (ELISA)—the standard-of-care biomarker—was only weakly correlated to DA over time (r = 0.29, P = 0.0424). Anti-dsDNA by Farr assay (P = 0.5188), C3 (P = 0.0507) and C4 (P = 0.3895) did not show correlations related to lupus activity. Anti-dsDNA-NcX (r = 0.63, P < 10−4) and ANuA (r = 0.63, P < 1 0−4) were the biomarkers with the highest correlation coefficients reflecting changes in DA.
Correlation analyses of clinical and laboratory parameters over time
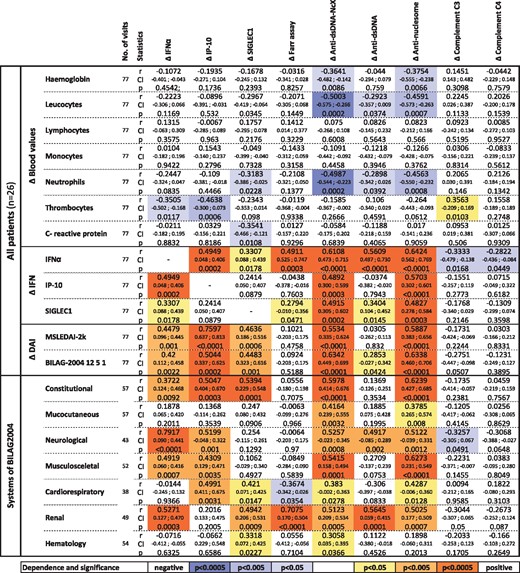
To reveal further longitudinal laboratory and clinical associations, all nine biomarkers were statistically analysed for correlation to various clinical parameters (Fig. 2). Increased anti-dsDNA-NcX and ANuA titres were predominantly associated with decreased neutrophil counts and correlated significantly with all IFN-related parameters. Decreasing thrombocyte counts were mostly associated with increasing IP-10 and IFNα levels over time. Furthermore, we analysed all nine biomarkers for a relationship to a specific organ system involvement. Therefore, only those SLE patients with a known abnormality in the studied BILAG system were included (patients with an E in the affected BILAG system were excluded). Changes in neurological complaints showed a high correlation with changes in IFNα levels (r = 0.79, P < 0.0001). Apart from IP-10, C3 and C4, changes in all other biomarkers investigated were significantly related to changes in renal DA.
Laboratory and clinical significance of changing biomarker levels
All nine biomarkers were investigated with regard to their statistically significant relationships to whole blood values, their relationship to IFN biomarkers, overall disease activity and their manifestations in the BILAG-2004 systems. Weighted correlation coefficients in linear regression were calculated. In the category (‘systems’), changes in the BILAG-2004 system (A, B, C and D score) were correlated to changes in biomarkers. The colour intensity indicates the statistical significance levels, with orange values indicating positive and blue representing negative correlations with respect to particular biomarker levels. DAI: disease activity index; mSLEDAI-2K: modified SLE disease activity index 2000; P: P-value; r: correlation coefficient.
Biomarker benchmarking for monitoring SLE activity
Statistical correlation analysis of changes in biomarker levels between two consecutive visits, as described in the previous section (see Fig. 2), is a simple and frequently used method for studying biomarkers in SLE. In clinical practice, however, correlation analysis of biomarkers is difficult because vital longitudinal diagnostic test accuracy data on parameters such as sensitivity and specificity are not available so far. Therefore, we performed ROC analysis to test for differences between the flare, stable (inactive) and remitting disease groups in terms of the change in biomarker levels (ΔBL) in these disease states (cf. Fig. 1A). The Youden index was used to identify optimal lower and upper thresholds between these groups. These thresholds were then used to calculate the sensitivities and specificities of the respective biomarkers. The results for all nine biomarkers are presented in Table 1.
Benchmark analysis of nine biomarkers
| Δ IFNα | Δ IP-10 | Δ SIGLEC1 | Δ Farr assay | Δ Anti-dsDNA-NcX | Δ Anti-dsDNA | Δ Anti-nucleosome | Δ Complement C3 | Δ Complement C4 | |
|---|---|---|---|---|---|---|---|---|---|
| Unit | pg/ml | pg/ml | rMFI | IU/ml | iU/ml | IU/ml | IU/ml | mg/dl | mg/dl |
| Flare (new A or B in BILAG) | |||||||||
| Limit (YI) | 17.32 | 101.60 | 5.01 | 7.45 | 36.27 | 7.67 | 16.20 | −8.00 | −1.50 |
| YI | 0.42 | 0.45 | 0.74 | 0.54 | 0.44 | 0.48 | 0.54 | 0.30 | 0.11 |
| AUC | 0.56 | 0.75 | 0.78 | 0.66 | 0.71 | 0.65 | 0.72 | 0.70 | 0.61 |
| 95% CI by bootstrap | 0.31, 0.81 | 0.55, 0.91 | 0.57, 0.96 | 0.41, 0.88 | 0.48, 0.89 | 0.40, 0.87 | 0.47, 0.91 | 0.51, 0.86 | 0.42, 0.76 |
| P-value | 0.600 | 0.017 | 0.008 | 0.121 | 0.052 | 0.166 | 0.040 | 0.054 | 0.312 |
| Sensitivity | 41.67 | 50.00 | 83.33 | 58.33 | 58.33 | 66.67 | 58.33 | 58.33 | 25.00 |
| Specificity | 100.00 | 95.24 | 90.48 | 95.24 | 85.71 | 80.95 | 95.24 | 71.43 | 85.71 |
| Remitting disease (improving of A or B in BILAG) | |||||||||
| Limit (YI) | −16.69 | −346.70 | −13.59 | −3.30 | −147.10 | −64.70 | −17.27 | 11.00 | 2.50 |
| YI | 0.53 | 0.58 | 0.70 | 0.65 | 0.63 | 0.70 | 0.45 | 0.36 | 0.33 |
| AUC | 0.84 | 0.75 | 0.75 | 0.76 | 0.74 | 0.86 | 0.57 | 0.65 | 0.61 |
| 95% CI by bootstrap | 0.52, 0.97 | 0.49, 0.97 | 0.42, 1.00 | 0.45, 0.97 | 0.45, 1.00 | 0.64, 1.00 | 0.24, 0.89 | 0.37, 0.88 | 0.29, 0.85 |
| P-value | 0.005 | 0.040 | 0.040 | 0.036 | 0.045 | 0.003 | 0.592 | 0.205 | 0.354 |
| Sensitivity, % | 62.50 | 62.50 | 75.00 | 75.00 | 62.50 | 75.00 | 50.00 | 50.00 | 37.50 |
| Specificity, % | 90.48 | 95.24 | 95.24 | 90.48 | 100.00 | 95.24 | 100.00 | 85.71 | 95.24 |
Clinically relevant changes in disease activity (flare/remission) were evaluated by receiver operating characteristic (ROC) and Youden index (YI) analysis to calculate optimal upper and lower thresholds and the respective test accuracies for the biomarkers. P < 0.05 was considered significant and is shown in bold. AUC: area under the ROC curver; rMFI: relative median fluorescence intensity.
For discrimination between flare and stable disease, IP-10, SIGLEC1 and ANuA achieved significant P-values in ROC analysis. Increasing IP-10 and SIGLEC1 discriminated best between the two groups: the AUC for these biomarkers was 0.75 and 0.78, respectively. Figure 3 shows the sensitivities of all nine longitudinal biomarkers for discriminating between the three disease states based on the calculated thresholds. Regarding the detection of disease flares, an increase in SIGLEC1 expression by >5.01 rMFI showed a sensitivity of 83%, while an increase in IP-10 by >101.6 pg/ml had a sensitivity of 50%. The gold standard biomarkers did not reach the level of significance in ROC analysis, as reflected by low AUC values. C3 showed high but clinically irrelevant fluctuation in stable disease, leading to low overall test performance.
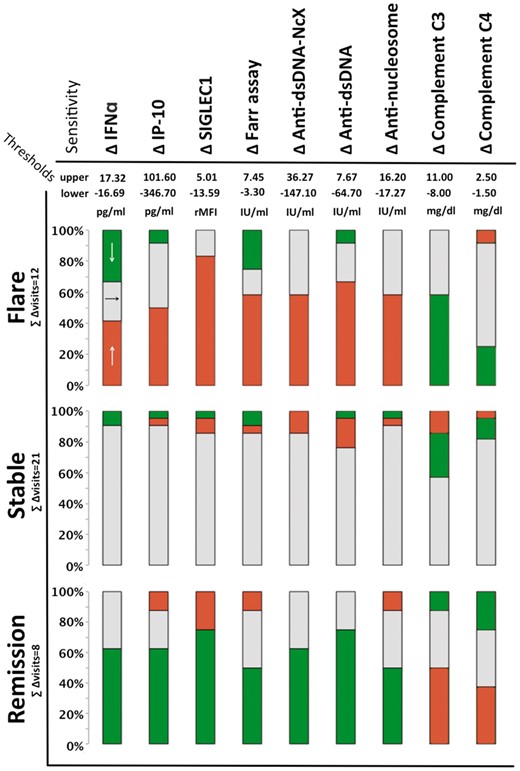
Calculated thresholds for each biomarker indicating clinically relevant changes in disease activity
Colour coding of biomarker changes: red indicates biomarker increases above the upper threshold, green indicates a biomarker decreases below the lower threshold, and grey indicates biomarker changes within the threshold range.
Regarding discrimination between remitting vs stable (inactive) disease, ROC analysis led to significant P-values for IFN- and anti-dsDNA-related biomarkers. IFNα and anti-dsDNA (ELISA) achieved high AUC values (>0.8). The highest sensitivity for remitting disease was obtained with the calculated cutoff points (lower thresholds) for SIGLEC1 and anti-dsDNA (by Farr assay and ELISA), with a sensitivity of 75%.
Furthermore, we wanted to find out if it is possible to utilize the biomarker kinetics data (increasing/decreasing biomarker levels) to discriminate between the disease states (flare/remission) based on the specific biomarker thresholds. Therefore, we calculated the positive predictive value (PPV) for each biomarker. The results are shown in Table 2.
Relevance of changing biomarker levels
| Predictive value | Δ IFNα | Δ IP-10 | Δ SIGLEC1 | Δ Farr assay | Δ Anti-dsDNA-NcX | Δ Anti-dsDNA | Δ Anti-nucleosome | Δ Complement C3 | Δ Complement C4 |
|---|---|---|---|---|---|---|---|---|---|
| Unit | pg/ml | pg/ml | rMFI | IU/ml | iU/ml | IU/ml | IU/ml | mg/dl | mg/dl |
| PPV of increasing, % BL (for flare) | 100.00 | 75.00 | 71.43 | 77.78 | 70.00 | 66.67 | 77.78 | 50.00 | 37.50 |
| PPV of stable, % BL (for stable diseae) | 76.00 | 73.08 | 90.00 | 78.26 | 69.23 | 76.19 | 70.37 | 60.00 | 62.07 |
| PPV of decreasing, % BL (for remission) | 45.45 | 71.43 | 85.71 | 44.44 | 100.00 | 75.00 | 80.00 | 57.14 | 60.00 |
The positive predictive value (PPV) of changes in biomarker level (BL) for each disease state was calculated for all nine biomarkers. rMFI: relative median fluorescence intensity.
IFNα elevation above the calculated threshold was found to be highly predictive of flares, with a PPV of 100% in our lupus cohort. In contrast, below-threshold decreases in anti-dsDNA-NcX antibodies were 100% predictive for remission (cf. Table 2). SIGLEC1 predicted both disease states well (71 and 86%, respectively). Stable biomarker levels predicted stable (inactive) disease with a PPV of 90% for SIGLEC1, followed by 76% for IFNα and 76% for anti-dsDNA (ELISA). C3 and C4 were the biomarkers with the lowest PPV (60 and 62%, respectively).
Discussion
Few biomarkers are used in lupus practice and not all provide sufficient reliability for clinical decision-making [1]. While almost all longitudinal studies show correlations between DA and the investigated biomarkers, physicians need data on the accuracy of these tests for useful clinical interpretation. Valuable longitudinal biomarker information includes the sensitivity and specificity of a given change in biomarker levels to reflect flares or remitting lupus activity. This study is the very first to provide longitudinal biomarker-specific thresholds and longitudinal diagnostic test accuracy data for SLE flares and remission. Therefore, this detailed benchmark analysis provides clinically relevant data.
First, we demonstrated the correlation of changes in IFNα and SIGLEC1 expression with changes in DA and medication in nine lupus patients. To substantiate our findings, we used a simple and frequently used correlation analysis to test for correlations between our set of biomarkers and changes in DA. Anti-dsDNA-NcX, ANuA and IP-10 showed the best correlation with longitudinal changes of disease indices, followed by SIGLEC1 and IFNα. Anti-dsDNA, C3 and C4 did not correlate longitudinally. This is in line with earlier reports. [2–4, 10, 24] Here, we showed for the first time that SIGLEC1 and lupus activity correlate longitudinally. These data provide additional evidence of a longitudinal association between the type I IFN system and lupus activity, as reflected by IFNα [6, 10], IP-10 [2, 3] and SIGLEC1, but contradict the findings of two studies using the whole blood IFN signature [11, 12].
It becomes more and more difficult to attribute symptoms to SLE activity in clinical assessment as the number of factors, such as organ damage, comorbidities (e.g. infections and psychological disorders) or drug side effects, increases. Valuable biomarkers that reflect DA with known longitudinal test accuracies might facilitate decision-making in these cases. Hereby, increasing levels of IP-10 and SIGLEC1 expression, followed by ANuA (ELISA), indicated flares longitudinally better than traditional biomarkers of lupus. Notably, increasing SIGLEC1 expression had the highest sensitivity for detecting flares (83%). Until now, longitudinal biomarker thresholds (e.g. ⩾25% change) have been defined arbitrarily [13, 25–28]. Only Hillebrandt et al. [13] investigated the longitudinal diagnostic test accuracies of changes in anti-dsDNA, as determined by Farr assay, for detecting lupus flares in 14 SLE patients. Using ⩾25% change in anti-dsDNA as a threshold, they calculated a sensitivity of 86% but with a specificity of only 13% for far assay and attributed the low test performance to the threshold [13]. Although not directly comparable, the use of Youden index and ROC analysis for threshold calculation in the present study resulted in improved test performance for the Farr assay (Table 1).
Remitting disease in response to treatment is determined by clinical and laboratory methods. Laboratory parameters indicating the success of treatment are evaluated regularly [29, 30], but rarely by longitudinal threshold analysis. Hui-Yuen et al. [28] defined a laboratory response as a ⩾ 25% increase in C3 or decrease in anti-dsDNA antibodies. Longitudinal test accuracies for disease remission have not been calculated so far. Our analysis showed that a remitting disease cycle was reflected significantly by most of our biomarkers except C3, C4 and ANuA. All IFN-related biomarkers, anti-dsDNA and anti-dsDNA-NcX indicated disease remission longitudinally, with sensitivities ranging from 62.5 to 75% and specificities of > 90%. Most notably, decreasing anti-dsDNA-NcX and SIGLEC1 levels were highly predictive for disease remission (PPV of 100 and 85.7%, respectively). Achieving a significant reduction of biomarker levels might serve as a criterion for treatment success that could be used as an end point in clinical trials or observational studies to objectify treatment response [30].
This study has certain limitations that should be considered when interpreting the results. First, as sensitivity and specificity are interrelated, optimal comparison of the sensitivities of all nine biomarkers at a set specificity level was hampered by the small number of patient visits available for analysis. We reported confidence intervals to show the degree of uncertainty in parameter estimates. Performing this analysis in a larger multicentre cohort study could overcome this more statistically relevant limitation. Second, we included SLE patients fulfilling the ACR criteria and who were positive for ANuA. These criteria were used earlier [25] and account for roughly two-thirds of SLE patients [31], which means the analysis might not be applicable to ANuA negative patients. Third, the use of relative MFI for the longitudinal assessment of SIGLEC1 expression could be further optimized by performing bead calibration, as done by Kikuchi-Taura et al. [32], to yield absolute numbers of SIGLEC1 molecules per monocyte. This would allow for more standardized measurement of SIGLEC1 expression independent of the cytometer used and its respective configuration.
In conclusion, this is the first study to benchmark biomarkers by calculating practical longitudinal thresholds and test accuracies that are needed to improve lupus diagnostics. We showed that IFN-related biomarkers and ANuA assays provide advantages over the current standard biomarkers. The extension of this analysis to a larger validation cohort could increase the diagnostic value of these biomarkers and provide new possibilies for improving clinical care of SLE patients.
Acknowledgements
Special thanks to Cornelia Dähnrich and Wolfgang Schlumberger of EUROIMMUN AG (Lübeck, Germany) for determining the autoantibody concentrations (anti-dsDNA, anti-dsDNA-NcX and ANuA) in serum samples from our SLE patients using the Anti-dsDNA RIA (Farr assay), Anti-dsDNA ELISA, Anti-dsDNA-NcX ELISA and Anti-Nucleosomes ELISA test kits by EUROIMMUN, and to Tobias Ozimkowski and Andrzej Dzionek from Miltenyi Biotec GmbH (Bergisch Gladbach, Germany) for determining IFNα levels by DELFIA.
Funding: This work was supported by the ‘European Union’s Sixth Framework Programme’ [project AutoCure; LSHB-CT-2006-018861], the ‘German Research Foundation’ [Collaborative Research Centre SFB650, TP12, TPZ6 and TP17], ‘IMI JU’ funded project BeTheCure [contract No 115142-2] and the ‘Zukunftsfond Berlin’ [contract No 101399339].
Disclosure statement: F.H. is supported by grants from the Deutsche Forschungsgemeinschaft (SFB 650). All other authors have declared no conflicts of interest.
Supplementary data
Supplementary data are available at Rheumatology Online.

Comments