Article Text

Abstract
Objective Compare changes in lipids and lipid-associated cardiovascular (CV) risk markers in patients with rheumatoid arthritis (RA) treated with tocilizumab or adalimumab.
Methods Post-hoc analysis was performed in patients with RA who received tocilizumab intravenously every 4 weeks or adalimumab subcutaneously every 2 weeks for 24 weeks in the ADACTA trial. Lipid and lipid-associated CV risk biomarkers, including high-density lipoprotein-associated serum amyloid-A (HDL-SAA), secretory phospholipase A2 IIA (sPLA2 IIA) and lipoprotein(a) (Lp(a)), were measured at baseline and at week 8.
Results The study included 162 patients treated with tocilizumab and 162 patients treated with adalimumab; HDL-SAA and sPLA2 IIA were measured in a subpopulation of 87 and 97 patients, respectively. Greater increases in mean low-density lipoprotein cholesterol (LDL-C) (0.46 mmol/L (95% CI 0.30 to 0.62)), high-density lipoprotein cholesterol (HDL-C) (0.07 mmol/L (0.001 to 0.14)), total cholesterol (TC) (0.67 mmol/L (0.47 to 0.86)), triglycerides (0.24 mmol/L (0.10 to 0.38)) and TC:HDL ratio (0.27 (0.12 to 0.42)) occurred with tocilizumab from baseline to 8 weeks. HDL-SAA, sPLA2 IIA and Lp(a) decreased more with tocilizumab than adalimumab. Median changes from baseline to week 8 were –3.2 and –1.1 mg/L (p=0.0077) for HDL-SAA and –4.1 and –1.3 ng/mL (p<0.0001) for sPLA2 IIA; difference in adjusted means was –7.12 mg/dL (p<0.0001) for Lp(a). Similar results were observed in efficacy responders and non-responders per American College of Rheumatology and European League against Rheumatism criteria.
Conclusion LDL-C and HDL-C increased more with tocilizumab than adalimumab. HDL-SAA, sPLA2 IIA and Lp(a) decreased more with tocilizumab. Lipid change effects of interleukin-6 and tumour necrosis factor (TNF) inhibition, manifest by their net impact on lipids and lipoproteins, are not synonymous; the clinical significance is unclear and requires further study.
Trial registration number NCT01119859.; post-results
- Lipids
- Cardiovascular Disease
- Inflammation
- Rheumatoid Arthritis
This is an Open Access article distributed in accordance with the Creative Commons Attribution Non Commercial (CC BY-NC 4.0) license, which permits others to distribute, remix, adapt, build upon this work non-commercially, and license their derivative works on different terms, provided the original work is properly cited and the use is non-commercial. See: http://creativecommons.org/licenses/by-nc/4.0/
Statistics from Altmetric.com
Introduction
Patients with rheumatoid arthritis (RA) are at increased risk of cardiovascular disease (CVD) compared with the general population.1 ,2 Traditional risk factors for CVD do not appear to fully explain this increased risk,3 and additional factors, including inflammation, may contribute to CVD risk in RA.4 ,5 The impact of inflammation on lipid levels is complex and may manifest as changes in total cholesterol (TC) levels and in lipid particle–associated proteins, such as serum amyloid A (SAA) and secretory phospholipase A2 IIA (sPLA2 IIA); both are identified biomarkers of increased cardiovascular (CV) risk.6–8 Patients with severe, untreated RA may have very low lipid levels, which is paradoxical when considering their increased risk of CVD.9 In contrast, treatment of active disease can lead to elevated levels of TC, low-density lipoprotein cholesterol (LDL-C) and high-density lipoprotein cholesterol (HDL-C) in conjunction with reduced levels of inflammation.9
Lipoprotein(a) (Lp(a)) levels are increased in patients with RA.10 The association of Lp(a) with CVD in the general population has been assessed through genetic and Mendelian randomisation studies.11–13 These studies strongly point to Lp(a) as a causal agent in the process of atherogenesis.11–14
Moderate early elevations in LDL-C, HDL-C and triglyceride levels were reported in Phase II and Phase III clinical trials of patients with RA treated with the interleukin-6 (IL-6) receptor inhibitor tocilizumab (TCZ); the TC:HDL-C ratio either decreased or remained unchanged.15 In contrast, a decline in Lp(a) with TCZ treatment and a change in HDL protein composition occurred.16 Lipid changes have also been reported in patients with RA treated with tumour necrosis factor (TNF)-α inhibitors.17 Patients with RA treated with adalimumab had increased HDL-C and apolipoprotein A1 levels, with no change in LDL-C or triglyceride levels, and improvement in atherogenic ratios.18 ,19 Data on the effect of TNF-α blockers on Lp(a) are mixed, though most did suggest a reduction.19–23 Described here is a post-hoc analysis of data from a clinical trial that compared IL-6 and TNF-α signalling inhibition to assess the impact of these therapeutic strategies on lipid-associated CV risk biomarkers and their relationship to treatment response. The dearth of such comparator trials despite an urgent need for better understanding of any differential effects of these agents on CV risk parameters makes this analysis important.
Patients and methods
Patients
This post-hoc study included patients from the ADACTA trial (ClinicalTrials.gov number NCT01119859). ADACTA was a Phase IV study that assessed the efficacy of TCZ as monotherapy compared with adalimumab as monotherapy in adults who had RA for ≥6 months and who were intolerant of or not good candidates for continued use of methotrexate (MTX).24 A total of 326 patients were randomly assigned 1:1 to receive either TCZ 8 mg/kg monotherapy intravenously every 4 weeks plus subcutaneous placebo every 2 weeks or adalimumab 40 mg monotherapy subcutaneously every 2 weeks plus intravenous placebo every 4 weeks for 24 weeks. Patients had to discontinue all synthetic disease-modifying antirheumatic drugs (DMARDs) within an appropriate washout period before baseline; any patient requiring treatment with a synthetic or biological DMARD was withdrawn from the study.24 Analyses of core lipids and Lp(a) were performed in the ADACTA safety population, which included all patients who received at least one dose of study medication and had at least one post-dose safety assessment. Additional analyses of lipid-associated CV risk biomarkers were performed in 184 patients (97 adalimumab, 87 TCZ) who consented to donate serum bio-repository samples for further exploratory analysis and who provided both baseline and week 8 samples. Week 8 samples provide a larger sample size than do later time points, and previous studies have shown that lipid changes observed after 6 weeks remain stable with continued TCZ treatment.25
Assessments
Core lipid panel (LDL-C, HDL-C, TC and triglycerides) and lipid-associated CV risk biomarker levels (Lp(a), HDL-SAA and sPLA2 IIA) were analysed in serum samples obtained at baseline and at week 8. Week 8 was selected because of the limited availability of bio-repository samples later in the study although data for Lp(a) and core lipids were available for later time points. With the exception of LDL, which was calculated using the formula TC−HDL-C−(triglycerides/5), the core lipid panel was measured using the β-quantification method. The core lipid panel and Lp(a) was analysed by Covance Central Laboratory Services (Indianapolis, Indiana, USA). Assays for HDL-SAA and sPLA2 IIA levels were performed at Pacific Biometrics (Seattle, Washington, USA).
sPLA2 IIA was determined with the use of an enzyme immunoassay (EIA) kit (Cayman Chemical, Ann Arbor, Michigan, USA) by coupling a monoclonal capture antibody with detection by acetylcholinesterase/Fab conjugate and 5′5-dithiobis 2-nitrobenzoic acid (DTNB). EDTA serum Lp(a) (Denka Seiken, Tokyo, Japan) was quantified using immunoturbidimetric assay kits. These assays were performed with a Roche Modular P autoanalyzer (Roche Diagnostics, Indianapolis, Indiana, USA).
For determination of HDL-SAA, serum HDL particles were isolated by polyethylene glycol 8000 (PEG-8000; Promega, Madison, Wisconsin, USA) precipitation, as described by Chiba et al.26 Briefly, equal volumes of 13.0% PEG (P-4463; Sigma-Aldrich, St Louis, Missouri, USA) were mixed to precipitate non-HDL proteins and lipoproteins. After centrifugation for 5 min at 18 000 g, supernate SAA was determined by EIA (Abazyme; Needham, Massachusetts, USA). An anti-SAA monoclonal capture and a horseradish peroxidase-conjugated polyclonal antibody were used with 3,3′,5,5′-tetramethylbenzidine (TMB) detection.
Statistical analyses
Differences between TCZ and adalimumab in change from baseline to week 8 in LDL-C, HDL-C, TC, triglycerides, TC:HDL ratio and Lp(a) were assessed using a post-hoc analysis of covariance model adjusted for baseline laboratory parameters.
Differences in change from baseline to week 8 in HDL-SAA and sPLA2 IIA were assessed using the Kruskal–Wallis test. Log transformation of the data was investigated because of the skewed distribution of these two parameters. The transformation did not allow the parameters to be normally distributed; therefore, the non-parametric statistical method of the Kruskal–Wallis test was used to account for the skewed distribution of the data. Change from baseline to week 8 was summarised and was also split by efficacy responders. Week 24 American College of Rheumatology (ACR) 20, ACR50 and European League against Rheumatism (EULAR) good/moderate responders and non-responders were used to analyse HDL-SAA, sPLA2 IIA and Lp(a) levels by efficacy. Change in Lp(a) from >50 mg/dL at baseline to ≤50 mg/dL at week 8 was summarised based on recommendations that suggest Lp(a) levels should ideally be <50 mg/dL in patients at intermediate or high risk of CVD/coronary heart disease (CHD).27 All statistical analyses were post-hoc; therefore, no adjustments were made for multiple testing, and no statistical significance can be claimed.
Results
The ADACTA safety population consisted of 324 patients who were intolerant of MTX or for whom MTX was inappropriate. The bio-repository population consisted of 184 patients from the ADACTA safety population. Baseline demographics and disease characteristics were similar between the two treatment arms and between the safety and bio-repository populations (see online supplementary table S1). Core lipid parameters, including LDL-C, HDL-C, TC, triglyceride levels and TC:HDL ratio, increased from baseline to week 8 with TCZ monotherapy; numerically smaller changes were observed for these lipids with adalimumab monotherapy.
Differences in mean (95% CI) change from baseline between arms were as follows: 0.46 mmol/L (0.30 to 0.62; p<0.0001) for LDL-C; 0.07 mmol/L (0.001 to 0.14; p=0.0453) for HDL-C; 0.67 mmol/L (0.47 to 0.86; p<0.0001) for TC; 0.24 mmol/L (0.10 to 0.38; p=0.0008) for triglycerides and 0.27 (0.12 to 0.42; p=0.0005) for TC:HDL ratio (table 1).
Mean change from baseline to week 8* in lipid parameters (safety population)
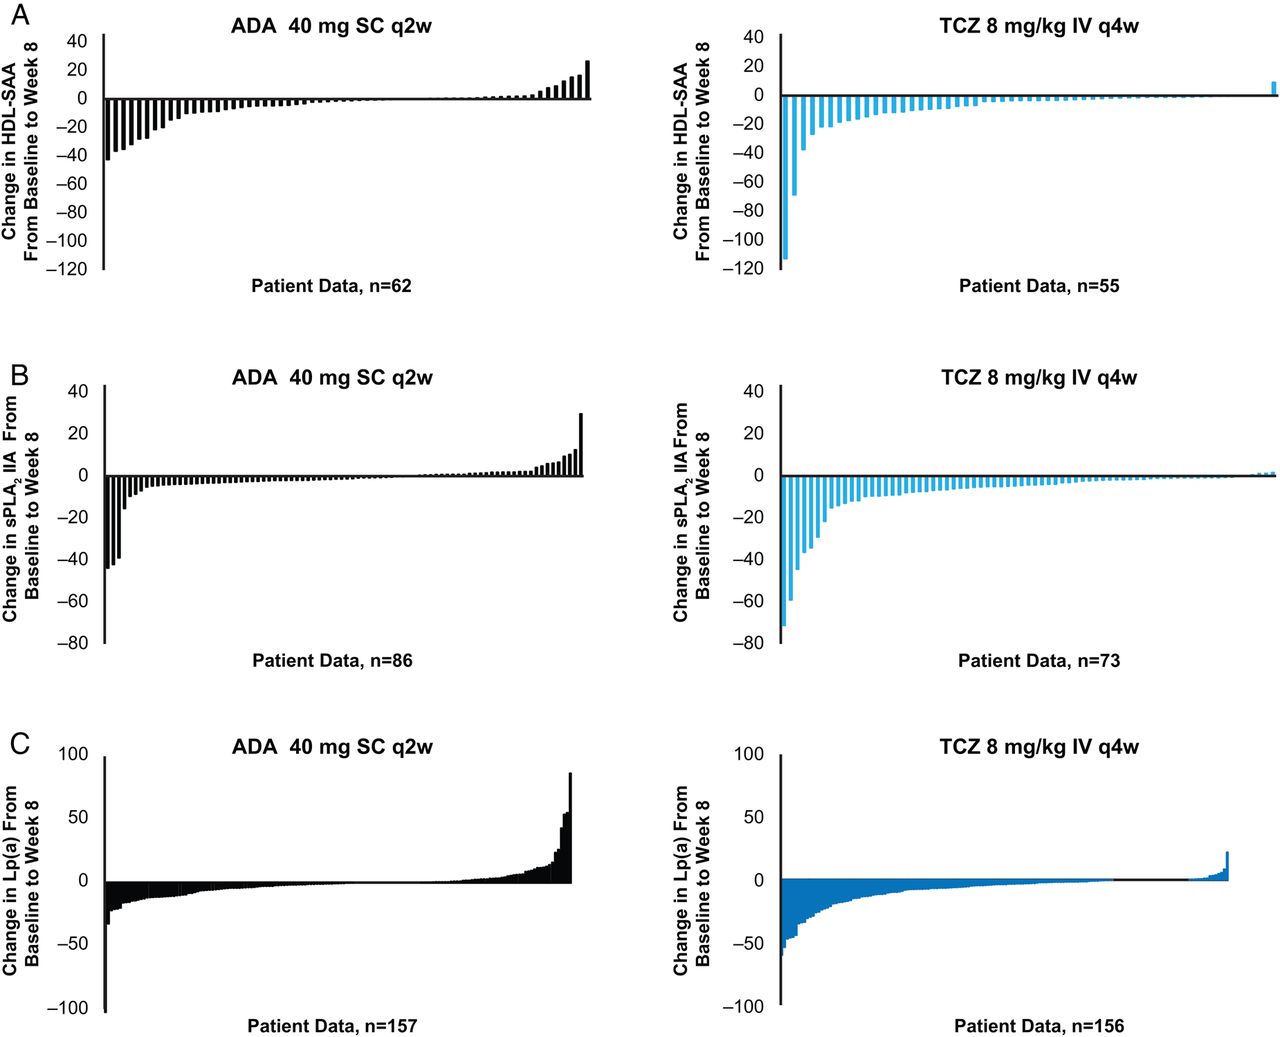
Reductions in HDL-SAA levels were observed from baseline to week 8 in patients treated with TCZ monotherapy and in those treated with adalimumab monotherapy. A greater treatment effect was observed in the TCZ group; median (IQR) change from baseline to week 8 was –3.2 mg/L (–11.1, –1.0) and –1.1 mg/L (–7.1, 0.6) for TCZ and adalimumab, respectively (p=0.0077) (table 2 and figure 1A). Reductions in sPLA2 IIA levels were also observed with both TCZ and adalimumab monotherapy, with greater reductions seen in the TCZ group; median (IQR) change from baseline to week 8 was –4.1 ng/mL (–7.8, –1.1) and –1.3 ng/mL (–2.9, 0.8) for TCZ and adalimumab, respectively (p<0.0001) (table 2 and figure 1B). Greater reductions in Lp(a) were observed in patients treated with TCZ monotherapy than with adalimumab monotherapy; the difference in adjusted means (95% CI) was –7.12 mg/dL (–9.9 to –4.4) (p<0.0001) (table 3 and figure 1C). Higher proportions of patients who had baseline Lp(a) levels >50 mg/dL improved (defined as achieving Lp(a) levels ≤50 mg/dL) by week 8 in the TCZ monotherapy group (11/21 patients (52.4%)) than in the adalimumab monotherapy group (6/24 patients (25.0%)).
Change from baseline to week 8* in HDL-SAA and sPLA2 IIA (bio-repository population)
Change from baseline to week 8* in Lp(a) for all patients (safety population)
Change from baseline to week 8 in HDL-SAA (A, bio-repository population), sPLA2 IIA (B, bio-repository population) and Lp(a) (C, safety population)—patient-level data. ADA, adalimumab; HDL-SAA, high-density lipoprotein-associated serum amyloid A; IV, intravenous; Lp(a), lipoprotein (a); sPLA2 IIA, secretory phospholipase A2 IIA; q2w, every 2 weeks; q4w, every 4 weeks; SC, subcutaneous; TCZ, tocilizumab.
Changes in HDL-SAA, sPLA2 IIA and Lp(a) levels by efficacy response
Changes from baseline to week 8 in Lp(a), sPLA2 IIA and HDL-SAA were also evaluated relative to efficacy response. Greater reductions were seen in all three lipid-associated CV risk biomarkers at week 8 in both efficacy responders and non-responders who received TCZ monotherapy than in those who received adalimumab monotherapy. In ACR20 responders and non-responders, median IQR changes from baseline to week 8 in HDL-SAA were –3.3 mg/L (–10.0, –1.0) and –3.1 mg/L (–12.95, –1.15), respectively, with TCZ and –1.0 mg/L (–6.8, 0.55) and –1.1 mg/L (–8.7, 1.2), respectively, with adalimumab. Similar trends were observed for ACR50 and EULAR good/moderate responders and non-responders for HDL-SAA and for sPLA2 IIA (table 4) and Lp(a) (table 5).
Change from baseline to week 8* in HDL-SAA and sPLA2 IIA for week 24 ACR20, ACR50 and EULAR good/moderate responders and non-responders (bio-repository population)
Change from baseline to week 8* in Lp(a) for week 24 ACR20, ACR50 and EULAR good/moderate responders and non-responders (safety population)
Discussion
It was previously demonstrated that though LDL-C levels increase in patients treated with TCZ, Lp(a) levels may decline, and favourable changes in HDL-C level and HDL composition may occur.16 Published data regarding the effect of TNF-α blockers on Lp(a) are conflicting.19–22 Data collected in the ADACTA study allowed, for the first time, a direct comparison of the effect of anti-TNF (aTNF) and anti–IL-6 therapies on lipids and lipid-associated CV risk biomarkers in the context of a single study in which other trial parameters were balanced between groups by strict randomisation and blinding. Post-hoc analyses showed a greater increase in LDL-C and greater reductions in Lp(a), HDL-SAA and sPLA2 IIA levels over the first 8 weeks of treatment in patients with RA who received TCZ monotherapy compared with those who received adalimumab monotherapy. Reductions in HDL-SAA, sPLA2 IIA and Lp(a) were observed in efficacy responders and non-responders, suggesting that the cytokines themselves—as opposed to, or at least in addition to, other disease activity-related pathways—mediate some of the effects observed. Although reductions for both responders and non-responders treated with TCZ monotherapy appear to be larger than for those treated with adalimumab monotherapy, the small sample size for each group precludes statistical comparison.
Increased inflammation in patients with autoimmune disorders such as RA is associated with quantitative and qualitative modifications of circulating lipids. Recent data suggest that decreased LDL-C and HDL-C levels in patients with active RA are associated with increased cholesterol catabolism rather than decreased synthesis, with the reverse true following treatment of inflammation.28 These data are somewhat reassuring. Nevertheless, it should be noted that parallel lipid kinetic data do not exist for TCZ or for aTNF therapies. In addition to quantitative changes, inflammation may be accompanied by changes in lipid particle size and protein composition that may result in a potentially pro-atherogenic lipid profile. In particular, SAA, sPLA2 IIA and cholesteryl ester transfer protein can remodel the lipid and protein composition of HDL particles.29 Association of HDL with SAA and sPLA2 IIA impairs antioxidative and atheroprotective capacity of HDL.30 Displacement of HDL cargo proteins that have antioxidant activity, such as apoA1 and paraoxonase 1, with these acute-phase reactants results in HDL particles with pro-oxidant capacity.31 SAA-containing HDL may be retained in the vascular matrix by vascular proteoglycans and may therefore not be available for the reverse cholesterol transport.32
Elevated Lp(a) levels can contribute to atherogenesis by depositing LDL-C in the intima of the vascular wall by the recruitment of inflammatory cells or the binding of proinflammatory oxidised phospholipids. Lp(a) shares structural homology with plasminogen and plasmin and has potentially prothrombotic and anti-fibrinolytic properties, which could promote clot stabilisation and thrombosis.27 Recent data suggest that Lp(a) is an independent genetic risk marker of CVD and is potentially causal.13 It has been recommended that desirable levels of Lp(a) for patients at intermediate or high risk of CVD/CHD are <50 mg/dL.27
The observation that reductions in HDL-SAA, sPLA2 IIA and Lp(a) occurred in non-responders suggests that the reduction in these potentially pro-atherogenic proteins with TCZ may be, at least partially, independent of the RA treatment response, reflecting the effect of IL-6 blockade outside the joint. IL-6 is known to have an effect on the release of acute-phase proteins from hepatocytes; SAA is increased and apoA1 is decreased.31 ,33 Synthesis of Lp(a) is increased in response to IL-6 in cultured human hepatocytes through direct regulation of a response element in the Lp(a) promoter, an effect that was inhibited by TCZ.34 Therefore, the results of the current analysis may be explained by an effect of IL-6 inhibition that is independent of its anti-arthritic effect, similar to its effect on C reactive protein production.35 Decreases in HDL-SAA, sPLA2 IIA and Lp(a) levels also occurred in adalimumab non-responders; although they appeared to have occurred to a lesser extent than in TCZ non-responders, the numbers were too small to make a statistical comparison. In contrast, results from a recent cohort study of patients with RA treated with TNF-α inhibitors, including adalimumab, showed that HDL-SAA was significantly decreased and that ApoAII was increased in EULAR good responders but not in non-responders, suggesting that the changes were due to the anti-inflammatory effect of TNF-α inhibition.36 Furthermore, no change in Lp(a) levels was observed in patients with RA treated with adalimumab for 3 months, and adalimumab did not have a direct effect on Lp(a) promoter activity in human hepatocytes, as was observed with TCZ.34 The small number of patients in the current analysis preclude statistical comparison between responders and non-responders in each treatment group, and larger studies would be required to investigate mechanisms of IL-6 and TNF-α effects on HDL-SAA, sPLA2 IIA and Lp(a).
Limitations of this data analysis from the ADACTA study are that it was conducted post-hoc and that the treatment duration analysed was relatively short. Longer-term effects on lipid changes were not investigated, though these same effects seen at week 8 have been seen previously with TCZ treatment out to 24 weeks;16 nevertheless, the effect on CV risk cannot be determined. It is unknown whether the changes in lipid profiles and the reductions in Lp(a), HDL-SAA and sPLA2 IIA levels observed with TCZ treatment and the differences observed in treatment with adalimumab will have any implications on CV risk in patients with RA. Results from meta-analyses of mostly observational studies suggest that aTNF therapy for RA is likely associated with a decreased CV risk despite increases in lipid levels.37 ,38 Although the risk of CV events with TCZ has not been determined, the number of CV events in the placebo-controlled periods of the core TCZ Phase III trials was low. In addition, long-term data available to date have shown a stable rate of CV events over time with TCZ exposure.25 Furthermore, risk of on-treatment major adverse CV events was found to be associated with control of disease activity, but not lipid changes, in a retrospective post-hoc analysis of pooled data from trials, though admittedly the number of adjudicated events was modest.39 Clearly, studies designed specifically to compare the effects of biologics on lipid changes and CV outcomes are still required.
In conclusion, despite the overall increased LDL-C levels observed with TCZ compared with adalimumab, TCZ may potentially exert beneficial actions on HDL-SAA, sPLA2 IIA and Lp(a), suggesting that IL-6 blockade may work in different ways to influence CVD risk.
References
Supplementary materials
Supplementary Data
This web only file has been produced by the BMJ Publishing Group from an electronic file supplied by the author(s) and has not been edited for content.
- Data supplement 1 - Online table
Footnotes
Handling editor Tore K Kvien
Acknowledgements F. Hoffmann-La Roche provided writing assistance (performed by Sara Duggan, PhD, and Meryl Mandle).
Contributors CG, KT and MK were involved in the conception and design of the study. CG, IBM, AK, KT, MK, JP and NS were involved in the analysis and interpretation of the data. CG, NS, KT and JP wrote the initial draft of the manuscript. All authors drafted the article or revised it critically for important intellectual content; all authors approved the final version to be submitted for publication and all authors agree to be accountable for all aspects of the work in ensuring that questions related to the accuracy or integrity of any part of the work are appropriately investigated and resolved.
Funding F. Hoffmann-La Roche provided funding for writing assistance.
Competing interests CG has received fees for speaking and/or consulting from AbbVie, BMS, Roche, Pfizer, Celgene, MSD, Janssen and AB2 Bio, and he has received research funding from Roche, AbbVie, MSD and AB2 Bio. IBM has received grants and personal fees from Roche (during the conduct of the study), Pfizer, UCB, BMS, AbbVie and Amgen (outside the submitted work). AK has received grants from Roche (outside the submitted work). KT is an employee of Roche Products and owns share options in Roche. MK is an employee of Genentech and owns share options in Roche. JP is an employee of Roche Products and owns share options in Roche. NS has received fees for consulting from Roche, UCB and Sanofi/Regeneron and for speaking from Janssen.
Provenance and peer review Not commissioned; externally peer reviewed.