Article Text

Abstract
Objective: To identify classifiers in images obtained with sagittal laser optical tomography (SLOT) that can be used to distinguish between joints affected and not affected by synovitis.
Methods: 78 SLOT images of proximal interphalangeal joints II–IV from 13 patients with rheumatoid arthritis were compared with ultrasound (US) images and clinical examination (CE). SLOT images showing the spatial distribution of scattering and absorption coefficients within the joint cavity were generated. The means and standard errors for seven different classifiers (operator score and six quantitative measurements) were determined from SLOT images using CE and US as diagnostic references. For classifiers showing significant differences between affected and non-affected joints, sensitivities and specificities for various cut off parameters were obtained by receiver operating characteristic (ROC) analysis.
Results: For five classifiers used to characterise SLOT images the mean between affected and unaffected joints was statistically significant using US as diagnostic reference, but statistically significant for only one classifier with CE as reference. In general, high absorption and scattering coefficients in and around the joint cavity are indicative of synovitis. ROC analysis showed that the minimal absorption classifier yields the largest area under the curve (0.777; sensitivity and specificity 0.705 each) with US as diagnostic reference.
Conclusion: Classifiers in SLOT images have been identified that show statistically significant differences between joints with and without synovitis. It is possible to classify a joint as inflamed with SLOT, without the need for a reference measurement. Furthermore, SLOT based diagnosis of synovitis agrees better with US diagnosis than CE.
- AUC, area under the curve
- CE, clinical examination
- CSS, clinical synovitis score(s)
- MRI, magnetic resonance imaging
- PIP, proximal interphalangeal
- RA, rheumatoid arthritis
- ROC, receiver operating characteristic
- SLOT, sagittal laser optical tomography
- US, ultrasound
- USS, ultrasound score(s)
- rheumatoid arthritis
- synovitis
- finger joints
- imaging methods
- optical tomography
Statistics from Altmetric.com
- AUC, area under the curve
- CE, clinical examination
- CSS, clinical synovitis score(s)
- MRI, magnetic resonance imaging
- PIP, proximal interphalangeal
- RA, rheumatoid arthritis
- ROC, receiver operating characteristic
- SLOT, sagittal laser optical tomography
- US, ultrasound
- USS, ultrasound score(s)
Proximal interphalangeal (PIP) and metacarpophalangeal finger joints are usually among the first to be affected in rheumatoid arthritis (RA), and considered to be the best markers of overall joint damage in patients with RA.1 Precise assessment of disease activity in RA is important for monitoring treatment efficacy and predicting the outcome of the disease. For example, to use the new RA treatment with tumour necrosis factor α antagonists effectively it is important to establish an early diagnosis2–4 and perform a follow up analysis of synovitis to evaluate treatment efficiency.5 Therefore there is a need for user friendly and inexpensive diagnostic techniques to fulfil these goals without side effects so that larger populations can be screened and benefit from new treatments.
The past decade has seen an increasing use of various imaging modalities such as computed tomography, ultrasonography (US), and magnetic resonance imaging (MRI) for diagnosis and assessment of RA.6 Conventional radiography as the standard method of identifying progressive joint damage usually overlooks inflammatory soft tissue changes. MRI has shown strength in detecting early synovitis,6–9 but requires the use of contrast agents, is comparatively expensive, and involves long data acquisition times. US is particularly useful for the assessment of soft tissue structures and superficial bone lesions,10,11 and it has been reported that Doppler US is sensitive for detecting active synovitis.9,12–15 But Doppler US is not widely used yet for RA diagnostics, as the documentation is time consuming, and accurate interpretation of US images requires considerable observer training.
Optical methods that rely on transillumination measurements have emerged as potential new tools for detecting joint inflammation in RA.16–25 This technique uses low level, non-ionising near-infrared radiation and promises to provide a low cost, patient friendly joint imaging modality. In vitro studies have proved that there are significant differences in the optical properties of normal and pathological joint tissue.16–18 Extensive numerical and experimental phantom studies suggested that these differences should be detectable with transillumination measurements in vivo on the joint.19–25 In previous clinical studies, we showed that optical transmission measurements could be used for monitoring synovitis progression in patients with RA.5,26 In these studies, transillumination profiles of the joint obtained in subsequent visits were compared with transillumination profiles of the same joint obtained at the first visit. Determination of the status of joint inflammation, however, was not possible without reference to an earlier measurement.
Klose et al have argued that the need for reference measurements might be overcome if tomographic images of the distribution of optical properties inside the joint were obtained.25 We therefore have recently developed a sagittal laser optical tomographic (SLOT) imaging procedure that acquires transmission profiles and uses the data for tomographic image reconstruction of sagittal sections through the joint.27–29 SLOT images show the spatial distribution of two different optical properties (absorption coefficient, μa, and scattering coefficient, μs) inside the joint and surrounding tissues. In a small number of case studies, SLOT images could be used to distinguish between joints affected and not affected by synovitis, without reference to a previous measurement on the same finger.28 Healthy joints showed a distinct reduction in μa and μs in the joint cavity as compared with the surrounding tissue, whereas joints with synovitis showed little variation in μa and μs across the joint.
The goal of this present study was to go beyond case studies and identify classifiers in SLOT images that could be used to distinguish between joints with and without synovitis.
PATIENTS AND METHODS
Patients and clinical data
Thirteen patients (10 women and 3 men, mean (SD) age 46 (12) years, range 17–63 years) with RA according to the American College of Rheumatology criteria30 were included in the study. Patients were recruited from the Department of Rheumatology and Clinical Immunology, Charité University Hospital, Berlin, Germany. All patients were receiving cortisone and disease modifying antirheumatic drugs. Mean (SD) disease duration between the onset of disease and inclusion in the study was 4.3 (3.3) years.
The clinically predominant hand was selected for clinical examination (CE) as well as SLOT and US examinations. Only PIP joints II–IV were included in the study because they were most easily accessible with the optical scanning device and patients expressed some discomfort when placing other joints into our experimental setup. In total, 78 tomographic images were generated and compared with US and CE. The analysis of US images was performed by one investigator (AKS) who was unaware of the SLOT classifications. The study was approved by the local ethics committee and all patients gave informed consent before investigation.
Clinical examination
Clinical examination of each PIP joint was performed by bimanual palpation performed by a single physician (AKS) with long clinical diagnostic experience. Each PIP joint was examined and the clinical arthritis activity was classified from 0 to 3 (“degree of synovitis”). If the joint was not swollen, tender, or warm a score of 0 (inactive) was assigned. Joints that showed considerable swelling and were very tender and warm received a score of 3 (very active). Joints with some symptoms were scored 1 (moderately active) or 2 (active). In addition, the 28 joint count Disease Activity Score, representing the overall disease activity, was assessed at all consultations.31
Imaging methods
Conventional radiographs
Conventional radiographs were taken of the hands of all patients. Because the study focuses on synovitis, we wanted to exclude possible interference in the optical measurements by bone lesions and therefore excluded patients with extensive bone erosions from the study.
Ultrasound imaging
Ultrasound imaging was performed with an ATL, HDI-3500 ultrasound system (Bothell, USA). We used a 10-5 MHz hockey stick linear array transducer for examination of the PIP joints. Figure 1 shows examples of US images taken from the palmar side. Figure 1A shows a healthy joint and figs 1B–D show joints with inflammation. In US, two criteria of active inflammation were evaluated: joint effusion was visible as an anechoic area between the capsule and the bone in the proximal part from the palmar side of the hand (figs 1B–D). Secondly, thickening of the synovial membrane could be visualised as hyperechoic structures within the region affected by effusion (figs 1C and D). The degree of joint effusion and hypertrophy was classified on a four grade semiquantitative ultrasound examination score (USS) according to an adjusted score by Szkudlarek et al.15 They described synovitis and effusion by separate scores.15 Because both processes mainly appear at the same time, we applied a combined score; when neither effusion nor synovial hypertrophy was visible a USS = 0 was assigned. The larger the anechoic area and/or the extent of synovial hypertrophy, the higher the USS (USS = 1 minimal, USS = 2 moderate, USS = 3 extensive effusion/hypertrophy). We performed US from the palmar side because we found that synovial hypertrophy and effusion can best be evaluated from the palmar as opposed to the dorsal side. This is probably owing to the small amount of tissue overlying the joint from the dorsal side.

Ultrasound images of PIP joint II (C, D) and IV (A, B) of patients with RA at different synovitis stages. T, tendon; JC, joint cavity. In all images, bone surface is without irregularities, no erosions are visible. Images are taken from the palmar side, and the left side of the image is nearer to, and the right side further from, the hand. Different extents of effusion (ef) can be seen in images B–D. Close to the synovial membrane, synovial proliferation can be detected in images C and D. The images were graded according to the degree of effusion and synovial hypertrophy using the adjusted semiquantitative score of Szkudlarek et al15: (A) grade 0 = none; (B) grade 1 = minimal; (C) grade 2 = moderate; and (D) grade 3 = extensive; the degree of inflammation was interpreted by effusion and synovitis.
Sagittal laser optical tomography (SLOT)
SLOT was performed with an optical scanning setup recently developed in our laboratories.27–29 The system comprises a single laser diode, a silicon photodetector, and an arrangement for hand and finger placement (fig 2). A diode laser (wavelength λ = 675 nm) was focused to a spot of approximately 0.3 mm in diameter dorsal with a photodetector palmar of the finger joint. Both were attached to stepping motor driven translation stages. For measurements, the hand and finger were placed inside a specially designed holding chamber filled with water. For each laser diode position, the detector was scanned along the sagittal plane to collect light transmission intensities from 16 positions (over a 3 cm range). After finishing the detector scan, the laser diode was moved a small distance and the photo diode performed another scan, etc. This procedure was performed for 11 different laser diode positions, so that multiple transmission profiles were obtained. Data acquisition (11 source positions, 16 detector positions) for each finger joint took about 3–4 minutes. The measurement data served as input to a model based iterative image reconstruction scheme previously tested in our laboratories.32–36 This algorithm provides two dimensional images of the absorption and scattering coefficients (μa and μs) in a sagittal plane through the joint.27–29 The time needed for reconstruction of one image is approximately 2 hours on a 1.2 GHz Xenon processor.
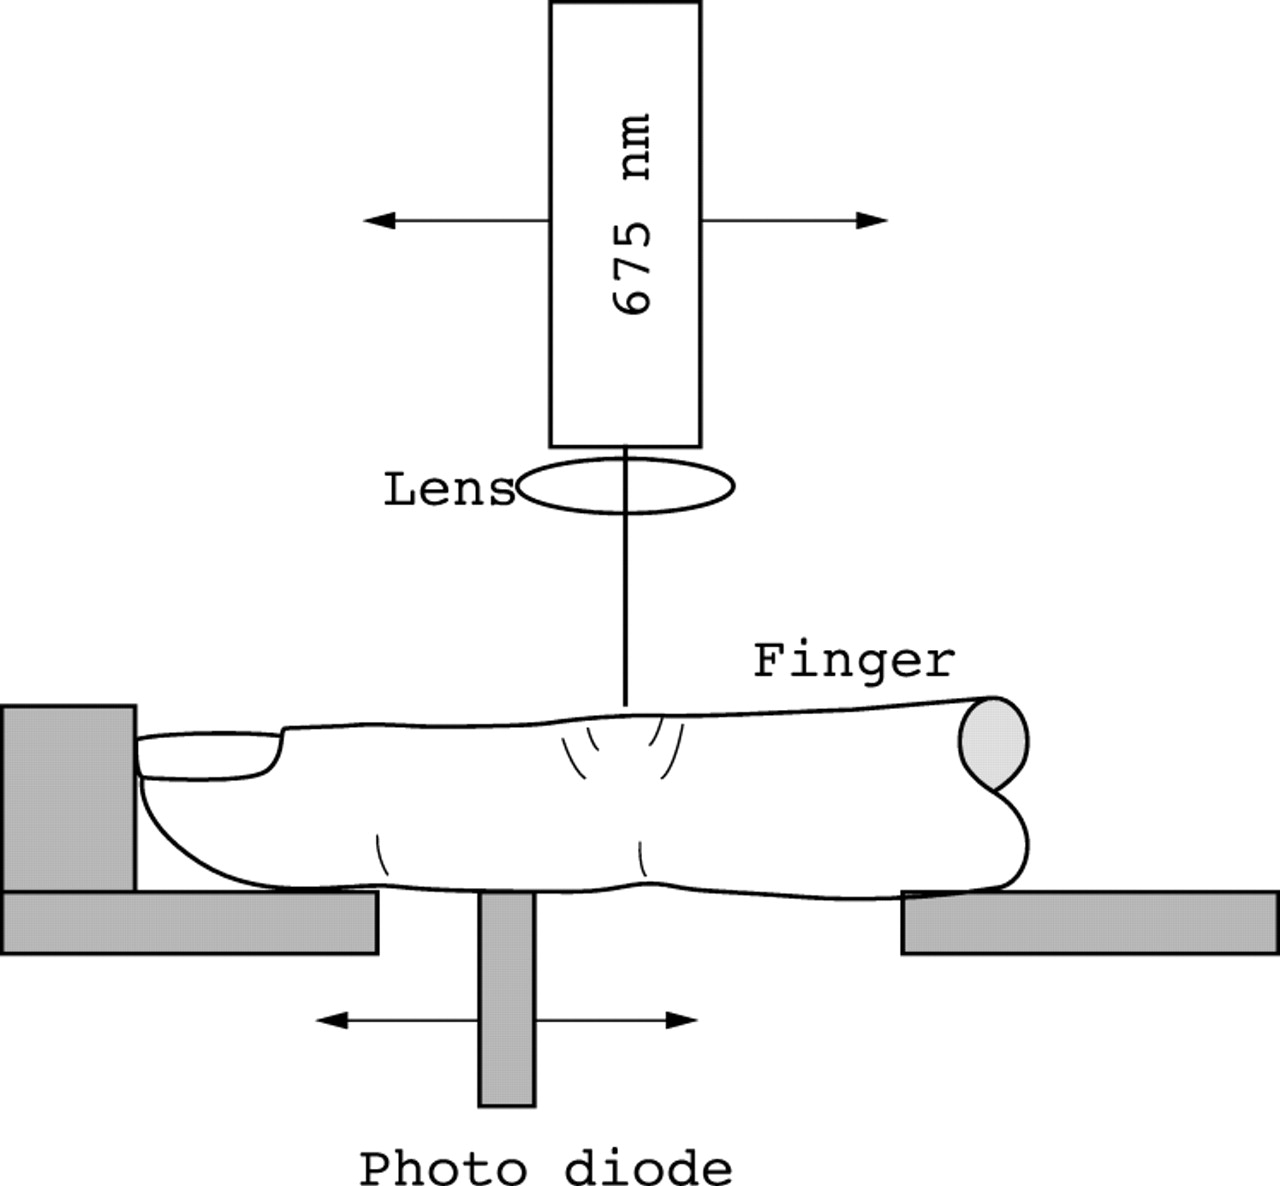
Experimental setup for sagittal joint imaging. The laser is positioned above and a photodetector is placed below the finger joint to be examined. Both, detector and diode laser are attached to stepping motor driven translation stages that permit independent control of the position of the laser diode and photodetector relative to the joint. Detector and laser are connected to a personal computer, where data are collected.
The images of μa and μs distributions were analysed in various different ways. Based on our previous experience,27,28 images were assigned an optical operator score ranging from 1 to 5 to perform receiver operating characteristic (ROC) analysis. A score of 1 was given to images that showed a pronounced drop of μa and μs in the joint cavity (fig 3A). In our earlier pilot studies we found that such a drop was an indication that a joint was “definitely not affected by synovitis”. A score of 5 was given when the image showed no spatial variation in optical properties or an increase in optical properties in the joint cavity (fig 3E). This is usually a clear sign that a joint is “definitely affected by synovitis”. When there was some decrease in optical properties in the centre of the joint, the image received a score of 2, 3, or 4, depending on the strength and spatial extent of the decrease (figs 3B–D). The clinical interpretation of these scores is “likely to be not affected” (score 2); “possibly affected” (score 3); “likely to be affected (score 4). Scoring of SLOT images was performed by one investigator (AHH) who had no knowledge of the USS or CE results.

Reconstructed cross sections of the scattering coefficient for three different fingers typical for (A) category 1—definitely no synovitis; (B) category 2—probably no synovitis; (C) category 3—possibly synovitis; (D) category 4—probably synovitis; and (E) category 5—definitely synovitis. The fingertip is located to the right of the images that show a 36 mm wide section of the finger with the joint cavity located approximately in the centre. The rectangle in fig 3A indicates the region for which Min(μs), Min(μa), Max(μs), Max(μa), Min(μs)/Max(μs), and Min(μa)/Max(μa), were calculated.
In addition to the operator dependent score, we determined further measures, used as classifiers, for each image. These measures include minimum and maximum scattering coefficients (Min(μs) and Max(μs)), minimum and maximum absorption coefficients (Min(μa) and Max(μa)), and the ratios of minimum divided by maximum scattering and absorption coefficients (Min(μs)/Max(μs) and Min(μs)/Max(μs)). Instead of determining minima and maxima for the entire image, these values were determined for the region of interest depicted in fig 3A. By choosing an area inside the finger, we excluded possible imaging artefacts that can appear in SLOT images near the sources and detectors and near the surface of the finger.
Statistics
To compare SLOT images with CE and US, we calculated the mean and respective standard errors of all optical variables (operator score, Min(μs), Min(μa), Max(μs), Max(μa), Min(μs)/Max(μs), Min(μa)/Max(μa)) for all joints with a clinical synovitis score (CSS) = 0 or 1, CSS = 2 or 3, respectively. The same was performed for fingers with USS = 0 or 1, and USS = 2 or 3. Mean values of each optical variable for affected and non-affected joints were compared using the one sided t test. A difference in the mean values was considered significant for p<0.05.
ROC analysis37 was performed for optical measures for which a significant difference in the mean between affected and non-affected joints was found. True positive (TP), true negative (TN), false positive (FP), and false negative (FN) values were calculated for all seven optical classifiers taking USS and CSS as diagnostic references for determination of synovitis (unaffected: scores 0 and 1; affected: scores 2 and 3). Sensitivities and specificities were determined by calculating the true positive rates TPR = TP/(TP+FN) and false positive rates FPR = FP/(FP+TN) (sensitivity = TPR, specificity = 1−FPR), for various thresholds for the seven different classifiers.
Furthermore, for all ROC curves we determined the points with the maximal Youden index, defined as J = sensitivity+specificity−1.38 For each classifier these points identify threshold values that lead to optimal sensitivity-specificity pairs.
RESULTS
All 13 patients had moderate to high overall disease activity (mean (SD) 28 joint count Disease Activity Score 4.7 (1.4)) at the time of examination. On the basis of CSS, 34 PIP joints were classified as grade 0, 28 joints as grade 1, 11 joints as grade 2, and 5 PIP joints as grade 3. Mean (SD) CSS for PIP joints II–IV were 0.8 (0.9). Assuming CSS 0 and 1 as unaffected and CSS 2 and 3 as pathological, 16 (21%) of the 78 joints were affected, whereas 62 (79%) joints were not affected by synovitis.
Using USS, synovitis in PIP joints was classified as follows: 11 PIP joints were classified as grade 0, 26 as grade 1, 23 as grade 2, and 18 PIP joints as grade 3. Mean (SD) USS for PIP joints II–IV were 1.54 (1.01). Assuming USS 0 and 1 as unaffected and USS 2 and 3 as pathological, 37 (47%) of the 78 joints were unaffected, whereas 41 (53%) joints were affected.
Table 1 summarises the results for the mean values and standard errors for all classifiers used to characterise SLOT images. In most cases there was a difference between the mean values for affected and unaffected joints as determined either by CE or US examination. But the differences in the mean were statistically significant (p<0.05) in only six of the 14 cases (table 1). Five classifiers (operator score, Min(μs), Min(μa), Min(μs)/Min(μs), and Min(μa)/Min(μa)) showed significant differences when optically derived measures were compared with USS, while the difference was statistically significant in only one case (Min(μa,)) if SLOT results were compared with CE (table 1). The most significant difference (p = 0.007) was found for the operator score with USS as diagnostic reference.
Various optical measures (see “Patients and methods” section)
For the cases showing statistically significant differences between mean values of affected and unaffected joints, we generated ROC curves. Assuming that a SLOT score of 4 or 5 is indicative of a joint with synovitis, while scores of 1, 2, and 3 identify a healthy joint, we found 17 true positive cases, 31 true negative cases, 6 false positive cases, and 24 false negative cases, when compared with USS. Choosing different cut off points at which a finger is considered inflamed, different sensitivities and specificities were obtained (fig 4). The same was performed using the six other classifiers (dashed lines in fig 4). Assuming that a joint is inflamed if Min(μa) >0.210 cm−1, we receive a sensitivity of 0.638 and specificity of 0.6.

ROC curves with ultrasound scores of 0—unaffected and 3—affected as diagnostic reference (case B) compared with ROC curves with ultrasound scores of (0, 1)—affected and (2,3)—unaffected as diagnostic reference (case A). The numbers in brackets are the area under the curve (AUC). Also given for each curve are the cut off values that result in the largest Youden index.
In all these cases, the area under the ROC curve (AUC) was between 0.65 and 0.66. Better AUCs were obtained when instead of assuming a score of 0 and 1 as unaffected and 2 and 3 as affected, only cases of USS = 0 were considered as unaffected and USS = 3 as affected. Of the 78 fingers, 18 had a USS of 3 and 11 joints were scored 0. Table 2 shows the mean values, standard errors, and p values. Statistically significant differences were observed for operator score, Min(μs), Min(μa), Min(μs)/Max(μs), and Min(μa)/Max(μs). Although the p values are similar to those in table 1, the ROC curves have improved considerably (fig 4): the AUC for operator score, Min(μs), and Min(μa) have improved from 0.657, 0.660, and 0.654, to 0.716, 0.777, and 0.742, respectively.
Various optical measures for finger joints that received a US score of 3 (affected by RA) and 0 (unaffected by RA)
A similar analysis using the CSS as diagnostic reference was performed for Min(μa). Only five fingers received a CSS = 3, and 34 fingers received a score of 0. The mean (SE) value for the affected joints (CSS = 3) was Min(μa) = 0.268 (0.056) cm−1 and for the joints with CSS = 0 we obtained Min(μa) = 0.159 (0.021) cm−1 (p = 0.038). The AUC was = 0.744 compared with 0.680 in the case when CSS of 0, 1 were used to determine unaffected fingers and CSS of 2, 3 were used to identify affected fingers (ROC curve shown in fig 5).

ROC curves for Min(μa) classifier with clinical scores as diagnostic reference. The two cut off values identify points on the curve for which the Youden index is maximal.
The best sensitivity-specificity pair was obtained when Min(μa) was used as classifier and compared with USS as diagnostic reference. In this case we found a sensitivity and specificity of 0.705 each when Min(μa) = 0.272 cm−1 was used as threshold (dotted curve in fig 4) with a Youden index of 0.41. The same Youden index was found for a threshold of Min(μa) = 0.241 cm−1, for which the sensitivity slightly increased to 0.736, while the specificity decreased to 0.674.
DISCUSSION
This study aimed at finding classifiers for SLOT images that can be used to distinguish PIP joints with synovitis from joints without synovitis in patients with RA. In previous case studies we had observed that SLOT images of joints without clinical signs of synovitis showed a clear decrease of scattering and absorption coefficients in the joint cavity, whereas joints with synovitis did not display this marked decrease.27,28 We now recruited 13 patients with active RA, and obtained images of 78 PIP joints affected by synovitis to differing degrees. Besides SLOT all joints were evaluated by CE and US to provide two diagnostic references.
The first important observation was that US classified more than twice as many joints (37 joints) as affected by synovitis than CE (16 joints). Similar discrepancies have been observed before by other groups that compared US and CE on finger,9,10 shoulder,39 and knee joints.40 In all these studies CE classified a smaller number of joints with synovitis than US.
Among the seven different classifiers that we chose from the SLOT images, we found five (operator score, Min(μa), Min(μs), Min(μa)/Max(μa), and Min(μs)/Max(μs)) that produced statistically significant differences between the mean values of affected and unaffected joints, with US as diagnostic reference. When CE was used as diagnostic reference only one classifier (Min(μa)) showed statistically significant differences in the mean between affected and unaffected joint.
Statistically significant difference of the mean is a necessary condition for a classifier to be clinically useful, but it is not a sufficient condition. The distribution of joints affected and not affected by synovitis may still show substantial overlap for a statistically significant classifier. To be clinically useful, the sensitivity and specificity for a certain cut off value of a classifier have to be high. Therefore, once classifiers were identified, we investigated the clinical use of these classifiers by ROC analysis. For all SLOT classifiers with significant differences in mean values, the AUC increased when a USS and CSS of 0 and 3, instead of 0, 1 and 2, 3 were used to classify joints. This appears logical because by omitting fingers from the statistical analysis that received scores of 1 or 2, we removed most cases that were borderline for involvement or non-involvement. The best sensitivity-specificity pair was achieved when Min(μa) was used as classifier and compared with US, giving a sensitivity and specificity of 0.705 each.
Overall, the results suggest that SLOT images agree better with US than with CE. The reason for this is not entirely clear. In this study, we chose to compare SLOT images with US because it is very sensitive in detecting soft tissue lesions (effusion and synovial hypertrophy).10 Inflammatory effusion is turbid owing to infiltration with inflammatory cells and thus differs from normal effusion, which appears as a clear and colourless fluid. Optical techniques are sensitive to these changes in the optical properties, as was shown in previous in vitro investigations.16–18 Furthermore, US is sensitive to hypertrophy of synovial membrane accompanied by neovascularisation. It is well known from breast and brain imaging studies that blood dependent variables strongly influence optical signals.27 Hence, tissue growth and neovascularisation within the joint increase scattering and absorption and amplify the optical effects caused by effusion. False positive SLOT readings may be caused by non-inflammatory effusion, which still would get a USS of 2 or 3, but may look unaffected on SLOT images, because the fluid in joint cavity may be clear, similar to that in an unaffected joint. Swollen finger joints detected by CE may be indicative of effusion as well as increased blood volume. Because both affect optical properties one would expect a higher level of agreement between CE and SLOT imaging than we achieved. But palpation may miss more subtle cases and may lead to false negative results.
Although some questions remain unanswered, these results clearly constitute an advance over previous optical imaging studies of finger joints. In contrast with earlier studies that relied on transmission profiles only,5,26 we demonstrated for the first time that classifiers can be found for SLOT images that show significant differences between affected and unaffected joints based on a single measurement. This shows the advantages of tomographic imaging over mere transmission measurements.
In general, we believe that different imaging methods as well as CE reflect multiple pathophysiological processes within the finger joints in different ways. Radiography is suitable for follow up evaluation of bone erosions, but insensitive for detecting early erosive lesions and soft tissue swelling. US has strength in detecting joint effusion and synovial hypertrophy, whereas it has difficulty in differentiating between inflammatory and non-inflammatory effusion.9 MRI is sensitive to active synovitis and early erosions.6–8 SLOT imaging, while providing the poorest spatial resolution, may be sensitive to all three aspects of RA, because effusion, hypertrophy, and erosion all lead to changes in optical properties. Although the results of the presented study support this hypothesis, further studies with improved instrumentation and larger patient groups are necessary to explore fully the contrast mechanisms and determine the ultimate clinical usefulness of SLOT. In this regard it will be useful to compare SLOT images with additional diagnostic references such as MRI. A clear separation of patient groups with different symptoms (for example, patients with only synovitis, patients with synovitis and effusion, patients with synovitis, effusion, and erosions) will also help to clarify contrast mechanisms in SLOT imaging. All this should lead to higher sensitivities and specificities that need to fall into the 0.85–0.95 range to support clinical use.
Furthermore, it will be of great interest to use SLOT to study additional joints that are of clinical importance, such as metacarpophalangeal joints. At this point it appears unlikely that SLOT imaging will replace US or MRI imaging in RA diagnostics. But, we believe that a SLOT imager may supplement the clinical armentarium of the rheumatologist in the future. SLOT, US, and MRI have different contrast mechanisms and sense different aspects of the disease. Therefore it appears that these different imaging modalities will complement each other, rather than make any of them obsolete.
In conclusion, we succeeded in identifying features in SLOT images that show a statistically significant difference between joints with and without synovitis. Unlike previous optical transillumination studies, we demonstrated for the first time that it is possible to classify a joint as inflamed using SLOT images without the need for a reference measurement. We confirmed that high absorption and scattering coefficients in and around the joint cavity are indicative of an inflammatory process. Furthermore, it was observed that SLOT based diagnosis of synovitis agrees better with diagnosis based on US images than on CE.
Acknowledgments
This work was supported in part by a grant from the National Institutes of Health (National Institute of Arthritis and Musculo-skeletal and Skin Diseases - R01 AR46255-03 principal investigator: A H Hielscher). In additon, Dr Scheel received grants from the Rheu-matology Competence Network and the Georg-August-University funding to perform the clinical study.