Article Text

Abstract
Objective: To develop and test an index to evaluate the radiographic changes that occur in the tarsus and adjacent areas of the foot in patients with spondyloarthropathies (SpA).
Methods: The spondyloarthropathy tarsal radiographic index (SpA-TRI) was developed in three consecutive steps: (a) detection of descriptors after reviewing 70 radiographic files; (b) descriptor gradation and subsequent modifications performed by a consensus committee, and (c) interobserver variability assessed by three blinded and independent observers on 272 radiographs: anteroposterior 118, lateral 90, oblique 64 from 121 patients with SpA, and intraobserver variability on 75 radiographs from 25 patients with SpA. Statistical analysis included percentage of agreement and κ test. SpA-TRI score ranges from 0 to 4 (0=normal; 1=osteopenia or suspicious findings; 2=definite joint space narrowing, bony erosion(s), periosteal whiskering, or enthesophyte(s) in the plantar fascia or Achilleal tendon attachments; 3=para-articular enthesophyte(s); 4=bony ankylosis (joint space fusion or complete bridging)).
Results: Complete agreement for every evaluation was >40%, and discordance >1 grade was <15%. The κ scores among the three observers were acceptable for all the single projections: oblique (0.52, 0.36, 0.35), lateral (0.50, 0.42, 0.56), and anteroposterior (0.40, 0.41, 0.21) views. The combination of lateral and oblique views achieved the highest concordance rates (0.72, 0.33, 0.66), surpassing that of the three projections altogether (0.34, 0.58, 0.37). In every case the concordance was comparable with that of sacroiliac joints (0.47, 0.41, 0.34); intraobserver concordance showed a similar trend.
Conclusion: The SpA-TRI is an index that includes the most prominent features of tarsal disease and adjacent areas of the foot in SpA and grades them accordingly, it has an adequate reproducibility, and is suitable for use with two or more projections, preferably the combination of oblique and lateral.
- spondyloarthropathy
- radiographic index
- tarsal joint
- AS, ankylosing spondylitis
- MRI, magnetic resonance imaging
- SpA, spondyloarthropathies
- SpA-TRI, spondyloarthropathy tarsal radiographic index
Statistics from Altmetric.com
- AS, ankylosing spondylitis
- MRI, magnetic resonance imaging
- SpA, spondyloarthropathies
- SpA-TRI, spondyloarthropathy tarsal radiographic index
The spondyloarthropathies (SpA) are a group of inflammatory diseases increasingly detected in rheumatological practice. Environmental and genetic factors have been implicated in both the clinical presentation and course of SpA and influence the clinical picture in different ethnic groups and world regions.1
In the Mexican mestizo the SpA have several distinctive features2: over a half of the patients have juvenile onset; they tend to have a severe course3; most of them develop ankylosing spondylitis (AS); and apart from the axial involvement there is also a high incidence of inflammation of the joints and enthesis of the lower limbs, particularly the mid-foot and tarsus.
Mid-foot involvement or tarsitis consists of diffuse and persistent swelling extending from the ankle to metatarsophalangeal joints; in its acute stage it has a major role in the temporal disability and discomfort. In the chronic stages, tarsitis causes structural damage and impairment, permanently worsening the functional outcome. Severe tarsitis is also detrimental in the prognosis of patients by predisposing to chronic disease and relapses,3a, 4 and perhaps to a higher incidence of AS. Patients with severe disease may additionally develop a form of tarsal fusion resembling the spine of patients with AS, which is therefore called by our group ankylosing tarsitis5 (fig 1). Magnetic resonance imaging (MRI) in patients with SpA with foot involvement may show bone oedema, enthesophytosis, and erosions of the joint cartilage of most tarsal bones and joints.

Lateral view of the right foot of a 33 year old, B27+ male patient with diagnosis of AS and ankylosing tarsitis. As can be noted, there is complete obliteration of spaces between the joints, forming a single tarsal mass, which includes metatarsal joints (grade 4); in addition, bone proliferation tracts are detectable extending over the surface of several bones (arrows), suggesting a role for periosteal proliferation and remodelling.
Inflammation of the entheses in the active stage and then subsequent ossification and enthesophytosis characterise the long term involvement of the spine and sacroiliac joints in patients with AS. Besides clinical evaluations, various methods may objectively assess the radiographic aspect of sites affected by the disease. With the exception of the hips, the effect of long term bone, joint, and entheseal changes at extraspinal sites has been rarely studied.
Besides our approach to the clinical evaluation,6 we have now developed an index to evaluate the radiographic damage—the spondyloarthropathy tarsal radiographic index (SpA-TRI)—in patients with SpA to complete a systematic assessment of the foot and particularly of tarsitis. Because the SpA-TRI will be applied to patients with SpA, we intended to maintain a scoring system similar to that of other widely accepted radiographic indexes for SpA, specifically, the sacroiliac joint score of the New York AS criteria,7 and the Bath AS radiographic indexes for the spine BASRI-s8 and for the hip BASRI-h.9
PATIENTS AND METHODS
The study included the radiographic files of patients with a diagnosis of AS,9a reactive arthritis,9b and undifferentiated SpA,9c irrespective of age at disease onset or tarsitis history. To be included in the study, files should have at least two of the three different projections of the feet: anteroposterior, lateral, and oblique. Additionally, sacroiliac radiographs were reviewed in parallel with feet evaluations.
Tarsal radiographic index (SpA-TRI) development
Three different stages were considered during the SpA-TRI development. Firstly, two investigators (CP-T and JDL) evaluated 70 radiographic sets to outline both the normal and abnormal aspects of each joint and tarsal bone on different projections. The purpose of this first evaluation was to identify morphological changes which could be easily recognised by anyone familiar with bone and joint radiology and included as SpA-TRI descriptors. Each of the two investigator's evaluations was made independently from the other; and discrepancies were solved by agreement after both investigators re-reviewed the films together.
In the second stage a committee assessed the appropriateness of the descriptors in representative radiographs. Afterwards, an initial version of the SpA-TRI was built by consensus (CP-T, JDL, JC-B, RB-V, CP). A major criterion for the SpA-TRI construction was to give a higher score to descriptors outlining more chronic or severe changes.
In the third stage, the preliminary scores were tested on a limited set of radiographs and the performance of the index was reviewed by the committee to detect factors causing inconsistency, and to modify the scale by consensus. Three different versions of the SpA-TRI were built. In the first version, grade 3 was defined by tarsal ankylosis in the distal tarsus (intercuneiform, naviculocuboid, and/or cuneocuboid), but no involvement of the proximal tarsal joints (talocalcaneal, talonavicular, and calcaneocuboid); and grade 4 was outlined by ankylosis in such joints.
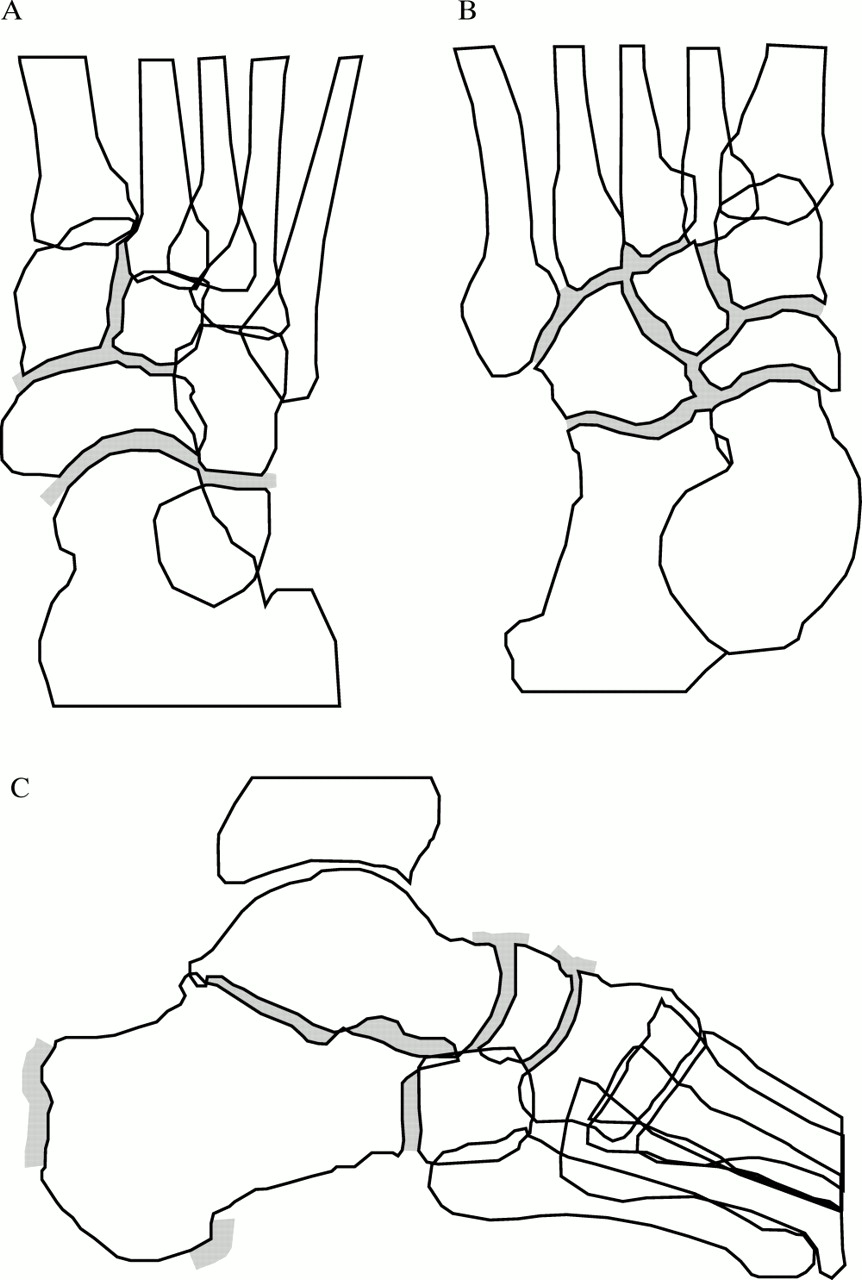
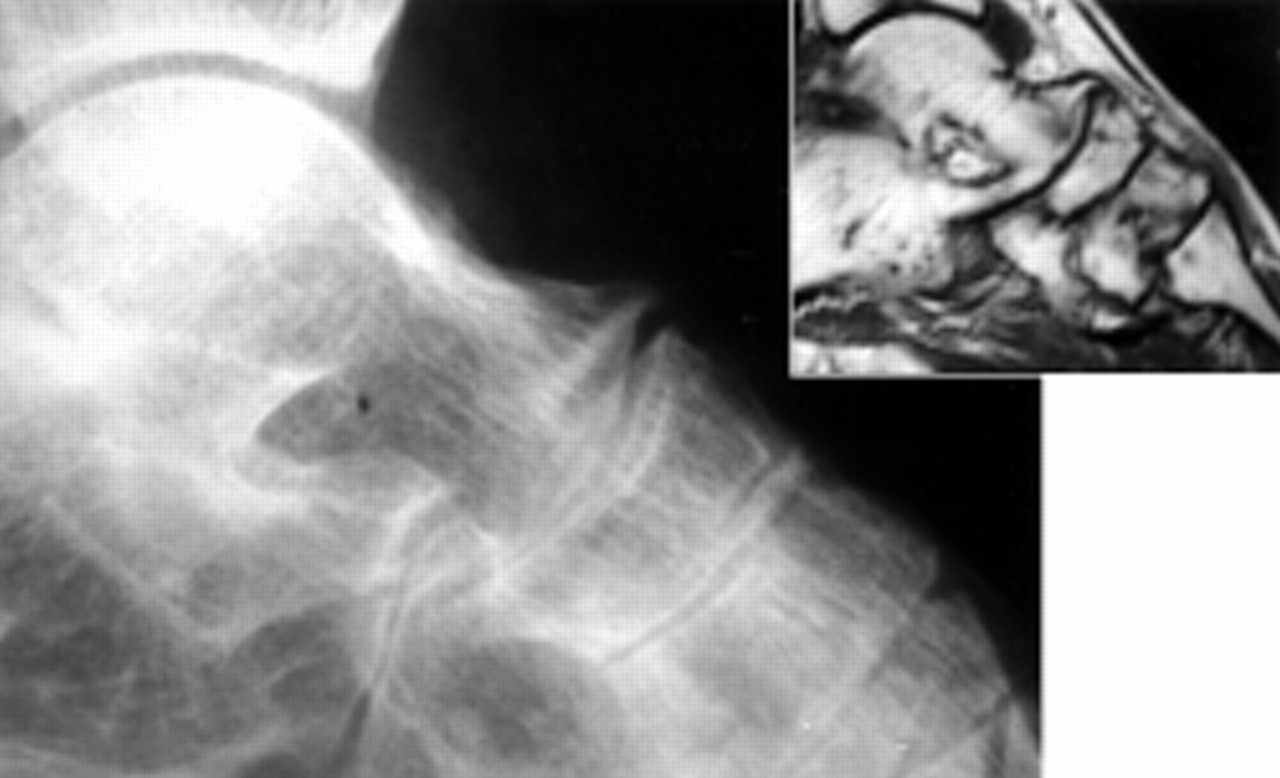
In the second version of the scale, grade 3 was defined by a particular form of bony proliferation, which presumably precedes ankylosis (fig 2), and grade 4 was defined by ankylosis, regardless of its location or extension. In the third and final version the descriptors remain unchanged and selected tarsal joints and structures were chosen for their assessment in every radiographic projection (CP-T, JDL).

Radiographic and MRI lateral aspect of the left foot of an 18 year old, HLA-B27+ male patient, showing joint space narrowing and particularly enthesophyte (grade 3) extending from the astragalus to the navicular bone. The MRI was obtained on the same day as the radiograph, and demonstrates the actual extension of the enthesophyte, showing the formation of a complete bridge.
SpA-TRI validation
The complete set of films was reviewed blindly and independently by three observers and graded in agreement with the SpA-TRI. Two observers (CP-T and JC-B) were involved in the previous steps; the other (JFM) is a rheumatologist without previous knowledge of the scale. To assess intraobserver variability 25 files (three films each) were randomly selected and independently reviewed.
SpA-TRI description
The items that are included in the SpA-TRI are osteopenia, joint space narrowing, bony erosions, periosteal whiskering, non-para-articular enthesophyte (Achilleal or plantar fascia attachments), para-articular enthesophyte, and bony ankylosis (complete bridging or joint space fusion). Grading ranges from 0 (normal) to 4 (ankylosis). Table 1 presents a complete description of the SpA-TRI and figs 1, 2, and 3 show examples of the descriptors.
Scale for feet evaluation, grading, and descriptors

Oblique view of the right foot of a 35 year old, B27+ female patient, with diagnosis of undifferentiated SpA and severe recurrent tarsitis (grade 3) that shows (A) a complete view of the proximal and mid-tarsal structures, displaying some descriptors of SpA-TRI; (B) joint space narrowing (1), and erosions (2); (C) para-articular enthesophyte (3) and periosteal whiskering (4).
Areas of interest in the feet should be evaluated in different projections. Thus the anteroposterior projection is best for evaluating talonavicular, calcaneocuboid, cuneonavicular, and the intercuneiform joints (medial and intermediate cuneiforms); the lateral view is best for subtalar, talonavicular, calcaneocuboid, and cuneonavicular joints, and the Achilleal and plantar fascia tendons attachments; and the oblique view is best for the talonavicular, the calcaneocuboid, the naviculocuboid, and intercuneiform joint (intermediate and lateral cuneiforms), and tarsometatarsal joints. In all three projections the periosteal blurring and erosions can be scored. Figure 4 presents a summary.
Proposed joints and structures to be evaluated in the different tarsal radiographic projections. (A) Anteroposterior; (B) oblique; (C) lateral.
Each radiographic projection is independently scored and the highest score prevails (akin to sacroiliac scoring, each foot has its own score). When there is a discrepancy in a specific joint between two projections, the observer selects the one with more accurate detail.
Statistical analysis
The concordance was evaluated with the κ coefficient and with the percentage of complete agreement; the statistical package used for the analysis was SPSS version 9.0 (SPSS Inc, Chicago, IL, USA.).
RESULTS
Two hundred and seventy two sets of radiographs, including 118 anteroposterior, 90 lateral, and 64 oblique foot projections from 121 patients were reviewed. Sixty five (54%) patients had diagnosis of AS, 47 (39%) undifferentiated SpA, and nine (7%) reactive arthritis. Ninety one patients were male and 30 female; 61 had adult onset and 60 juvenile onset disease.
Interobserver concordance rates for most projections and for the combination of different projections were satisfactory, but the range was wide; table 2 presents the κ scores and percentage of complete agreement. The percentage of disagreement ≥1 degree was consistently <20%, and that ≥2 degrees <10%. The anteroposterior view had the lowest concordance rates (40–55%); we found that disagreement between grades 0 and 1–2 explained around 80% of the discordance, and 50% (of the total) were within grades 0 and 1, making it difficult to evaluate osteopenia of the proximal tarsus in the anteroposterior view.
SpA-TRI concordance between observers, with different feet projections and combinations, κ score (percentage of agreement)
For the oblique and lateral views, the observed concordance rates were 50–63% for the former and 57–70% for the latter. Around 75% of the discordant readings in either projection were again clustered between grades 0, 1, and 2. In contrast with the anteroposterior projection, 55% of all discordances for the oblique projection, and 47% for the lateral view, were between grades 1 and 2; we feel that this is probably due to the difficulty in measuring precisely subtle radiographic changes in those projections. Fortunately, lower discordance was detected within grades 3 and 4, which in our opinion, are the most important elements of the scale because they relate to patients with more severe or chronic disease.
To define which projections should be included we analysed different combinations of two or the three different projections. Higher concordance rates were achieved with a combination of lateral and oblique projections (table 2). The anteroposterior view conferred a variability on the results either in combination with the oblique or lateral view, or with both; we could not detect a systematic error that explained such inconsistency. The reduced field needed for analysis in the anteroposterior view improved its usability, and its inclusion is recommended by the authors when talonavicular or cuneonavicular involvement is detected, because these joints are commonly affected and the anteroposterior view provides an angle not covered by the other projections.
The observed intraobserver κ values were concordant with those found in the interobserver stage: the anteroposterior view received the lowest values (κ 0.51, 0.56, 0.40; observers 1, 2, and 3, respectively), followed by the oblique view (0.51, 0.53, 0.61), and the lateral view had the best values (0.81, 0.68, 0.65). When the three projections were combined the intraobserver κ scores for the SpA-TRI (0.61, 0.58, 0.52) were comparable with those of the sacroiliac joints (0.58, 0.66, 0.47). Complete agreement was greater than 50% in any projection and any combination of projections.
DISCUSSION
We have developed a valid and reliable method for assessing radiographic damage in patients with SpA, in whom the foot and, particularly the tarsal joints, are affected. SpA-TRI includes as descriptors the most relevant radiographic findings observed in tarsitis: osteopenia, joint space narrowing, bony erosions, periosteal whiskering, enthesophytes, and bony ankylosis.
As shown by our results, SpA-TRI reproducibility is comparable with that of the sacroiliac joint score, for which in this study we obtained similar results to those described in other papers.10, 11 A similar concordance range is also achieved for BASRI as reported by other authors.11 Rheumatologists rapidly familiarised themselves with the SpA-TRI and obtained acceptable concordance scores; this concordance represents the performance of the scale expected in normal clinical practice, but its performance in specialised clinics might be higher.
The prevalence of tarsitis among patients with SpA attending our clinic, may reach 64.9% in AS and 78.1% in juvenile onset AS.12 Tarsal involvement (especially the severe forms) has been linked to juvenile onset SpA,13, 14 but may also be seen in adult onset undifferentiated SpA and reactive arthritis. The estimated prevalence of tarsitis (at least in isolated episodes) in our whole SpA group is up to 80%, and 50% in adult onset undifferentiated SpA.3a
The SpA-TRI development considered the frequency, morphology, and relevance of structural changes at specific sites of the foot, particularly the tarsus. For this reason, it includes in grade 1 osteopenia and “suspicious” findings. The descriptors for grade 2 are erosions, periosteal whiskering, non-articular enthesophytes, and joint space narrowing. No extension of such findings was made; noticeable erosive and proliferative changes are often detected on the calcaneal attachments of the Achilleal as well as plantar fascia tendons, but the correlation of the intensity of such changes with tarsal ankylosis observed in our series is poor. Another reason for not counting bone erosions or joint space narrowing is the difficulty of such a task and, additionally, the incidence of isolated erosions and monarticular joint space reduction is so low (∼15%) that this indication would be an unnecessary complication of the index, impairing its usability and consistency.
Evaluation of the whole tarsus in any of the evaluated projections gave unsatisfactory results. To overcome this problem we carried out each projection separately, and thus determined the cause of the inconsistency. Results from the lateral and oblique projections were acceptable, but those from the anteroposterior view were unsatisfactory initially. Our main concern about the anteroposterior view was that it produced a large number of images suggesting ankylosis of the intercuneiform (intermediate and lateral cuneiforms) joint and in the third to the fifth tarsometatarsal joints. Such findings were in disagreement with the images seen on the oblique view, where these areas can be analysed in more detail. Consequently, the usefulness of the anteroposterior view was confined to the very proximal tarsus. The lateral projection allows an excellent view of the calcaneal attachments of both the Achilleal tendon and the plantar fascia, as well as allowing detailed examination of the subtalar joint and the relation between the talar, calcaneus, navicular, and cuboid bones. The oblique view offers the clearest image of the mid-tarsus. No importance was placed on the changes seen in the metatarsophalangeal or interphalangeal joints, although erosive changes were seen in ∼15%, because their correlation with tarsal erosive or ankylosing changes is poor. Changes in the metatarsophalangeal or interphalangeal joints seem to correlate better with proliferative and erosive changes in calcaneus tendon attachments (Achilleal/plantar fascia).
The SpA-TRI score correlates with the global picture of tarsus damage. Most patients with grade 2 also fulfilled criteria for grade 1, and so on. This was true in >90% of evaluated cases for grades 1, 2, and 3. All patients with grade 4 fulfilled also the criteria for grade 2 and 30% for grade 3; so the higher the score, the higher the overall accumulated damage. Grade 3 is a special case within this scale as it is defined by the para-articular enthesophyte and was introduced only in the last version of the SpA-TRI. We think it represents an intermediate stage between the erosive changes and joint space reduction, on the one hand, and bone bridging and eventual ankylosis, on the other; thus it is considered to be a morphological finding that might eventually be used for diagnosis (fig 2), allowing the recognition of early ankylosing tarsitis. All radiographs with grade 3 fulfilled also the criteria for grade 2, confirming the progression, but nevertheless the incidence of grade 3 in the sample is low (anteroposterior 2.1%, lateral 9.2%, oblique 2.0%). This might be explained by the fact that it is a temporary stage in the progression towards ankylosis.
Grade 3 is seldom seen in grade 4 projections, and there are two possible explanations. Firstly, some processes of ankylosis do not involve peripheral enthesis proliferation, but produce complete joint space obliteration. Secondly, those cases of ankylosis explained by bridging are automatically disqualified from grade 3. Grade 3 is much more clearly seen in the lateral projection, possibly because the commonest location of para-articular enthesophyte is in the talonavicular and cuneonavicular joints. Similar proliferative changes have been described in diseases associated with bony proliferation as a response for mechanical load, especially diffuse idiopathic skeletal hyperostosis (DISH)15 and, rarely, osteoarthritis.16 In our patients a mechanical stimulus may be present as well. However, the fact that tarsal ankylosis in our patients mirrors similar changes in the axial skeleton, that the disease begins before the age of 30, that our patients share a common genetic background with the rest of the SpA (>80% HLA-B27+) and, more importantly, the fulfilment of the ESSG criteria makes the differential diagnosis easy. The SpA-TRI includes radiographic descriptors that can be detected in several arthropathies; the grading rationale may be applied as well (that is, ankylosis is more severe than erosions, erosions are more severe than osteopenia, etc), but chronic and progressive tarsitis is a key feature in the SpA and not in other common arthropathies.
The SpA-TRI will be used for an assessment of the evolution of the tarsal impact in patients with SpA. Our current radiographic files did not allow a longitudinal follow up so this will be achieved prospectively. Also, a detailed correlation of the radiographic findings with those found at the same time by MRI is currently being carried out.
The use of the SpA-TRI in other SpA clinics is encouraged by the authors. This will help to ascertain variation in the frequency and severity of tarsal involvement among other populations (and specific SpA). It is an additional instrument for the evaluation of patients with SpA.