Article Text

Abstract
Objectives To compare the CT Syndesmophyte Score (CTSS) for low-dose CT (ldCT) with the modified Stoke Ankylosing Spondylitis Spine Score (mSASSS) for conventional radiographs (CR) in patients with ankylosing spondylitis (AS).
Methods Patients with AS in the Sensitive Imaging in Ankylosing Spondylitis cohort had lateral cervical and lumbar spine CR and whole spine ldCT at baseline and 2 years. CR and ldCT images were scored by two readers, paired by patient, blinded to time order, per imaging modality. For the total score analysis, we used average scores of readers per corner on CR or quadrant on ldCT. For the syndesmophyte analysis we used individual reader and consensus scores, regarding new or growing syndesmophyte at the same corner/quadrant.
Results 50 patients were included in the syndesmophyte analysis and 37 in the total score analysis. Mean (SD) status scores for mSASSS (range 0–72) and CTSS (range 0–552) at baseline were 17.9 (13.8) and 161.6 (126.6), and mean progression was 2.4 (3.8) and 17.9 (22.1). Three times as many patients showed new or growing syndesmophytes at ≥3 quadrants on ldCT compared with ≥3 corners on CR for individual readers; for consensus this increased to five times. In 50 patients, 36 new or growing syndesmophytes are seen on CR compared with 151 on ldCT, most being found in the thoracic spine.
Conclusions ldCT, covering the whole spine, detects more progression in the form of new and growing syndesmophytes in patients with AS compared with CR, which is limited to the cervical and lumbar spine. Most progression occurred in the thoracic spine.
- ankylosing spondylitis
- outcomes research
- spondyloarthritis
Statistics from Altmetric.com
Introduction
Ankylosing spondylitis (AS) is a disease with progressive structural damage of the spine, mainly characterised by the development of syndesmophytes, which is associated with impairment of spinal mobility and functional disability.1–3 Currently, structural damage is assessed on conventional radiographs (CR), using the modified Stoke Ankylosing Spondylitis Spine Score (mSASSS).4 In this score, lateral CRs of the cervical and lumbar spine are assessed for new bone formation, as well as for erosions, sclerosis and squaring. This method has a scoring range of 0–72, with a mean progression score over 2 years of 2.1 if scored with known chronology and of 1.0 if scored without known chronology.5 The shortest period to reliably assess progression using the mSASSS is 2 years, which limits the applicability of this method in research (eg, medication trials).6
Due to technological advances, it is now possible to perform CT of the spine with the relatively low radiation dose of 4 mSv (low-dose CT (ldCT)).7 With ldCT it is possible to assess the entire vertebral column, thus including the thoracic spine, which doubles the number of available vertebrae. It is known both from CR and MRI that many abnormalities are seen in the (lower) thoracic spine.8 Moreover, on ldCT vertebrae can be viewed from multiple angles and without overprojection. These advantages of ldCT could make it a more sensitive method for the assessment of radiographical progression in AS and lead to a reliable measurement of progression over a period shorter than 2 years. This would make research in AS, with structural damage as an outcome, more feasible.
Recently, the CT Syndesmophyte Score (CTSS) for the analysis of bone proliferation has been developed for ldCT.7 This method has been shown to have good inter-reader reliability and sensitivity to pick up changes. The next step in the validation process is the comparison of the CTSS and the mSASSS for the assessment of structural progression in AS.
Methods
Study population
For this study data from the Sensitive Imaging in Ankylosing Spondylitis (SIAS) cohort were used. This is an observational cohort including 60 patients with a diagnosis of AS and fulfilling the modified New York criteria from the Netherlands and Germany.9 The follow-up period was 2 years. Inclusion criteria were age 18 years or older, at least one syndesmophyte in either the cervical or lumbar spine on lateral CR, and at least one inflammatory lesion on MRI of the whole spine. All treatments were allowed according to the treating rheumatologist. Exclusion criteria were >18 vertebral corners (VCs) affected by syndesmophytes in the cervical and lumbar spine combined, circumstances that would invalidate informed consent or limit the ability of the patient to comply with protocol requirements, routine MRI contraindications and pregnancy. Clinical data and MRI of the whole spine were collected at baseline, 1 and 2 years. Lateral CR of the cervical and lumbar spine and ldCT of the whole spine with coronal and sagittal reconstructed images were obtained at baseline and 2 years.7 For the present study patients were included if CR and ldCT were present at baseline and 2 years. The study fulfilled the Good Clinical Practice guidelines. Before inclusion, written informed consent was obtained from all patients.
Scoring methods
The two scoring methods are presented in table 1. For CR this was the mSASSS, scoring two anterior VCs per vertebral unit (VU) of the cervical and lumbar spine on a lateral view (12 VUs in total).4 The total score ranges from 0 to 72. For ldCT, the anterior and posterior quadrants of the cervical, thoracic and lumbar spine were scored in coronal and sagittal planes (23 VUs in total), scoring eight quadrants per VU.7 The total score ranges from 0 to 552. In order to compare bone formation between CR and ldCT, levels were defined per VU. Level 1 refers to the upper border of a VU (which is the lower half of the vertebra) and level 2 to the lower border of the VU (which is the upper half of the vertebra). For CR every level incorporates one corner, for ldCT every level incorporates four quadrants.
Description of the mSASSS and CT scoring methods
CR and ldCT were scored independently in separate sessions by two trained readers (RvdB and FdB). Images for the two time points were paired by patient, blinded to time order, patient information and the other imaging technique. LdCT reconstructed images were performed by the CT technicians in the sagittal and coronal planes.
Comparison of mSASSS with CTSS
Average scores of both readers per VC for CR and per quadrant for ldCT were used. If one reader indicated a VC or quadrant as missing, the score of the other reader was used. Patients were only included if ≥75% of the VCs or quadrants per spinal segment (ie, cervical, thoracic and lumbar) were present. For CR, this meant a maximum of three missing VCs for the cervical and lumbar spine separately. For ldCT, this meant a maximum of 12 missing quadrants for the cervical and lumbar spine separately and 22 for the thoracic spine. Missing scores, after applying the previous two rules, were imputed using a method previously described by Ramiro et al.10 Briefly, if the 2-year status score was missing, the mean spinal segment progression score (ie, based on the present VCs/quadrants in the same segment) was added to the baseline status score of the same corner/quadrant and ensuring that a score of 3 (maximum score per VC/quadrant) would never be surpassed. Similarly, for baseline missing scores, the mean spinal segment progression score was subtracted from the 2-year VC/quadrant score ensuring that the minimum value possible was 0 and also ensuring 0 was considered for baseline when the same VC/quadrant had a score of 0 at 2 years. If a score was missing at both time points, the average spinal segment score per time point was used for that VC/quadrant for baseline, followed by the imputation of the mean segment progression to obtain the 2-year score, as previously explained. Progression scores were calculated by subtracting the baseline status score from the 2-year status score. This was done for the whole spine as well as per spinal segment. The net number of patients with progression above 0, 0.5 or the smallest detectable change (SDC) were calculated by subtracting the number of patients with a change score <0, <−0.5 or <−SDC from the number of patients with a change score >0, >0.5 or >SDC.
Comparison of syndesmophytes on CR and ldCT
For this analysis, there was no requirement regarding the minimum number of VCs or quadrants present. Scores from separate readers and a consensus score were used. Consensus was present if both readers agreed on a new or growing syndesmophyte at the same VC or quadrant. For the definitions of new or growing syndesmophytes for CR and ldCT, see table 1. The formation of new syndesmophytes and growth of syndesmophytes were compared per level. Therefore, a patient had four times the chance of showing a new or growing syndesmophyte per level on ldCT compared with CR. Three separate analyses were performed for this comparison. The first analysis compared the number of patients with syndesmophyte formation or growth per reader, and for the consensus score taking all levels together. The second analysis also focuses on the number of patients with syndesmophyte formation or growth; however, this is now analysed per level. The third analysis focuses on the number of new or growing syndesmophytes (and thus not of patients) per level based on the consensus score. The analyses were performed separately for newly formed syndesmophytes, for growth of syndesmophytes only, and for the combination of newly formed and growth of syndesmophytes.
Statistical analysis
Disease characteristics were assessed using descriptive statistics. Interobserver reliability was assessed for both CR and ldCT by Bland-Altman plots and SDC, and additional reliability assessments (eg, intraclass correlation coefficient (ICC)) have been presented in the manuscript on the development of the CTSS.7 11 The SDC is the smallest change that can be detected beyond measurement error and was calculated as follows: SDC=1.96×SDdiff/(√k×√2).12 SD is the standard deviation of the difference in progression scores between two readers, and k is the number of readers. Comparisons of the number of patients with new or growing syndesmophytes on CR versus ldCT per reader and for the consensus score are presented as a heatmap, showing results of all individual spinal levels. In a similar way, the new and growing syndesmophytes are presented. The corresponding progression score of the mSASSS and CTSS per patient is presented by a double probability plot. All analyses were performed using STATA SE V.14.
Results
Of the 60 patients in the cohort, a total of 51 had both CR and ldCT at baseline and 2 years (figure 1). Because of exclusion of patients due to missing VCs or quadrants, 37 patients were included in the comparison of mSASSS and CTSS. Reasons for these missing VCs on CR were the inability to score the lower four cervical VCs due to overprojection (n=6) or the absence of CR of either the cervical or lumbar spine (n=3). Reasons for the missing quadrants on ldCT were either bad quality of the ldCT (n=3) or missing cervical spine (n=2). In the comparison of syndesmophytes, 50 patients were included (figure 1).
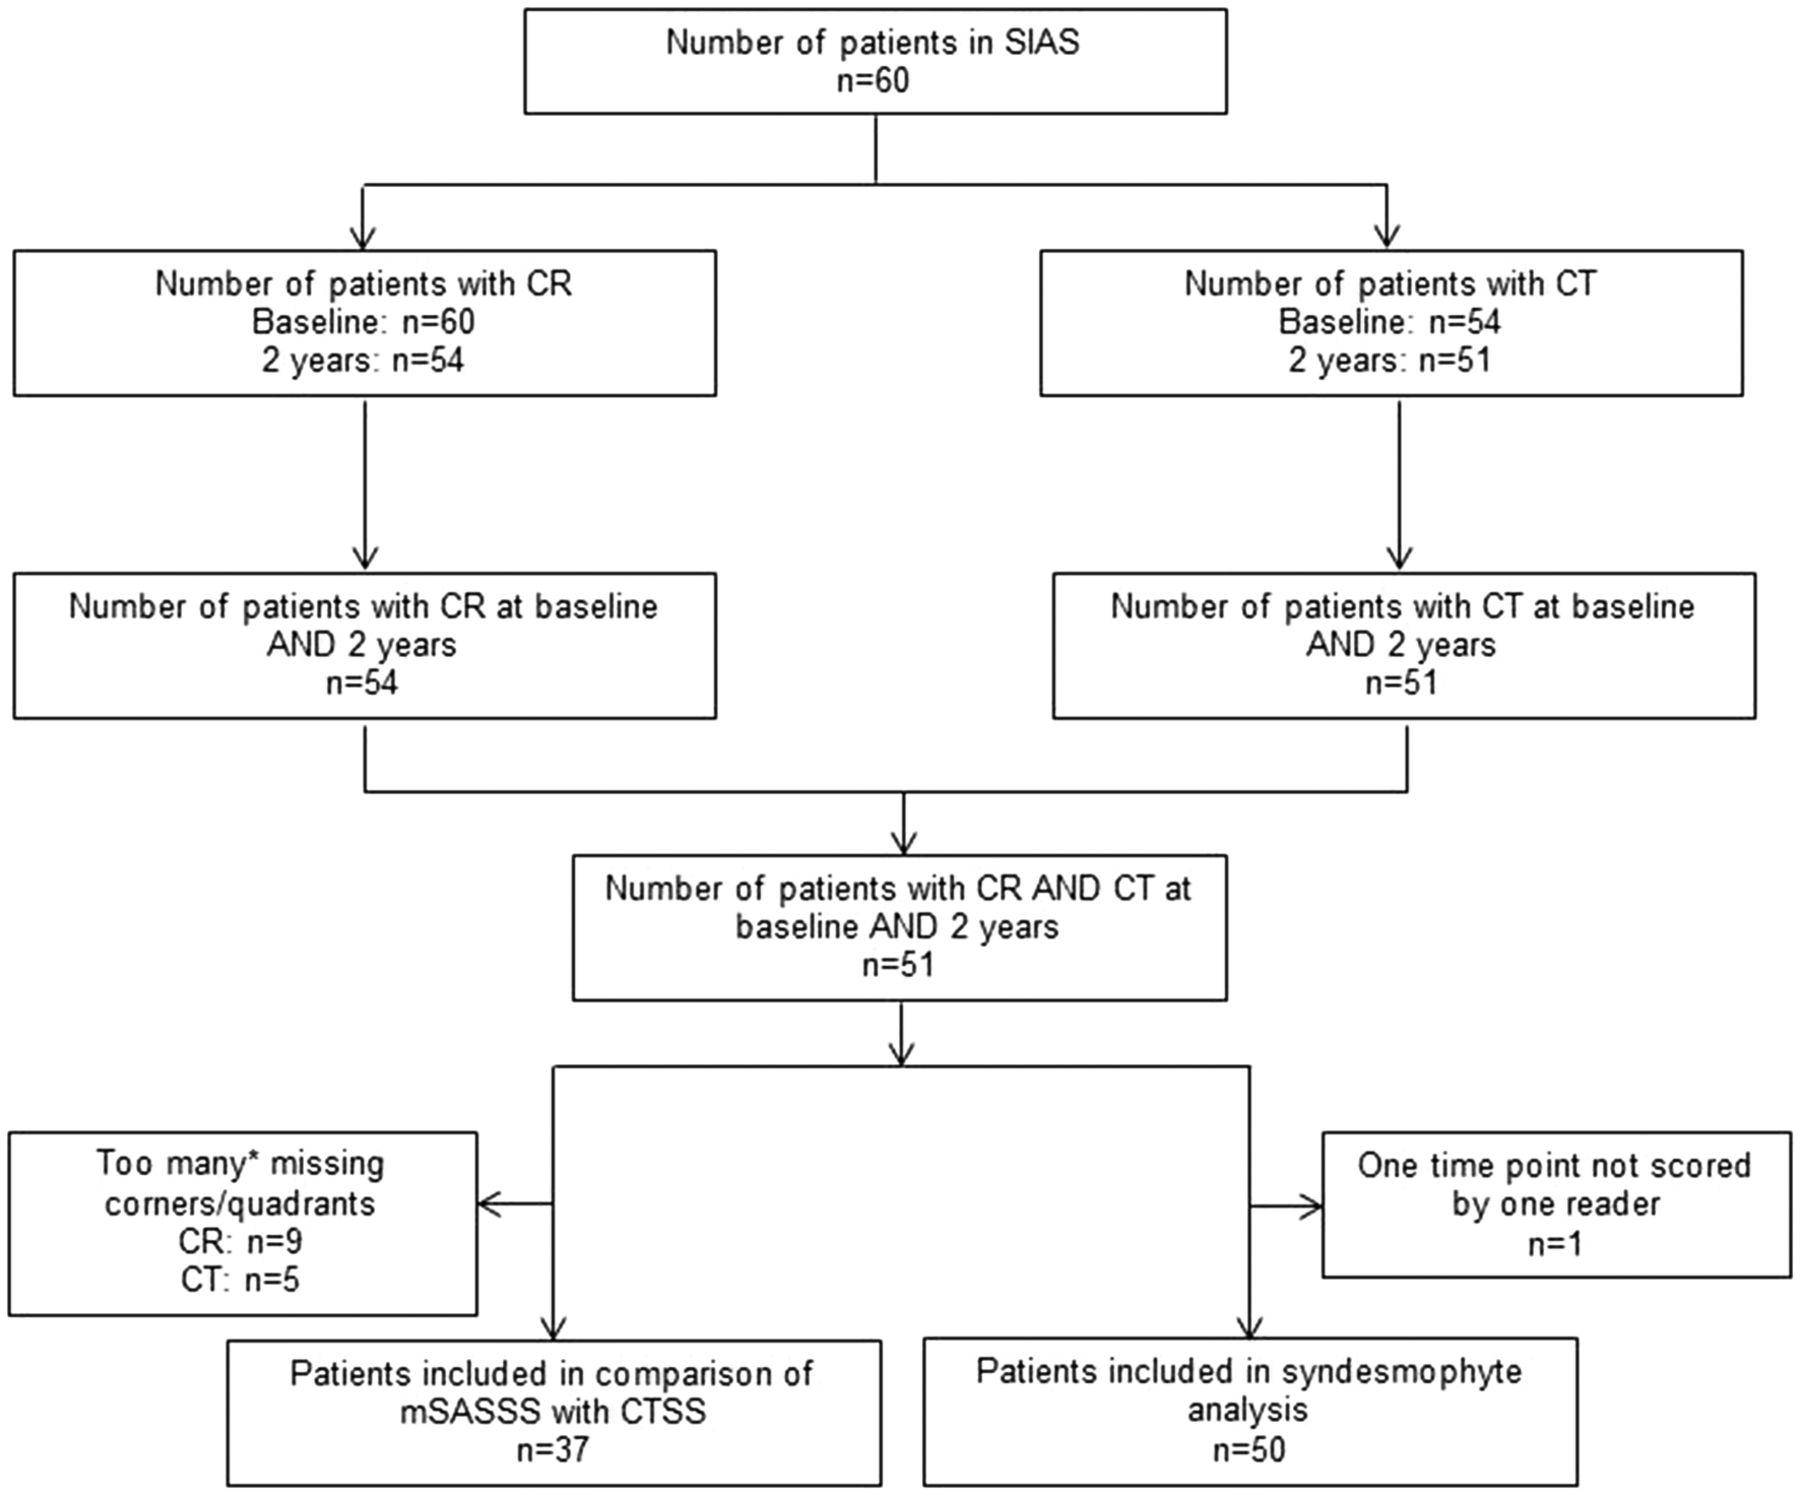
Flow chart for the analysis of syndesmophytes on CR and CT. *>25% of the corners/quadrants of the cervical thoracic or lumbar spine missing. CR, conventional radiography; CTSS, CT Syndesmophyte Score; mSASSS, modified Stoke Ankylosing Spondylitis Spine Score; SIAS, Sensitive Imaging in Ankylosing Spondylitis.
Baseline demographics and clinical characteristics are summarised in online supplementary table 1. The following were the characteristics of the patients included in the syndesmophyte analysis: 84% male, mean age of 50 years (SD 9.8), 86% were human leukocyte antigen (HLA-)B27-positive, 38% had elevated C reactive protein, mean Ankylosing Spondylitis Disease Activity Score (ASDAS) was 2.5 (SD 1.2), 62% used non-steroidal anti-inflammatory drugs, 26% used disease-modifying antirheumatic drugs and 22% used tumour necrosis factor alpha blockers. For patients included in the comparison of mSASSS and CTSS, the characteristics were similar (see online supplementary table 1).
Supplementary file 1
Comparison of mSASSS with CTSS
The mean mSASSS status score at baseline was 17.9 (SD 13.8) and the mean progression was 2.4 (SD 3.8). The mean CTSS status score at baseline was 161.7 (SD 126.6) and the mean progression was 17.9 (SD 22.1). The mean status and progression scores for all patients for whom the mSASSS (n=45) and CTSS (n=46) could be calculated were similar to the values of patients included in the analysis. Data for separate groups and spinal segments are presented in online supplementary table 2.
Bland-Altman plots of the progression scores for CR and ldCT showed that the data were homoscedastic; there was however a small systematic error for both CR and ldCT. Reader 2 scored on average 0.37 points lower on CR and 1.75 points higher on ldCT compared with reader 1. The SDCs were 3.8 and 14.6 for CR and ldCT, respectively.
Table 2 presents the patients showing a change (positive, negative or net) according to various cut-offs (ie, 0, 0.5 and SDC) for mSASSS and CTSS. Comparing any net change, a much higher percentage of patients showed positive change on ldCT versus CR (84% vs 46%, respectively). These numbers were similar for a cut-off of 0.5. However, using the SDC as cut-off, this difference disappeared (27% vs 32%, respectively). Figure 2 presents a double cumulative probability plot of the progression of mSASSS and CTSS scores of individual patients. For 33 out of 37 patients, progression scores were higher for CTSS compared with mSASSS, although the scales of the two scoring methods are different.

Cumulative probability plot of the progression of individual patients for mSASSS and CTSS (n=37). Average progression scores of the two readers for mSASSS and CTSS, ordered by mSASSS, are presented in a vertical line per patient. CTSS, CT Syndesmophyte Score; mSASSS, modified Stoke Ankylosing Spondylitis Spine Score.
Number of patients showing progression on CR or CT
Comparison of syndesmophytes on CR and ldCT
By comparing the number of patients with new and growing syndesmophytes on CR and ldCT for separate readers, it was clear that ldCT detected more patients with progression for both new formation and growth of syndesmophytes and for all cut-off levels (table 2). Also, with the strict consensus definition, this difference between CR and ldCT was present. It was especially apparent in case of growth and for cut-offs of a higher number of syndesmophytes per patient. For individual readers, three times as many patients showed any bony proliferation at ≥3 quadrants on ldCT compared with corners on CR. With the consensus definition, five times as many patients showed any bony proliferation at ≥3 quadrants on ldCT compared with corners on CR.
When comparing the number of patients with new or growing syndesmophytes per level, it was apparent that the largest number of patients showed this bony proliferation in the thoracic spine (figure 3; for actual values per level, see online supplementary table 3). This was evident for both the individual readers and for the consensus score. For the lumbar spine and the upper and lower sections of the cervical spine, more patients showed bony proliferation on ldCT than on CR when comparing scores for individual readers. This advantage of the ldCT was not present for the middle section of the cervical spine. When comparing the cervical and lumbar spine using the consensus score, the difference between CR and ldCT was still present, but much less obvious. As analysing the number of patients with bony proliferation is an insensitive method to detect differences between CR and ldCT, we subsequently analysed the number of new or growing syndesmophytes per level. We present this only for the consensus score.

Heatmap of the number of patients with a new syndesmophyte or growth of a syndesmophyte per corner/quadrant from the Sensitive Imaging in Ankylosing Spondylitis cohort (n=50) for individual readers and consensus. CR, conventional radiograph; L, level; NA, not applicable; VU, vertebral unit.
When comparing the number of new or growing syndesmophytes per level on ldCT and CR, more syndesmophytes were seen on ldCT on almost all levels (figure 4; for actual values per level, see online supplementary table 4). Consistent with the analysis on patient level, most syndesmophytes were seen in the thoracic spine. When combining the cervical and lumbar spine, 28 new syndesmophytes were seen on CR compared with 38 on ldCT. The difference was much larger for growing syndesmophytes, with 8 on CR compared with 29 on ldCT. When comparing all available levels on CR (cervical and lumbar) with ldCT (cervical, thoracic and lumbar), the difference was even larger, with 28 new syndesmophytes seen on CR as opposed to 104 on ldCT and 8 growing syndesmophytes on CR compared with 47 on ldCT. When looking at any bony proliferation, 36 new or growing syndesmophytes were seen on CR compared with 151 on ldCT.

Heatmap of the number of new syndesmophytes, growing syndesmophytes, or the combination of new or growing syndesmophytes per corner/quadrant for 50 patients from the Sensitive Imaging in Ankylosing Spondylitis cohort for the consensus definition. CR, conventional radiograph; CS, cervical spine; L, level; LS, lumbar spine; NA, not applicable; synd, syndesmophytes; TS, thoracic spine; VU, vertebral unit.
Discussion
The present study, performed in a cohort of patients with AS, found that more bone proliferation was detected on ldCT compared with CR. Most progression was detected in the thoracic spine. ldCT detected nearly five times more new or growing syndesmophytes compared with CR. The difference between CR and ldCT was most striking for the detection of growing syndesmophytes. Furthermore, even with the strict consensus definition, five times more patients showed any bone proliferation at ≥3 quadrants on ldCT compared with corners on CR, and almost five times as many new or growing syndesmophytes were seen.
Compared with CR, ldCT has multiple advantages. The most important difference is the volume data acquisition with the possibility of multislice multiplanar reconstruction. This increases the sensitivity to detect bone formation. Lateral CRs only show an overprojection of the medial and lateral part of a vertebra, and the posterior corners on the lateral view of the CR cannot be assessed reliably.13 The thoracic spine is even not included in the scoring system of the CR, since overprojection of soft and bony tissues but also scoliosis or kyphosis limit correct interpretation or measurement of syndesmophytes. On ldCT, syndesmophytes can be analysed in any plane, correcting for spinal curvatures. Moreover, in a previous study of the spatial distribution of syndesmophytes along the vertebral rim in patients with AS, it was found that most syndesmophytes are present on the posterolateral rim.14 On ldCT both endplates of a vertebra are divided in four quadrants in which syndesmophytes can be analysed compared with only one anterior corner on CR. Another advantage is the high spatial resolution, showing more detailed bony anatomy and the possibility to detect smaller syndesmophytes. This could enable earlier identification of progression; however, it could also introduce measurement error. The fact that there is a major reduction in the percentage of patients showing any progression of bony proliferation if we switch from the individual reader (at least 90%) to the consensus score (50%) could be interpreted as modest reliability. However, it should be realised that the agreement is at the level of the quadrant. Moreover, ldCT is superior to CR with regard to the number of patients excluded from analyses due to too many missing VCs or quadrants. This is mostly due to the fact that ldCT does not have the problem of overprojection, while on lateral CR of the cervical spine the lowest VCs are often missing because shoulders are raised due to a fixed kyphosis. All these advantages will likely help in enhancing the feasibility of trials in AS. Finally, the sacroiliac joints can also be assessed on CT, thereby eliminating the need for CR of these joints.
This study is unique in that, to our knowledge, it is the first study to directly compare the assessment of bone proliferation on CR and ldCT in a cohort of patients with AS. One of the strengths of this study is that both CR and ldCT were assessed by the same readers, although in separate reading sessions. Another important strength is that the strictest consensus definition was used. Even with this definition, the advantage of ldCT over CR for the identification of new or growing syndesmophytes is obvious.
The disadvantage of ldCT is the radiation dose, which is in general 10 times lower than the dose of a regular CT but 10 times higher than the dose of CRs. Using a phantom study this was confirmed for the SIAS study.7 15 The dose for ldCT of the whole spine is approximately 4 mSv. With further technical advances, it may be expected that additional reduction in dosing will become possible. The mean radiation dose in a study by Diekhoff et al 16 on ldCT of the sacroiliac joints was 0.51 (SD 0.18) mSv. In general, the use of ldCT is in line with the guidelines from the European Commission.17 18 However, we would like to stress that the use of ldCT is intended for clinical research and not daily clinical practice. Other possible disadvantages are the accessibility and costs.
Most gain in sensitivity is in the thoracic spine when both the formation of new syndesmophytes and growth of existing syndesmophytes are taken into account. If the aim is to reduce radiation exposure, it could be an option to image the thoracic spine only. However, it should be kept in mind that this could easily lead to a method with ceiling problems as >30% of the patients had already the maximum score in 9 of the 12 thoracic VUs.7
Another point of discussion is that the SDC of the mSASSS in our study is rather large (3.8) compared with earlier studies (between 2 and 2.9).10 19 20 This difference can partly be explained by the fact that in our study readers were blinded to time point, while in two of these studies chronology was known, which is known to reduce reader variability.5 Furthermore, in the current study, the mSASSS progression was higher than in the other cohorts.21 However, by using consensus scores when comparing the detection of new and/or growth of syndesmophytes between imaging techniques, we took variation in reading into account.
In summary, we compared scoring methods for the analysis of bone proliferation on ldCT and CR and found that ldCT detects more bone proliferation in patients with AS. The biggest advantages of ldCT were the ability to analyse the thoracic spine and the opportunity to analyse growth of syndesmophytes in more detail. With this scoring method, it has now become feasible to use ldCTs, with a relatively low radiation dose, in research (eg, medication trials). Next steps will be to evaluate discrimination between treatments and test if a shorter interval for ldCT can pick up sufficient change.
References
Footnotes
Handling editor Tore K Kvien
Contributors DvdH designed the study. AdK, FdB, RvdB, SR performed the data analyses. XB, JB, FAvG, MR, RvdB performed the data collection. AdK, FdB prepared the first draft of the manuscript. All authors interpreted the results, commented on the draft manuscript and approved the final submission.
Funding The authors would like to thank the Dutch Rheumatism Association for providing a grant for the SIAS study. Reumafonds, 9-1-301.
Competing interests None declared.
Ethics approval Medical Ethics Committee in Leiden and in Herne.
Provenance and peer review Not commissioned; externally peer reviewed.