Article Text

Abstract
Objectives To develop the CT Syndesmophyte Score (CTSS) for low-dose CT (ldCT) to assess structural damage in the spine of patients with ankylosing spondylitis (AS) and test its reliability.
Methods Patientswith AS in the SIAS cohort had whole spine ldCT at baseline and 2 years. Syndesmophytes were scored in coronal and sagittal planes in eight quadrants per vertebral unit (VU) as absent=0, <50% of the intervertebral disc space (IDS)=1, ≥50%=2 or bridging the IDS=3 (range 0–552). Images were scored by two readers, paired by patient, blinded to time order. Whole spine and spinal segment status and change scores were calculated. Inter-reader reliability was assessed by intraclass correlation coefficient (ICC), smallest detectable change (SDC) and frequency of scores per VU.
Results 49 patients (mean age 50 years (SD 9.8), 84% men, 88% human leucocyte antigen B27 positive) were included. Mean (SD) scores of reader 1 were: whole spine baseline status score 163 (126) and change score 16 (21), spinal segment baseline status scores 30 (41), 97 (77) and 36 (36) and change scores 2 (7), 12 (18) and 3 (4) for the cervical, thoracic and lumbar spine, respectively. Scores of reader 2 were similar. Whole spine status score ICC was 0.99 and 0.97–0.98 for spinal segments. Whole spine change score ICC was 0.77 and 0.32–0.75 for spinal segments. Whole-spine SDC was 14.4. Score distribution pattern per VU was similar between readers.
Conclusions Using the CTSS, new bone formation in the spine of patients with AS can be assessed reliably. Most progression was seen in the thoracic spine.
- ankylosing spondylitis
- outcomes research
- spondyloarthritis
Statistics from Altmetric.com
Introduction
Ankylosing spondylitis (AS) is a disease characterised by the formation of syndesmophytes. Currently, bone formation is assessed on lateral conventional radiographs (CRs) of the cervical and lumbar spine using the modified Stoke Ankylosing Spondylitis Spine Score (mSASSS).1 With CR, only the anterior vertebral corners are assessed and it is not possible to reliably assess all thoracic vertebrae due to overprojection of soft tissues and bones. Furthermore, level C7 is often poorly visible due to overprojection of the shoulders. Moreover, sensitivity to change on radiographs is limited. Consequently, the minimum duration of follow-up is 2 years to reliably assess progression in a substantial proportion of patients.2
Using MRI, multiplanar scans of the whole spine can be made. However, due to the lack of signal associated with calcification and the similar low signal of the annulus fibrosis and ligaments, this method is less useful for the evaluation of bone formation.
CT is the most appropriate method for assessing new bone formation, however its high radiation dose limits its use in follow-up studies. But, with the development of new hardware and software, most notably the multislice scanners, iterative reconstructions and progress in imaging protocols, low-dose CT (ldCT) might be a viable alternative for spinal radiographs. Major advantages of CT are the lack of overprojection and the possibility to assess the whole spine. CT has previously been used for the assessment of syndesmophytes in AS using a computer-based algorithm.3 4 This algorithm has however only been developed for assessment of lumbar vertebrae and has only been tested on high-resolution CT scans, which have a radiation dose of approximately 8 mSv per lumbar scan. It therefore seems unlikely that this method will be feasible for the assessment of the whole spine. We therefore developed a scoring method for the assessment of syndesmophytes in the spine of patients with AS on ldCT, the CT Syndesmophyte Score (CTSS). Here we describe the development and initial results.
Methods
Study population and protocol
Data from the sensitive imaging in ankylosing spondylitis (SIAS) study, an observational 2-year follow-up study of patients with AS, were used. Sixty patients were included, 30 patients in the Netherlands and 30 in Germany. Inclusion criteria were a clinical diagnosis of AS, fulfilment of the modified New York criteria, 1–18 syndesmophytes (maximum of 75% of the possible sites) visible on lateral cervical and lumbar spine CR and ≥1 inflammatory lesion on STIR MRI of the whole spine.5 All treatments were allowed according to the treating rheumatologist and no specific level of disease activity was required. Exclusion criteria were pregnancy and circumstances which would invalidate informed consent or limit the ability of the patient to comply with protocol requirements. Clinical data and MRI of the whole spine were collected at baseline, 1 and 2 years. Additionally, CR of the lateral cervical and lumbar spine and whole-spine ldCT were performed at baseline and 2 years. Patients underwent spinal imaging using a 64-section CT scanner (Aquilion 64; Toshiba Medical Systems, Otawara, Japan in Leiden and Somatom Emotion 16; Siemens, Erlangen, Germany in Herne). Patients were placed in the supine position, feet first. A volume CT with 0.5 mm acquisition is acquired from the superior endplate of C2 down to the inferior endplate of S1 (120 kVp, 60 mA, 0.5 s, 53/64 pitch). From this dataset, reconstructions are performed in both the axial plane and coronal and sagittal plane; in the axial plane, 1 and 3 mm slices from the superior endplate of C2 down to the inferior endplate of S1; in the coronal and sagittal plane, 2 mm slices including the complete vertebral column. The effective radiation dose per ldCT was approximately 4 mSv. The assessment of effective radiation dose per ldCT was achieved according to the methodology described in Teeuwisse et al.6 Sagittal and coronal reconstructions were made. For the present study, patients were included if ldCT was present at baseline and 2 years and if ≥75% of the vertebral sites that can be assessed on a ldCT were present. The written informed consent was obtained from all patients before inclusion.
Development of CTSS
An ldCT consists of a series of cross-sectional images (slices), allowing the viewer to ‘scroll through the spine’ as if it were a 3D object (figure 1A). By scrolling through sagittal images, the reader is able to assess the anterior and posterior rim of the vertebral bodies. In the coronal plane, the reader can assess the left and right rim. Markers are available to automatically find the same location in all planes (coronal and sagittal). For instance, activating this mark on the anterior lateral quadrant of Th5 will automatically show this mark in the other plane.

Schematic presentation of the views on ldCT, of a vertebral unit and a syndesmophyte and accompanying scores according to the CTSS. (A) In the sagittal view, the anterior and posterior rim of a vertebra can be assessed. In the coronal view the left and right rim of a vertebra can be assessed. In both views, multiple sections per vertebrae can be assessed. (B) A vertebral unit consists of the bottom half of a vertebra, the intervertebral disc space (with the intervertebral disc) and the superior half of the next vertebra. (C) Schematic view of a vertebral unit with a syndesmophyte. Depicted here is a vertebral unit (a), with the top (b) and bottom (c) vertebral bodies and the IDS (d). The grey, dotted line indicates the middle of the intervertebral disc space. The syndesmophyte originating from the top left corner (e) does not reach the middle of the IDS and is given a score of 1. The syndesmophyte originating from the bottom right corner (f) extends beyond the middle, and is given a score of 2. (D) Coronal CT image of the lower thoracic and lumbar spine. At T11-T12 (white arrow), a bridging syndesmophyte or ankylosis is seen. Since a bridging syndesmophyte is always scored on both sides, a score of 3 is given for both the lower right corner of T11 and the upper right corner of T12. At the right corner of T12-L1 (dashed arrow), a syndesmophyte originating from T12 extends beyond the middle of the IDS and is given a score of 2. There is no syndesmophyte at the opposing corner. At the left side of T12-L1 (arrow head), a syndesmophyte is growing from the lower corner of T12, but does not reach the middle of the IDS and is given a score of 1. The same is true for the right corner of L1-L2 (arrow head). (E) Sagittal CT image of the lower thoracic and upper lumbar spine. At the anterior side of the VUs T9-T10 down to T11-T12 (white arrows) bridging syndesmophytes are seen. At the anterior side of T12-L1 (dashed arrow), a syndesmophyte is growing form both the T12 corner and the L1 corner without reaching the middle of the IDS (both corners a score of 1). On the posterior side of the spine, no syndesmophytes are present. CTSS, CT syndesmophyte score; IDS, intervertebral disc space; LdCT, low-dose Computed Tomography; T, thoracic; VU, vertebral unit.
The spine was divided into vertebral units (VUs). A VU consists of the bottom half of a vertebra, the intervertebral disc space (IDS) and the top half of the next vertebra (figure 1B). From the bottom half of C2 to the top half of S1, there are 23 VUs. By scoring images in the sagittal and coronal planes, eight quadrants are assessed per VU. In each quadrant, the reader assesses the presence of a syndesmophyte. A syndesmophyte is defined as a bony spur arising from the vertebral body close to the vertebral endplate in a vertical configuration, with a minimum angle of 45° with the endplate. Syndesmophytes are scored using a method based on the mSASSS (figure 1C–E). The score reflects the height of a syndesmophyte relative to the IDS. For every quadrant, the score is 0 if no syndesmophyte is present, 1 if a syndesmophyte is present that does not reach 50% of the IDS, 2 if the syndesmophytes reaches or crosses 50% of the IDS and 3 if the syndesmophyte bridges the IDS. A value of 3 is per definition scored in both quadrants on opposite sides of the IDS. With eight quadrants per VU, 23 VUs per spine and a maximum score of 3 per quadrant, the maximum possible score for a patient is 552.
ldCT images were assessed using the CTSS by two trained readers, paired by patient, blinded to time order and patient information.
Score analysis
For patients who were included in the analysis, missing scores per quadrant were imputed using a previously described adaptation of the last-observation-carried-forward method used for the mSASSS.7 Briefly, for 2-year missing quadrant scores, the mean spinal segment progression score (ie, based on the present quadrants in the same segment) was added to the baseline score of the same quadrant, ensuring that a score of 3 (maximum score per quadrant) would never be surpassed. Similarly, for baseline missing quadrant scores, the mean spinal segment progression score was subtracted from the 2-year quadrant score, ensuring that the minimum value possible was 0 and also ensuring that 0 was considered for baseline when the same quadrant had a score of 0 at 2 years. If a quadrant score was missing at both timepoints, the average spinal segment score per timepoint was used for that quadrant for baseline, followed by the imputation of the mean segment progression to obtain the 2-year score, as previously explained. Status scores were calculated by adding the scores of all quadrants per patient, per timepoint. Progression scores were calculated by subtracting the baseline status score from the 2-year status score. This was done for the whole spine and per segment (cervical, thoracic and lumbar). The number of patients with a change score below the negative value of 0, 0.5 and the smallest detectable change (SDC) was subtracted from the number with a change score above these values to calculate the net number of patients with progression.
Analysis of the frequency of the scores 1, 2 and 3 was performed by counting the number of quadrants with a certain score per VU, for all patients combined, and dividing this by the total number of quadrants in that VU. The number of quadrants with an increase in score of ≥1 between baseline and 2 years was counted for the whole spine. Subsequently, the proportion of new syndesmophytes that developed was counted, taking the total number of quadrants into account, both for the whole spine and per segment. The percentage of VUs with progression was calculated by counting the number VUs with a higher 2-year score than the baseline score and dividing this by total number of VUs for all patients combined.
In order to assess on which side and in which VU most syndesmophytes were present at baseline, the number of syndesmophytes per side of a VU (anterior, posterior, left and right) were counted for all patients. Every side of a VU incorporates two quadrants per patient. Subsequently, the total number of available quadrants per side was calculated by multiplying the number of quadrants per side of a VU (2) with the total number of VUs per patient (23) and the number of patients (=46 available quadrants per side for all VUs and patients). Next, the total number of syndesmophytes per side of a VU was expressed as the percentage of quadrants affected by a syndesmophyte relative to the total number of quadrants that could be affected by syndesmophytes.
Statistical analysis
Patient characteristics and CTSS results were analysed using descriptive statistics. Interobserver reliability was assessed using the SDC and the intraclass correlation coefficient (ICC).8 These calculations were made on raw scores from the reader, that is, without any imputation. ICC was calculated, with a two-way fixed effects model, for the whole spine and for the three spinal segments for the status scores at baseline and at 2 years, and for the change scores between baseline and 2 years. The SDC is the smallest change that can be detected in an individual patient beyond measurement error and was calculated by SDC=1.96*SDdiff/(√k*√2). SDdiff is the SD of the difference in raw progression scores between two readers; k is the number of readers. Furthermore, using a heatmap, the frequency of the scores 1, 2 and 3 were visualised per VU between readers. Analyses were performed using STATA SE V.14 (StataCorp LP) and R V.3.4 (R Foundation).
Results
From the 60 patients included in the SIAS cohort, 11 were excluded due to ldCT missing at 2 years (n=9), one timepoint not scored by one reader (n=1) or >25% missing quadrants due to blurred low-quality images (n=1). Therefore, 49 patients were included in the analyses. The total number of quadrants that could theoretically be scored per reader is 18 032 (23 VUs * 8 quadrants * 49 patients * 2 timepoints). Reader 1 did not score 576 quadrants (3.2%) and reader 2 did not score 343 quadrants (1.9%).
Baseline demographics and clinical characteristics are summarised in table 1. The mean number of syndesmophytes at baseline on conventional radiography was 5.7 (SD 4.4, range 0–14) and 6.3 (SD 5.1, range 0–18) according to readers 1 and 2, respectively.
Baseline characteristics of patients included in the analyses (n=49)
Table 2 shows the mean and median status scores per timepoint and the change scores for the whole spine and segments of the spine. The mean CTSS baseline status score for the whole spine for reader 1 was 163 (SD 126) and median 127 (range 11–428). The mean change score was 16 (SD 21) and median 10 (range −11 to 96). There was a large spread in scores with almost the entire scoring range used. Most structural damage and bone proliferation were seen in the thoracic spine. Results were similar for reader 2. The ICC for the baseline status score was 0.99 for the whole spine and 0.97–0.98 for spinal segments. The ICC for the change scores was somewhat lower with 0.77 for the whole spine and 0.57, 0.75 and 0.32 for the cervical, thoracic and lumbar spine, respectively. The SDC was 14.4 for the whole spine, 9.3 for the cervical spine, 12.5 for the thoracic spine and 4.7 for the lumbar spine.
Status scores, change scores and ICC of baseline and 2 years for the whole spine and segments of the spine for the 49 patients included in the analysis
Table 3 presents the number of patients showing a change (positive, negative or net) according to the cut-off levels 0, 0.5 and SDC. When looking at any net change for the whole spine, more than half of the patients (61% according to reader 1 and 76% according to reader 2) showed a positive change. When analysing separate spinal segments, more patients showed a positive change in the thoracic spine compared with the lumbar and cervical spine (63% vs 49% and 55% according to reader 1). These numbers were similar for the cut-off of 0.5. Using the SDC as the cut-off, net 43% and 37% showed a positive change according to readers 1 and 2, respectively, with most patients showing progression in the thoracic spine. For the cervical spine, reader 1 scored two patients as having a change larger than the negative value of the SDC. In the lumbar spine, this occurred for one patient according to both readers. This did not occur for the whole or thoracic spine.
Number of patients with progression between baseline and 2 years for the whole spine and segments of the spine for the 49 patients included in the analysis
The distribution pattern of the scores 1, 2 and 3 at baseline and the percentage of VUs with progression for both readers are presented in figure 2. The distribution patterns of scores and percentage of VUs with progression are very similar between readers. A total of 426 quadrants for reader 1 and 397 quadrants for reader 2 received a score of 1 at baseline. A score of 3 is most prevalent in the majority of the VUs. This is most obvious in the thoracic spine, where up to 45% of VUs have a score of 3. A score of 2 is most prevalent in the lumbar spine. The highest percentage of VUs with progression is found in the thoracic spine.

The distribution pattern of CTSS scores 1, 2 and 3 in the spine at baseline and the percentage of VUs with progression, for individual readers. (A) The percentage of quadrants with a score of 1, 2 or 3 is given for all assessed levels for individual readers. The percentage was calculated by dividing the number of quadrants with a score of 1, 2 or 3 per VU by the total number of quadrants in that VU for all patients combined. (B) The percentage of VUs with progression is calculated by dividing the number of VUs with progression by the total number of VUs for all patients combined. CTSS, CT Syndesmophyte Score, VU, vertebral unit.
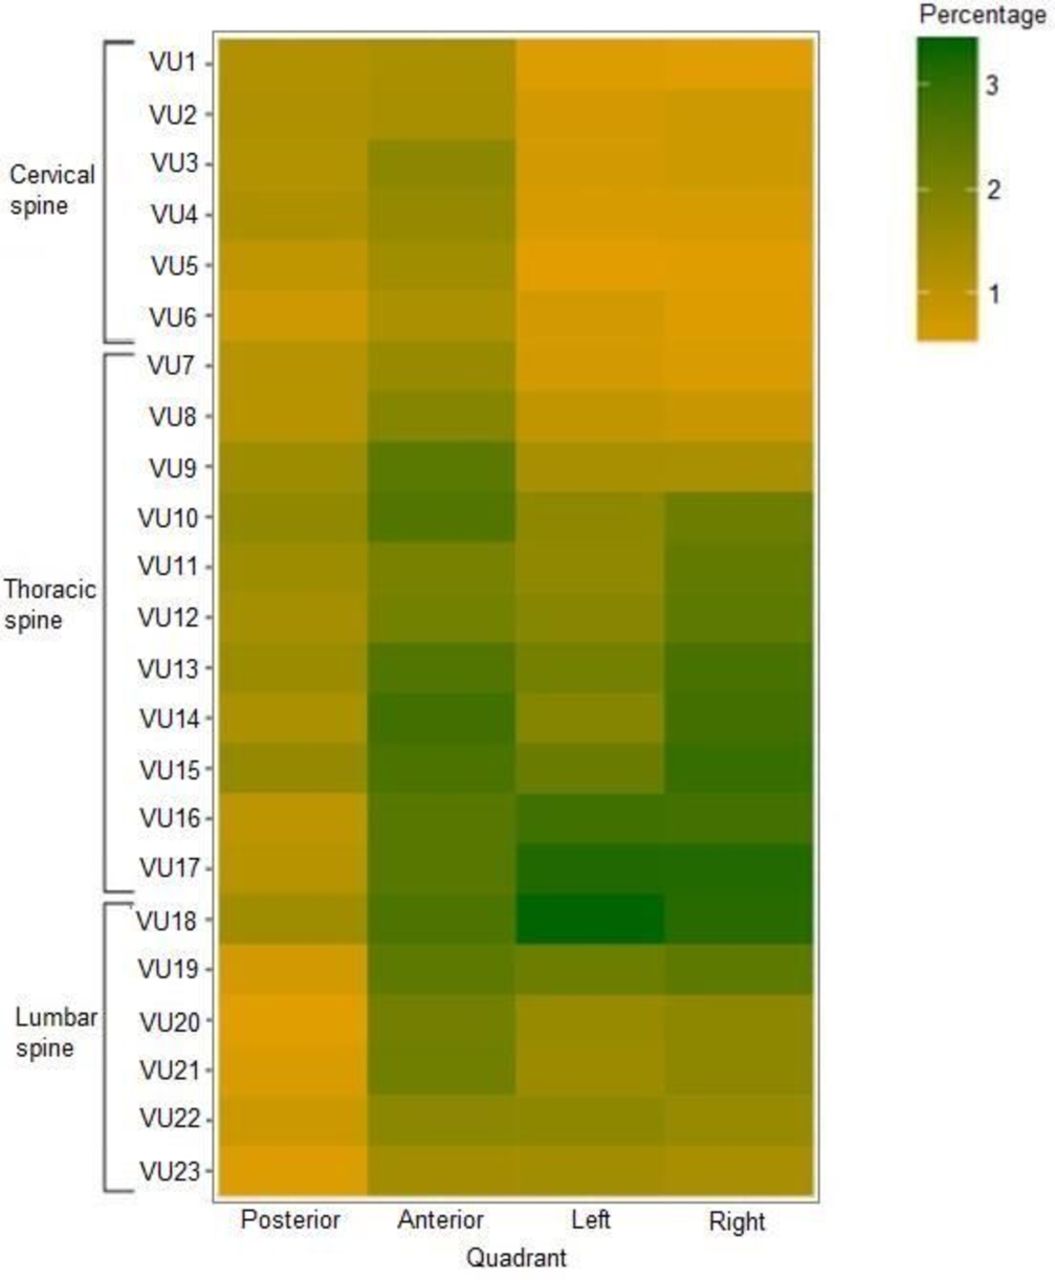
Figure 3 presents the percentage of quadrants per side of a VU affected by syndesmophytes relative to the total number of quadrants per side for all VUs and patients. For all sides, more quadrants are affected by syndesmophytes in the thoracic spine than in the cervical and lumbar spine, with the highest frequency of syndesmophytes on the right side of the thoracic spine. In the cervical and lumbar spine, most syndesmophytes are found on the anterior side.
Distribution pattern of syndesmophytes at baseline on the four sides of a vertebral unit in the spine per vertebral unit The percentage of quadrants per side of a vertebral unit (posterior, anterior, left or right) affected by syndesmophytesrelative to the total number of quadrants per side for all vertebral units and all patients combined. VU, vertebral unit.
Reader 1 scored 453 quadrants with an increase in score of ≥1 between baseline and 2 years in 44 patients. Reader 2 scored 469 quadrants with an increase in score in 42 patients. Therefore, five patients according to reader 1 and two according to reader 2 did not have any quadrants that increased in score. The mean number of quadrants per patient with an increase in score was 10 for both readers (SD 9 and 10 for reader 1 and 2, respectively). Of the quadrants with an increase in score, 321 were due to new syndesmophytes for reader 1 and 347 for reader 2. These new syndesmophytes developed in 42 and 43 patients for reader 1 and 2, respectively. Therefore, in two patients for reader 1 and four patients for reader 2, all quadrants with an increase in score were due to growth of syndesmophytes. Reader 1 scored 37 (12%) new syndesmophytes in the cervical spine, 218 (68%) in the thoracic spine and 66 (21%) in the lumbar spine. Reader 2 scored 72 (21%) new syndesmophytes in the cervical spine, 220 (63%) in the thoracic spine and 55 (16%) in the lumbar spine.
Discussion
This study describes the development and initial results of the CTSS, a new scoring method for the assessment of syndesmophytes on ldCT in the spine of patients with AS. By using a cohort of patients with AS with at least one syndesmophyte, but not full ankylosis, we have tested the CTSS in a representative sample of patients with AS. The CTSS has been shown to have excellent inter-reader reliability with a status score ICC of 0.99 for the whole spine and 0.97–0.98 for segments of the spine and a similar distribution pattern of scores between readers. Most structural damage was found in the thoracic spine, with approximately two-thirds of patients showing any progression and 30% showing progression larger than the SDC over 2 years.
A major advantage of using ldCT for the assessment of syndesmophytes is the ability to scroll through the slices, which gives an unobstructed view on the contours of the vertebrae. Images can be assessed in sagittal and coronal planes, thereby assessing eight quadrants per VU instead of two corners. It was impossible to assess the posterior corners reliably on CR.9 Furthermore, on ldCT, the thoracic spine can be assessed, thereby assessing 24 vertebrae instead of only 12 per patient. The thoracic spine was the section where most structural damage was present and where almost two-thirds of new syndesmophytes were located. Therefore, analysing this section is very important for the assessment of structural damage. Moreover, on ldCT the facet joints can be assessed as well as the sacroiliac joints, thereby eliminating the need of radiographs of these joints. Currently, we are studying the information that can be obtained from the facet joints, but we decided to keep this separate from the syndesmophyte score to be able to study both aspects separately. Another important advantage are the detailed images of ldCT; syndesmophyte height could be scored as >50% or <50% of the IDS, instead of only as the presence or the absence as on mSASSS, which gives the opportunity to assess syndesmophyte growth in more detail. An even more fine-grained assessment of syndesmophytes was not feasible, especially in the cervical and upper thoracic spine where deciding between a score of 1 or 2 already proved difficult at times. During the development, we also tested to take the width of the syndesmophytes into account but this could not be scored reproducibly. The change score ICC of the lumbar spine was low, which we believe was caused by minor changes in this segment as it is known that the ICC is heavily dependent on the observed range. The maximum change observed in the lumbar spine was 13, in comparison to 96 for the whole spine, 39 for the cervical spine and 97 for the thoracic spine by reader 1 (and very similar for reader 2). The SDC was even lower than that of the other segments (4.4 vs 14.4 for the whole spine, 9.3 for the cervical spine and 12.5 for the thoracic spine), and therefore, the low ICC was not due to bad reliability between readers.10 The ICC of the cervical spine is modest. Although comparisons of the various segments should be done cautiously because of the differences in the possible scoring range and the differences in the observed range in this cohort, it seems that the reliability of change scores in the cervical spine is most challenging based on differences in SDCs.
A limitation of ldCT compared with radiography is the radiation dose. ldCT protocols are currently about a factor 10 lower in dose compared with normal CT but a factor 10 higher in dose compared with radiography, and that was also what we found in a phantom study for this SIAS study.
An effective dose of approximately 4 mSv is received by a patient for a whole spine ldCT. To compare this with radiography, dose values could be derived from the literature. There is a wide variety of reported doses, not always representing current state-of-the art and reported doses may be too high. (In 2008, CR of the cervical spine (0.2 mSv), thoracic spine (1.0 mSv), lumbar spine (1.5 mSv) and sacroiliac joints (1.5 mSv) combinedly delivered a radiation dose of 3.4 mSv).11 A more realistic estimate was made for our local radiography protocol, using published methodology.6 This yielded a total dose of 0.4 mSv resulting from cervical and lumbar spine and pelvic radiographs. Background radiation in Europe is approximately 2.6 mSv per year.12 The European Commission for radiation protection has produced guidelines for radiation exposure in medical research for patients under the age of 50 years.13 The dose delivered by ldCT falls in category 2B, which allows research if it is ‘aimed directly at the diagnosis, cure or prevention of disease’. Using ldCT, smaller and possibly more syndesmophytes can be seen compared with CR; therefore, it is likely that earlier identification of progression is possible. This would increase the feasibility of, for example, medication trials for the prevention of progression. Therefore, ldCT fulfils the requirement set by the European Commission. Compared with the background radiation and the added value of ldCT over CR, we consider ldCT as a viable method for the assessment of structural damage in the spine. Moreover, the development in software with the capability of reducing the radiation dose further is rapidly growing and lower dosages may be expected in the near future.
In summary, the CTSS is a fine-grained scoring system for the assessment of structural damage in the spine of patients with AS with excellent inter-reader reliability. Most structural damage and progression of structural damage were seen in the thoracic spine, the part which is insufficiently assessable on CR. Next step will be to directly compare the assessment of structural damage on ldCT and CR.
Acknowledgments
The authors thank the Dutch Rheumatism Association for providing a grant for the SIAS study. They also thank Koos Geleijns, Department of Radiology, LUMC, Leiden, for performing the phantom studies to estimate the radiation doses.
References
Footnotes
FB and AK contributed equally.
Handling editor Tore K Kvien
Contributors DvdH: designed the study. AdK, FdB, RvdB and SR: performed the data analyses. XB, JB, FAvG, MR and RvdB: performed the data collection. AdK and FdB: prepared the first draft of the manuscript. All authors: interpreted the results, commented on the draft manuscript and approved the final submission.
Funding Dutch Rheumatism Association.
Competing interests None declared.
Ethics approval Medical Ethics Committee in Leiden and in Herne.
Provenance and peer review Not commissioned; externally peer reviewed.
Data sharing statement There are no additional data from the study available for sharing.