Article Text

Abstract
Objectives To report the level and trends of prevalence, incidence and years lived with disability (YLDs) for osteoarthritis (OA) in 195 countries and territories from 1990 to 2017 by age, sex and Socio-demographic index (SDI; a composite of sociodemographic factors).
Methods Publicly available modelled data from the Global Burden of Diseases, Injuries, and Risk Factors Study (GBD) 2017 were used. The burden of OA was estimated for 195 countries and territories from 1990 to 2017, through a systematic analysis of prevalence and incidence modelled data using the methods reported in the GBD 2017 Study. All estimates were presented as counts and age-standardised rates per 100 000 population, with uncertainty intervals (UIs).
Results Globally, the age-standardised point prevalence and annual incidence rate of OA in 2017 were 3754.2 (95% UI 3389.4 to 4187.6) and 181.2 (95% UI 162.6 to 202.4) per 100 000, an increase of 9.3% (95% UI 8% to 10.7%) and 8.2% (95% UI 7.1% to 9.4%) from 1990, respectively. In addition, global age-standardised YLD rate in 2017 was 118.8 (95% UI 59.5 to 236.2), an increase of 9.6% (95% UI 8.3% to 11.1%) from 1990. The global prevalence was higher in women and increased with age, peaking at the >95 age group among women and men in 2017. Generally, a positive association was found between the age-standardised YLD rate and SDI at the regional and national levels. Age-standardised prevalence of OA in 2017 ranged from 2090.3 to 6128.1 cases per 100 000 population. United States (6128.1 (95% UI 5729.3 to 6582.9)), American Samoa (5281 (95% UI 4688 to 5965.9)) and Kuwait (5234.6 (95% UI 4643.2 to 5953.6)) had the three highest levels of age-standardised prevalence. Oman (29.6% (95% UI 24.8% to 34.9%)), Equatorial Guinea (28.6% (95% UI 24.4% to 33.7%)) and the United States 23.2% (95% UI 16.4% to 30.5%)) showed the highest increase in the age-standardised prevalence during 1990–2017.
Conclusions OA is a major public health challenge. While there is remarkable international variation in the prevalence, incidence and YLDs due to OA, the burden is increasing in most countries. It is expected to continue with increased life expectancy and ageing of the global population. Improving population and policy maker awareness of risk factors, including overweight and injury, and the importance and benefits of management of OA, together with providing health services for an increasing number of people living with OA, are recommended for management of the future burden of this condition.
- epidemiology
- knee osteoarthritis
- osteoarthritis
Statistics from Altmetric.com
Key messages
What is already known about this subject?
To the best of our knowledge, no study has reported the national- level burden of osteoarthritis (OA). The region-specific burden of OA has been reported using the Global Burden of Diseases, Injuries, and Risk Factors Study 2010, which needs to be updated.
What does this study add?
Globally, the age-standardised point prevalence, annual incidence and years lived with disability (YLD) rate of OA in 2017 were 3754.2 (95% UI 3389.4 to 4187.6), 181.2 (95% UI 162.6 to 202.4) and 118.8 (95% UI 59.5 to 236.2) per 100 000 respectively.
Globally, an increase in age-standardised prevalence (9.3% (95% uncertainty intervals (UI) 8% to 10.7%)), incidence (8.2% (95% UI 7.1% to 9.4%)) and YLD (9.6% (95% UI 8.3% to 11.1%)) rates of OA was seen between 1990 and 2017.
The United States (6128.1/100 000 (95% UI 5729.3 to 6582.9)), American Samoa (5281 (95% UI 4688 to 5965.9)) and Kuwait (5234.6 (95% UI 4643.2 to 5953.6)) were the three countries with highest age-standardised prevalence estimates in 2017.
The global prevalence was higher in women and increased with age, peaking at the >95 age group among women and men in 2017.
How might this impact on clinical practice or future developments?
Preventive measures previously addressed need to be reaffirmed throughout the world, especially in the older female population of the countries with the highest burden of OA, to effectively reduce the future burden and disability of OA.
Introduction
Osteoarthritis (OA) is a prevalent and disabling condition that imposes a remarkable burden, with notable implications for the individuals affected, healthcare systems and wider socioeconomic costs.1 2 A large proportion of the OA burden is due to hip and knee OA, which at end stage may lead to joint replacement. In recent years, the burden of OA has been presented in several review papers based on few national studies, and no detailed information was provided across all countries.2–4 Moreover, worldwide OA burden was reported using the Global Burden of Disease (GBD) 2010 Study, but country-level information was not reported, and these overall OA burden estimates need to be updated from the 2010 estimates.5 One study reported the global burden of musculoskeletal diseases using the WHO Burden of Diseases Database during 2000–2015, but it did not specifically focus on OA.6 To provide comprehensive, comparable and up-to-date information on OA burden, this report presents the modelled global-, regional- and national-level prevalence, incidence and years lived with disability (YLDs) of OA as reported in the GBD 2017 Study, presenting counts and age-standardised rates from 1990 to 2017 by age, sex and Socio-demographic Index (SDI; a composite of sociodemographic factors).
Methods
Overview
The GBD 2017 Study, conducted by Institute of Health Metrics and Evaluation (IHME), is the largest and most comprehensive effort, to date, to measure epidemiological levels and trends worldwide. One hundred and ninety-five countries and territories, 7 super-regions and 21 regions have been included in GBD studies since 1990,7 and GBD 2017 systematically studied 359 diseases and injuries, 282 causes of death and 84 risk factors. The general methodology of GBD 2017 developed by IHME and its main improvements compared with previous cycles have been explained in previous publications.7–10 Detailed information about fatal and non-fatal estimates used in GBD 2017 can be found at https://vizhub.healthdata.org/gbd-compare/ and http://ghdx.healthdata.org/gbd-results-tool.11 12
Case definition and data sources
In the GBD 2017 Study, only OA of the hip and knee was included, and the reference definition was symptomatic OA of the hip or knee radiologically confirmed as Kellgren-Lawrence grade 2-4.7 13 Grade 2 symptomatic OA involves one defined osteophyte in hip or knee and pain for at least 1 month out of the past 12 months. Grade 3–4 symptomatic OA includes osteophytes and joint space narrowing in hip or knee, with grade 4 also including deformity, and pain for at least 1 month out of the past 12 months.7 13 Covariates were used in the modelling process to highlight data obtained from definitions other than the reference definition, such as self-report.
Only hip and knee sites were reviewed to obtain GBD OA estimates as hip and knee are the common sites of OA in larger joints and are considered to produce the greatest disability. Failure of these joints could lead to the need for high-cost joint replacement, where available, contributing to direct healthcare costs. As noted in GBD 2017, although OA of the spine is common, the associated symptoms and disability were considered to have been captured in the estimates of low back pain and neck pain. Hand OA was also not considered as a separate entity in these GBD 2017 OA estimates.7
A systematic review of the population-based prevalence and incidence of OA was performed for the years 1980 to 2009 for GBD 2010 and updated for GBD 2017. Detailed information on the search terms used for prevalence and incidence are described elsewhere.7 Studies with the following characteristics were excluded: (a) subpopulations clearly not representative of the national population; (b) not a population-based study; (c) small sample size (<150) and (d) reviews.7
Data obtained in GBD 2017 for knee OA included prevalence (site-years=395) and incidence (site-years=5), and for hip OA prevalence (site-years=350) and incidence (site-years=5) were used for the study estimates.7 Notably, a site-year is a unique combination of location and calendar year and is defined as a national or other subnational geographical unit contributing data in a given year. The number of countries with data for estimating the prevalence (n=26) and incidence (n=4) of knee OA were low as was the number for hip OA prevalence (n=24) and incidence (n=3). For knee and hip OA, the number of GBD regions with data was higher for prevalence (n=12 and n=9 respectively) compared with incidence (n=2 for both).7 In addition, USA claims data for 2000 and 2010–2014 by state and Taiwan claims data from 2016 were included. Notably, hospital inpatient data were not used as they were not considered to be representative of population-based prevalence.7 The exact data sources used in estimating the burden of OA in the different countries can be found at GBD 2017 Data Input Sources Tool using the following link: http://ghdx.healthdata.org/gbd-2017/data-input-sources. Where data were not available or sparse for a country or region, an advantage of using DisMod-MR 2.1 was that, in addition to pooling heterogeneous data and checking for internal consistency to adjust for methodological differences, DisMod-MR 2.1 allowed for the use of covariates and the borrowing of strength across time and geography. Using disease-relevant country characteristics, such as average body mass index (BMI), and random effects, values were estimated based on the actual data from similar countries and territories to model data where actual data does not exist. Uncertainty intervals allow the assessment of the strength of the evidence.
Data processing and disease model
While MarketScan data reported all OA in 2000 and 2010–2014, National Health and Nutrition Examination Survey (NHANES) I was the only NHANES cycle that diagnosed and reported separately for hip and knee using radiologically confirmed diagnoses and self-reported pain. Consequently, data from NHANES I were used to estimate the proportion of OA that is hip and knee, by sex. The fraction of OA cases attributable to hip and knee was calculated and then applied to the MarketScan data to determine the prevalence of OA of hip and OA of knee.7
Prior settings in the DisMod-MR 2.1 model included setting remission to 0 with an assumption that there was no incidence or prevalence of OA before the age of 30 years. It was also assumed that excess mortality is zero as the data on mortality risk associated with OA are not consistent.7
Study covariates were used where studies identified cases of OA through varying methods, which included X-ray examinations only, self-reported OA with pain, self-reported OA with no information on pain or medical record review where cases of OA were assumed to have been diagnosed by X-ray examination. For each of these covariates, the crosswalk was estimated before DisMod-MR 2.1 comparing, for example, geographies, which had data according to the reference case definition and the alternative. Bounds with an upper and lower limit were set in DisMod-MR 2.1. For each of 3 years of claims data in the USA, covariates were added. Detailed information on this subject can be found elsewhere.7
Severity and years lived with disability
International Classification of Diseases (ICD) version 10 codes were used for OA of the hip (M16) and knee (M17). The ICD-9 code for OA is 715 without specific codes for hip and knee sites. Four disease sequelae (severity levels) were considered for OA, where each sequela had specific disability weights (DWs) ranging from 0 to 0.165 (online supplementary table S1). The GBD 2013 European Disability Weights Measurement Study and GBD 2010 Disability Weights Measurement Study were used as sources of DW values. More details have been described in previous studies.7 14
Supplemental material
To determine the proportion of each severity level for OA, the information reported in four studies from three regions was used. OA severity was classified based on the Western Ontario and McMaster Universities Arthritis Index (WOMAC),15 with scores 0–5 taken as mild, 6–13 as moderate and ≥14 as severe.16 17 Estimates were pooled across studies using a random-effects meta-analysis model. The pooled percentages of mild 47.0% (42.2% to 51.9%), moderate 35.9% (31.3% to 40.7%), and severe 17.1% (12.9% to 21.6%), between patient and physician ratings reported in a study from Bangladesh were applied to low- and middle-income countries. The pooled proportions from three other studies in high-income countries were mild 74.3% (64.8% to 82.7%), moderate 24.3% (16.4% to 33.1%), and severe 1.1% (0.6% to 1.7%).7 After streaming out 1000 draws assuming a binomial distribution, percentages were scaled to a sum of 1 at each draw.
Overall prevalence of OA was divided into the severity categories by applying the pooled proportions described above. YLDs were then calculated by multiplying the prevalence of each severity category by severity-specific DWs. The measure to compare health conditions across regions and over time is the disability-adjusted life year (DALY). One DALY equals one lost year of healthy life, and is equal to the sum of years of life lost and YLDs.10 As no deaths were attributable to OA in the GBD estimated cause of death models, DALYs for OA were considered to be the same value as YLDs. It was noted that YLDs for knee OA and hip OA were combined to estimate the overall OA burden. At each computing step, uncertainty was incorporated by sampling 1000 draws combining uncertainty from a number of sources, including input data, corrections of measurement error and estimates of residual non-sampling error. The 2.5th and 97.5th centiles of the ordered draws were defined as uncertainty intervals (UIs).
Complementary analyses
Smoothing splines models18 were used to determine the shape of association between OA burden measured as YLDs with SDI for 21 regions and 195 countries and territories. Although, R2 of smoothing splines were higher than corresponding linear models, we focused more on shape of dose–response relationships rather than fit of models. SDI is a composite indicator of lag-distributed income per capita—that is, gross domestic product per capita that has been smoothed over the preceding 10 years, average years of schooling for the population older than 15 years, and total fertility rate under the age of 25. It ranges from 0 (less developed) to 1 (most developed). R software version 3.5.2 was used to generate figures of estimates of prevalence and incidence from data available from http://ghdx.healthdata.org/gbd-results-tool.
Results
Global level
This study showed that there were about 303.1 million (95% UI 273.3 to 338.6 million) prevalent cases of hip and knee OA, with an age-standardised prevalence estimate of 3754.2 per 100 000 (95% UI 3389.4 to 4187.6). This was a 9.3% (95% UI 8% to 10.7%) increase from 1990 to 2017. In addition, OA accounted for approximately 14.9 million (95% UI 13.4 to 16.7 million) incident cases globally with an age-standardised incidence rate of 181.2 (95% UI 162.6 to 202.4), an increase of 8.2% (95% UI 7.1% to 9.4%) between 1990 and 2017 (table 1). At the global level, nearly 9.6 million (95% UI 4.8 to 19.1) YLDs were due to OA, with an age-standardised rate of 118.8 (95% UI 59.5 to 236.2) YLDs per 100 000 population. The age-standardised YLD rate increased by 9.6% (95% UI 8.3% to 11.1%) since 1990 (table 1).
Prevalent cases, incident cases and years lived with disability (YLD) for osteoarthritis in 2017 for both sexes and percentage change of age-standardised rates by Global Burden of Disease regions (generated from data available from http://ghdx.healthdata.org/gbd-results-tool)
Regional level
At the regional-level, the age-standardised prevalence per 100 000 of OA in 2017 was highest in high-income North America (5923.9 (95% UI 5531.9 to 6367.1)), North Africa and Middle East (4609.8 (95% UI 4085.1 to 5200)) and Australasia (4594.8 (95% UI 4107.6 to 5136.4)). Conversely, Eastern Sub-Saharan Africa (2567.9 (95% UI 2291.5 to 2884.7)), Central Sub-Saharan Africa (2632.5 (95% UI 2347.2 to 2969.4)) and Western Sub-Saharan Africa (2678.3 (95% UI 2382.3 to 3006.6)) had the lowest age-standardised prevalence estimates (table 1).
High-income North America (306.6 (95% UI 285 to 331)), Australasia (236 (95% UI 210 to 263.6)) and high-income Asia Pacific (233.4 (95% UI 206.6 to 262.8)) had the highest OA age-standardised incidence rates, while these rates were lowest in Eastern Sub-Saharan Africa (133 (95% UI 117.6 to 149.9)), Central Sub-Saharan Africa (135.9 (95% UI 120.4 to 153.2)) and East Asia (136.2 (95% UI 120.5 to 153.9)) (table 1).
High-income North America (185.9 (95% UI 94.6 to 375)), high-income Asia Pacific (146.4 (95% UI 72.8 to 288.5)) and Australasia (145.5 (95% UI 73.2 to 285.7)) had the highest age-standardised YLD rates in 2017 while Eastern Sub-Saharan Africa (80.8 (95% UI 40.7 to 158.7)) Central Sub-Saharan Africa (81.6 (95% UI 41.5 to 162.3)) and Western Sub-Saharan Africa (83.9 (95% UI 42 to 165.6)) had the lowest age-standardised YLD rates (table 1). The regional-level age-standardised prevalence and incidence estimates for all GBD 2017 regions are presented by sex in online supplementary figures S1 and S2.
Supplemental material
Supplemental material
The percentage changes in age-standardised prevalence estimates during 1990–2017 varied across the GBD 2017 regions. While all regions showed an increasing trend, high-income North America (22.5% (95% UI 16.1 to 29.4)), Australasia (14.4% (95% UI 11.3 to 17.4)) and tropical Latin America (14% (95% UI 12.8 to 15.2)) displayed the highest increasing trends (table 1). These regions were also the top three regions with increasing trends in age-standardised incidence and YLD rates. No region showed a decreasing trend (table 1). The sex-specific percentage changes in age-standardised prevalence estimates and incidence rate during 1990–2017 are presented in online supplementary figures S3 and S4.
Supplemental material
Supplemental material
The number of prevalent cases remarkably increased from 1990 (141.3 million (95% UI 126.2 to 158.8)) to 2017 (303.1 (95% UI 273.3 to 338.6)), but the regions contributing to the increase in 2017 were different from those in 1990 (online supplementary figure S5). Similarly, the number of incident cases increased from 1990 (7.4 million (95% UI 6.6 to 8.3)) to 2017 (14.9 million (95% UI 13.4 to 16.7)) with different contributing regions in 2017 than in 1990 (online supplementary figure S6).
Supplemental material
Supplemental material
National level
Age-standardised prevalence estimates of OA in 2017 ranged from 2090.3 to 6128.1 cases per 100 000 population. United States (6128.1 (95% UI 5729.3 to 6582.9)), American Samoa (5281 (95% UI 4688 to 5965.9)) and Kuwait (5234.6 (95% UI 4643.2 to 5953.6)) were the countries with the highest age-standardised prevalence estimates in 2017. Taiwan (2090.3 (95% UI 1870.8 to 2333.8)), North Korea (2290.7 (95% UI 2025.1 to 2590.9)) and Madagascar (2353.5 (95% UI 2082.7 to 2660.4)) had the lowest estimates (figure 1 and online supplementary table S2). The percentage change in age-standardised prevalence estimates from 1990 to 2017 differed substantially between countries. Oman (29.6% (95% UI 24.8% to 34.9%)), Equatorial Guinea (28.6% (95% UI 24.4% to 33.7%)) and United States (23.2% (95% UI 16.4% to 30.5%)) showed the largest increases. Taiwan (−0.2% (95% UI −6.3% to 5.1%)), Central African Republic (−0.3% (95% UI −3.9% to 3.0%)) and DR Congo (−3.4% (95% UI −6.8% to 0.0%)) showed slight but non-significant decreasing trends (online supplementary table S2).
Supplemental material

Age-standardised prevalence estimates of osteoarthritis per 100 000 population in 2017, by country. ATG, Antigua and Barbuda; BRB, Barbados; COM, Comoros; DMA, Dominica; FJI, Fiji; FSM, Federated States of Micronesia; GRD, Grenada; KIR, Kiribati; LCA, Saint Lucia; MDV, Maldives; MHL, Marshall Islands; MLT, Malta; MUS, Mauritius; SGP, Singapore; SLB, Solomon Islands; SYC, Seychelles; TLS, Timor-Leste; TON, Tonga; TTO, Trinidad and Tobago; VCT, Saint Vincent and the Grenadines; VUT, Vanuatu; WSM, Samoa (generated from data available from http://ghdx.healthdata.org/gbd-results-tool).
Age-standardised incidence rates of OA in 2017 varied from 99.5 to 316.9 cases per 100 000 population. United States (316.9 (95% UI 295 to 341.1)), Kuwait (260.7 (95% UI 230.5 to 295.5)) and Qatar (258 (95% UI 228 to 292.4)) showed the highest age-standardised incidence rates in 2017. Taiwan (99.5 (95% UI 88.7 to 111.1)), North Korea (105.7 (95% UI 93.1 to 119.9)) and Madagascar (122.3 (95% UI 107.9 to 139.2)) had the lowest rates (figure 2 and online supplementary table S3). United States (29.1% (95% UI 21.9% to 37.1%)), Oman (27.5% (95% UI 22.6% to 33.1%)) and Equatorial Guinea (27% (95% UI 22.7% to 32%)) showed the largest increases in age-standardised incidence rates from 1990 to 2017. Only two of the 195 countries showed a slight decreasing trend: (Central African Republic −0.6% (95% UI −4.0% to 2.8%) and DR Congo −3.6% (95% UI −6.7% to −0.2%) (online supplementary table S3).
Supplemental material

Age-standardised incidence rate of osteoarthritis per 100 000 population in 2017, by country. ATG, Antigua and Barbuda; BRB, Barbados; COM, Comoros; DMA, Dominica; FJI, Fiji; FSM, Federated States of Micronesia; GRD, Grenada; KIR, Kiribati; LCA, Saint Lucia; MDV, Maldives; MHL, Marshall Islands; MLT, Malta; MUS, Mauritius; SGP, Singapore; SLB, Solomon Islands; SYC, Seychelles; TLS, Timor-Leste; TON, Tonga; TTO, Trinidad and Tobago; VCT, Saint Vincent and the Grenadines; VUT, Vanuatu; WSM, Samoa (generated from data available from http://ghdx.healthdata.org/gbd-results-tool).
The countries with highest age-standardised prevalence estimates of OA in 2017 also had the highest age-standardised YLD rates (online supplementary figure S7 and table S4). The largest increases in age-standardised YLD rate during 1990–2017 were seen in Oman (30.8% (95% UI 24.7% to 37.3%)) and Equatorial Guinea (30.1% (95% UI 24.6% to 36.2%)) and Maldives (24.3% (95% UI 18.7% to 29.8%)). Only Taiwan (−0.3 (95% UI −6.7% to 5.9%)) and DR Congo (−2.6 (95% UI −6.7% to 1.7%)) showed slight decreasing trends (online supplementary table S4).
Supplemental material
Supplemental material
Age and sex patterns
The global prevalence estimate was higher in women and increased with age, peaking at the >95 age group for both women and men in 2017. In addition, the number of prevalent cases increased with age and peaked at 60–64 years age for both men and women, then decreasing trends for number of prevalent cases were seen up to the oldest group (figure 3). In 2017, the global incidence rate was higher in women and increased with age up to the 55–59 years age group. There was no visible difference between the incidence in men and women in all age groups. The number of incident cases reached the highest level at the 55–59 years age group, then decreasing trends were seen up to the oldest group (online supplementary figure S8). The pattern of YLD rate by sex across the age groups was relatively similar to that of prevalence. Both counts and rates were not different for men and women (online supplementary figure S9).
Supplemental material
Supplemental material

Global number of prevalent cases and prevalence estimates of osteoarthritis per 100 000 population by age and sex, 2017; Dotted and dashed lines indicate 95% upper and lower uncertainty intervals, respectively (generated from data available from http://ghdx.healthdata.org/gbd-results-tool).
Burden of osteoarthritis by Socio-demographic Index
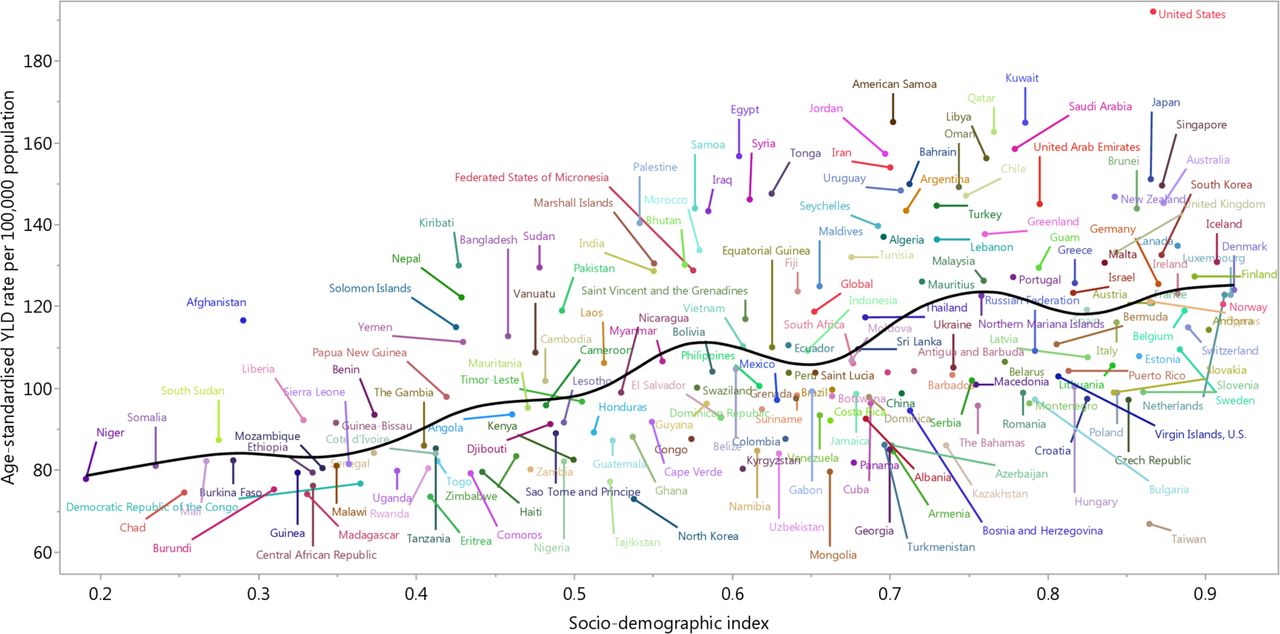
Generally, a positive association was found between the age-standardised YLD rate and SDI at the global level and for all GBD regions between 1990 and 2017 (figure 4). At the global level and in high-income North America, Southern Latin America, North Africa and Middle East, South Asia and Oceania regions, the observed burden estimates of OA were higher than the expected level based on the SDI between 1990 and 2017. High-income Asia Pacific and Southeast Asia had a higher than expected level of burden at the initial and last years of the measurement period, respectively (figure 4). A positive association of age-standardised YLD rate of OA and SDI for 195 countries and territories in 2017 was noted. The age-standardised YLD rate was higher than the expected level for a number of the countries/territories, including United States, Egypt and American Samoa (figure 5).

Age-standardised years lived with disability (YLD) rates for osteoarthritis for 21 Global Burden of Disease (GBD) regions by Socio-demographic index, 1990–2017; expected values based on the Socio-demographic index and disease rates in all locations are shown as the black line. Twenty-eight points are plotted for each GBD region and show observed age-standardised YLD rates from 1990 to 2017 for that region (generated from data available from http://ghdx.healthdata.org/gbd-results-tool).
Age-standardised years lived with disability (YLD) rates of osteoarthritis by 195 countries and territories and Socio-demographic index, 2017; expected values are shown as the black line. Each point shows observed age-standardised YLD rate for specified country in 2017 (generated from data available from http://ghdx.healthdata.org/gbd-results-tool).
Discussion
This report provides the most up-to-date estimates of prevalence, incidence and YLD for OA in 195 countries and territories from 1990 to 2017. OA accounted for 303.1 million prevalent cases, 14.9 million incident cases and 9.6 million YLDs in 2017. National-level burden of OA in 2017, not previously reported, has been included in this study derived from the publicly available GBD 2017 Study data (https://vizhub.healthdata.org/gbd-compare/ and http://ghdx.healthdata.org/gbd-results-tool).11 12
Age-standardised prevalence of hip and knee OA for GBD regions estimated using the data from GBD 2010 Study has been previously reported,5 but those estimates could not be directly compared with our findings owing to differences between GBD 2010 and GBD 2017 in the data sources and methodologies used. Additionally, the previous study did not report age-standardised prevalence, age-standardised incidence rate and DALY rate of OA combined and for both sexes, separately. Other systematic reviews reported prevalence and incidence of OA only for some selected countries and regions.2–4 19
The age-standardised prevalence and incidence rate increased from 1990 to 2017. Similar results were also reported in previous studies,2 3 5 with the suggestion that the burden of OA would increase over time, and were predicted to be one of the leading causes of YLDs, globally.2 Thus it is essential that prevention measures, management and treatment of OA are given priority. The burden of OA is increasing globally, being most prevalent in high-income North America, North Africa and Middle East and Australasia. It has been estimated that the medical costs of OA account for about 1% to 2.5% of national gross domestic product, with knee joint replacement contributing to most of these healthcare costs.2 OA cost estimates often include only healthcare costs, and the indirect costs, including cost due to work loss and premature retirement, are not taken into account. This, in turn, can lead to an underestimation of the total healthcare costs of the condition. Overall, national costs together with personal out-of-pocket expenses of those with OA were most likely to exceed the direct healthcare costs.1 2
As shown here and in previous studies,2–4 20 the burden of OA is higher in women, hence this group should be targeted in a prevention, management and treatment programme. Similarly, the global prevalence estimate was higher in women and increased with age, peaking at the oldest age group for both women and men in 2017. A similar pattern was observed in the data from GBD 2010 Study, especially for hip OA, where knee and hip OA were reported separately.5 Also, a systematic review reported the highest prevalence estimate of OA in people aged 70 years for both men and women.21 Although joint replacement surgery may be a treatment for end-stage OA, there is no cure for the condition, contributing to the increased prevalence among older populations.
Incidence rates were found to have a different distribution pattern compared with prevalence, peaking among those aged 55–59 years, with a declining trend observed until the 85–89 year age group. Other studies in Spain and UK, in contrast, found the highest incidence rate of hip and knee OA among people aged 75–80 and 75–84 years, respectively.20 22 Overall, the global-level age patterns of OA reported in this study could only be indirectly compared with the national-level patterns reported by previous studies as the reported age categories do not necessarily align.
A positive association was found between OA burden and the developing level of GBD regions and countries; this has not been previously reported. The high burden of OA was not constrained to countries with a high SDI level such as USA but was also seen in countries with a middle SDI level, where there is an increasing life expectancy, such as Egypt and American Samoa. The burden of OA was higher than the expected level, particularly in some regions, including high-income North America, Southern Latin America, North Africa and Middle East, South Asia and Oceania, and countries such as USA, Egypt and American Samoa. The burden of OA observed could be considered relative to the expected burden based on the SDI when considering preventive measures.
Despite the high burden of OA worldwide, there is no cure and a lot of work remains to be done to prevent the onset of OA. Strategies to prevent OA should focus on its modifiable risk factors and help health policy makers to define high-risk groups. Modifiable risk factors which should be targeted include BMI23–25 and knee injuries,23 which could be prevented. High BMI or BMI ≥25 kg/m2 is one of the most critical risk factors of OA and needs to be included in global-, regional- and national-level prevention policies. The increasing prevalence of overweight and obesity is contributing to the increasing burden of OA. More recent studies reported that the prevalence of adult obesity has doubled in more than 70 countries during the past three decades.26 27
Strengths and limitations
The heterogeneous nature of OA measurement makes it difficult to compare estimates across populations and may lead to serious misclassifications.28 Definitions used for individual studies are not reported, but data entered into DisMod-MR 2.1 were from studies that included symptomatic OA diagnosed by clinical assessment, radiographically or by self-report. These varying methods have been flagged in the modelling process with covariates to let DisMod-MR 2.1 adjust the data points to the level predicted if the study had measured the reference diagnosis. However, while this modelling allows comparison of data across regions over time, the variation in the way in which OA is defined is a limitation that precludes truly valid comparisons across different regions.
The data reported in this study were primarily extracted from modelled data from DisMod-MR 2.1 generated by the IHME. As stated in the methods, the number of regions and countries with actual data was low, hence the findings rely heavily on the modelled data using covariates and borrowing strength across time or geography. Consequently, national/country-level results should be interpreted with caution. This study emphasises the importance of health data collection at the country level, including musculoskeletal diseases, particularly for OA, which is essential to provide more robust burden estimates.
These data include only OA of the hip and knee, so do not capture the entire burden of OA. It is expected that future GBD studies will include OA of other joints, such as the hands, and these will further clarify the true burden of OA.
Conclusions
OA is a major public health challenge. Although there is variation between countries in prevalence, incidence and YLDs due to OA, its burden is increasing in most countries, especially among women. This trend is expected to continue as the ageing of the global population is rising. Attempts to mitigate the future burden of OA require better awareness, especially of the risk factors, and early diagnosis and treatment of OA together with the improvement of healthcare infrastructure for managing the increasing number of patients with OA. Continuing to expand OA population-based data collection at the national level is essential to monitor the disease burden and to further deal with the need for better care.
Acknowledgments
We thank the Institute for Health Metrics and Evaluation staff and its collaborators who prepared these publicly available data. Also, we thank the support of the Social Determinants of Health Research Center of Shahid Beheshti University of Medical Sciences.
References
Footnotes
Handling editor Josef S Smolen
Twitter @deepti_b
Contributors SS, AAK, LM and MC designed the study. SS, AAK, MAM, AA-H and AA-A analysed the data and performed the statistical analyses. SS, AAK, DB, ES, MS and MC drafted the initial manuscript. All authors reviewed the drafted manuscript for critical content. All authors approved the final version of the manuscript.
Funding The Global Burden of Disease study is funded by the Bill and Melinda Gates Foundation, which was not involved in any way in the preparation of this manuscript. This report was also supported by Shahid Beheshti University of Medical Sciences, Tehran, Iran (Grant No. 20607-4-7).
Competing interests None declared.
Patient and public involvement Patients and/or the public were not involved in the design, or conduct, or reporting, or dissemination plans of this research.
Patient consent for publication Not required.
Ethics approval This study was approved by Ethics Committee of Shahid Beheshti University of Medical Sciences, Tehran, Iran (IR.SBMU.RETECH.REC.1398.414).
Provenance and peer review Not commissioned; externally peer reviewed.
Data availability statement Data are available in a public, open access repository. The data used for the analyses are publicly available from http://ghdx.healthdata.org/gbd-results-tool.
Author note This study is based on publicly available data and solely reflects the opinion of its authors and not that of the Institute for Health Metrics and Evaluation.