Article Text

Abstract
Introduction Imaging of heel enthesopathy in spondyloarthritis (SpA) could potentially be useful for diagnosis and monitoring. The aim of this study was to assess the diagnostic capacities of MRI and power Doppler ultrasonography (PDUS) of the heel to distinguish patients with SpA from controls and to distinguish between patients with SpA with and without enthesopathy.
Methods A cross-sectional single-centre study was performed in 51 patients (102 heels) with definite SpA according to Amor's criteria. Patients with degenerative non-inflammatory low back pain (n=24, 48 heels) were included as controls. Bilateral heel MRI and PDUS were performed by two senior musculoskeletal radiologists blinded to the clinical and biological data on the same day as the clinical evaluation. The data were analysed by patient and by heel.
Results Neither MRI nor PDUS could discriminate between patients with SpA and controls; bone oedema on MRI was the only abnormality specific to SpA (94%), but with a poor sensitivity (22%). However, among patients with SpA, painful heels had more inflammatory abnormalities (81% by MRI, 58% by PDUS) than heels with no pain (56% at MRI, 17% at PDUS).
Conclusion Heel MRI and PDUS frequently show inflammatory lesions in SpA, particularly in painful heels. However, they were also often abnormal in controls. These results suggest that heel MRI and PDUS cannot be used for the diagnosis of SpA. However, PDUS and MRI may be useful for the depiction and assessment of enthesis inflammatory lesions in patients with SpA with heel pain.
Statistics from Altmetric.com
Enthesopathy is a very common feature of spondyloarthritis (SpA), frequently involving the heel, either at the Achilles tendon insertion or plantar aponeurosis.1 2 Investigation of enthesis sites in SpA is based on clinical findings and/or imaging findings. Imaging investigations have to date been considered in different ways.
The first is the elaboration of an enthesopathy index at the patient level. Such an index can be used for diagnostic/classification purposes in patients presenting with a symptom (eg, inflammatory back pain) other than enthesopathy. Such an enthesopathy index can be based on clinical findings3 4 or imaging findings using ultrasonography (US) in several enthesis sites.5,–,7 To our knowledge, the proposed clinical enthesopathy indices have never been used routinely for diagnostic/classification purpose. However, a US enthesopathy index has recently been proposed as a tool for differentiating patients with SpA from patients with mechanical back pain.6 Such enthesopathy indices have also been used as outcome measures in clinical trials.
The second investigation is the evaluation of a single location (mainly the heel) in order to differentiate patients presenting with a symptom other than heel pain (eg, back pain)—that is, patients with back pain related to SpA from those with mechanical back pain. The design of such a study has to clearly differentiate whether the patients evaluated had a history of heel pain or current symptoms of heel pain. To our knowledge, the single imaging study with this objective has been reported in 2003 and the results suggested that power Doppler US (PDUS) could be a useful tool for diagnosis and follow-up of SpA.8 There is no published study using MRI for this purpose.
The third is the investigation of a single location (eg, the heel) of patients presenting with a symptom suggestive of enthesopathy (eg, heel pain) with the objective of evaluating the signs allowing the differentiation of heel pain related to SpA from heel pain related to another aetiology.
The aim of the present comparative imaging study was to assess the sensitivity and specificity of both MRI and PDUS for heel enthesopathy in (1) patients with SpA compared with control patients with mechanical back pain (diagnostic capacity) and (2) among patients with SpA with and without heel pain (agreement with clinical assessment).
Materials and methods
Patients
Fifty-one patients with SpA were recruited between November 2006 and November 2008 for a single-centre cross-sectional study in a university hospital tertiary centre. All patients included had definite SpA according to expert opinion and fulfilled Amor's criteria.9 In fact, when this study was designed the Assessment of SpondyloArthritis Society (ASAS) criteria had not been published. We cannot retrospectively check the ASAS criteria since we do not have available sacroiliac MRIs for all the patients.
Patients treated with non-steroidal anti-inflammatory drugs, methotrexate (n=5) or sulfasalazine (n=8) were accepted. Exclusion criteria were: current or previous treatment with tumour necrosis factor (TNF) blockers, hind foot surgery and age <18 years.
In the patients with SpA, heel pain (posterior or inferior) was assessed by a senior rheumatologist based on symptoms and clinical examination. Heel pain was defined as typical inflammatory SpA pain (either posterior or inferior with pain at first step and reduction of pain with activity). The patients were divided into three clinical groups: (1) SpA without heel pain; (2) SpA with a history of heel pain; and (3) SpA with current heel pain.
For ethical reasons and practical reasons, we chose to include ‘healthy heels’ from hospitalised patients rather than including completely healthy patients. Twenty-four controls with mechanical low back pain were included consecutively. Controls were patients without SpA and without heel pain, hospitalised for definite mechanical low back pain with planned spinal steroid injections or infusions (aiming at matching age and sex). Controls were defined from expert opinion obtained during a multidisciplinary meeting based on clinical and imaging findings.
Evaluation criteria
All patients and controls had clinical assessment, PDUS and MRI examination on the same day. PDUS and MRI were performed by two different senior musculoskeletal radiologists blinded to all other data.
Clinical examination
The Achilles tendon and plantar aponeurosis were examined (spontaneous and provoked pain, swelling) in both heels of each patient by an expert rheumatologist. The clinical assessor was also blinded to imaging data.
Imaging PDUS
The PDUS examination was performed in all patients and controls by the same expert radiologist. The sonographic images were stored on a picture archiving and communication system and inter-reader reliability was assessed on still-image interpretation with another experienced radiologist for 20 patients. Both experts were blinded with regard to the disease status of the patients and patients were asked not to communicate with the PDUS examiner. The equipment was a 7–15 MHz linear array transducer (Toshiba Aplio). Power Doppler settings were standardised with a pulse repetition frequency of 750 Hz, a gain of 50–53 dB and a low wall filter. Patients were lying prone with their feet hanging over the edge of the examination table at 90° of flexion. The radiologist verified the absence of Achilles tendon tension before starting the examination. Achilles tendon and plantar aponeurosis insertion at the calcaneus were scanned bilaterally in the axial and sagittal planes. The following lesions were classified as signs of early injury: tendon and aponeurosis echostructure abnormalities, retrocalcaneal bursitis, thickening of the tendon and aponeurosis at enthesis insertion and at 1 cm from enthesis, power Doppler signal in retrocalcaneal bursa, tendon or aponeurosis (figure 1 and online supplementary file). The following lesions were classified as signs of chronic injury: calcifications, erosions and enthesophytes (figure 1 and online supplementary file).

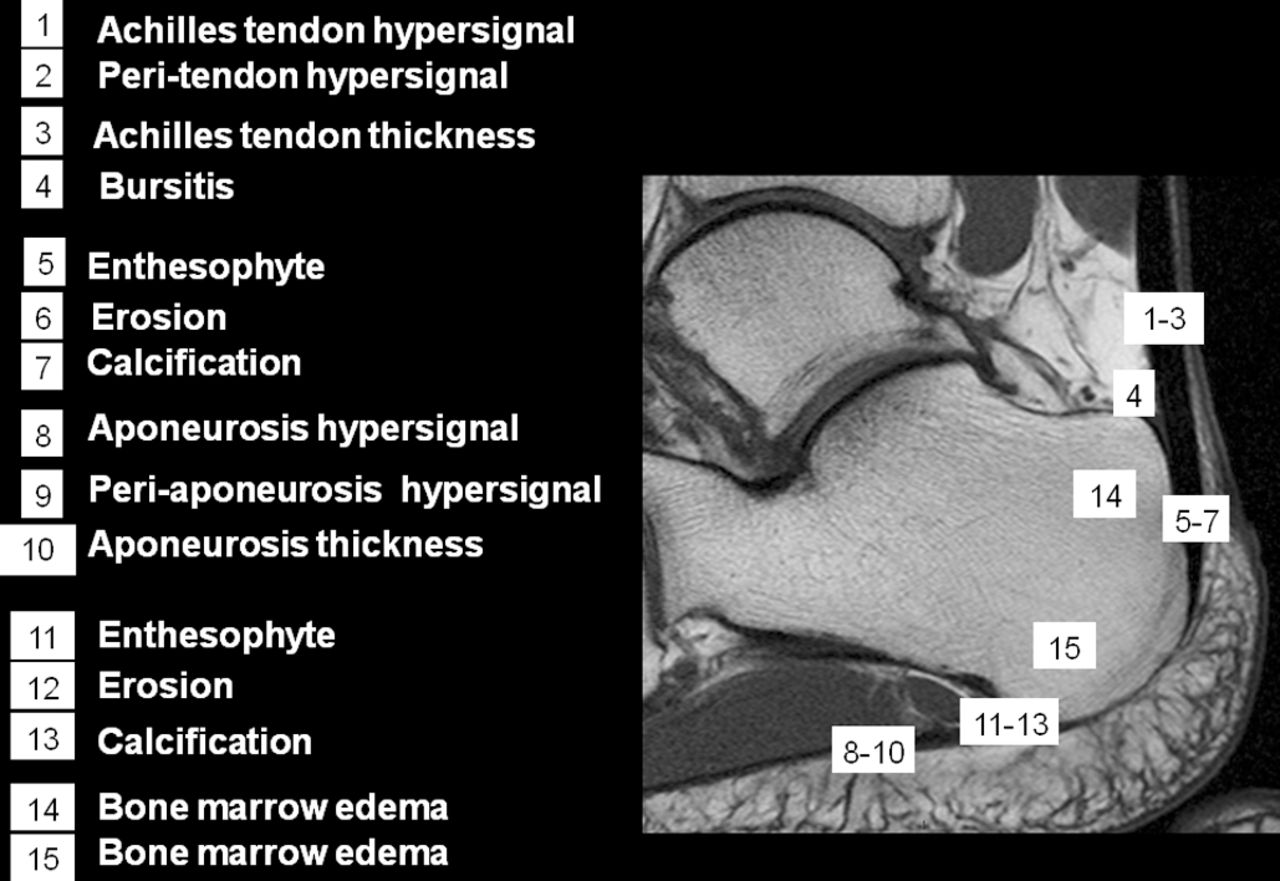
Sagittal T1-weighted MR image of the heel. Early lesions (1–9): (1) Achilles tendon echostructure or hypersignal; (2) peri-tendon hypersignal; (3) Achilles tendon thickening; (4) bursitis; (5) plantar aponeurosis echostructure or hypersignal; (6) peri-plantar aponeurosis echostructure or hypersignal; (7) plantar aponeurosis thickening; (8) posterior bone marrow oedema; (9) inferior bone marrow oedema. Chronic lesions (10–15): (10) posterior enthesophyte; (11) posterior erosion; (12) posterior calcification; (13) inferior enthesophyte; (14) inferior erosion; (15) inferior calcification.
MRI
MRI examination was performed on a 1.5 T MR system using a head coil by two expert musculoskeletal radiologists (AF and MCL). All MR images were stored on a picture archiving and communication system. Training sessions were performed on 20 patients to obtain good agreement before the study. All MR images were read in a blinded manner separately twice and disagreements were resolved by consensus. The MR imaging protocol included sagittal T1-weighted spin echo (TR=350 ms, TE=12 ms) and sagittal and coronal fat-suppressed short-τ inversion recovery (STIR) (TR=5000 ms, TI=150 ms, TE=72 ms) sequences of the hind foot. The field of view was 12 cm for sagittal images and 18 cm for coronal images. The image matrix was 256×256 for coronal and sagittal STIR images and 320×320 for sagittal T1-weighted images. The slice thickness was 3–4 mm and duration of MRI was 16 min. Analysis of MR images was blinded to clinical or PDUS data. The following lesions were classified as signs of early injury: Achilles tendon (tendonitis) or aponeurosis hypersignal, peri-tendon or peri-aponeurosis hypersignal, retrocalcaneal bursitis, inferior or posterior bone marrow oedema and thickening of the tendon or of the tendon insertion (figure 1 and online supplementary file). The following lesions were classified as signs of chronic injury: enthesophytes and bone erosions (figure 1 and online supplementary file).
Statistical analysis
Analyses were performed by patient, analysing the painful heel in patients with pain and the right heel for other patients. To augment the power of the study the data were also analysed by heel—that is, for each patient both heels were analysed and classified into one of the four groups (eg, a patient with SpA with pain in the right heel and a history of pain in the left heel would be analysed as one painful heel of SpA and one history of painful heel of SpA). For this analysis, 144 heels were analysed for MRI and 126 heels for PDUS. Continuous data were presented with statistical summaries (mean, median, range and SD) and binary data were presented by distribution of frequencies for each group. Each imaging feature was assessed separately, and heels were classified into normal/abnormal (heel considered abnormal if at least one of the imaging features was abnormal).
Differences between groups were tested by the non-parametric Fisher exact test for categorical variables and by the Wilcoxon unpaired test for continuous variables. p Values of <0.05 were considered statistically significant. Reproducibility was assessed using κ or prevalence-adjusted bias-adjusted κ in the case of non-interpretability of κ.10
Results
Patient characteristics
Seventy-five patients (53% men) were recruited (see flow chart in online supplement), including 51 with SpA and 24 controls. The patients had a mean±SD age of 50±18 years and mean±SD disease duration of 13±12 years. Among all the patients with SpA, 82% were human leucocyte antigen (HLA) B27 positive, 71% had current symptoms of inflammatory back pain, 64% had current symptoms of sacroiliitis and 15% had psoriasis. The demographic and clinical characteristics of the study patients are shown in table 1.
Demographic and clinical characteristics of patients with spondyloarthritis (SpA) and controls
Clinical assessment
The patients with SpA were classified into three groups according to the clinical findings: 25 without heel pain, 13 with a history of heel pain and 13 with current heel pain. Among the 13 patients with current heel pain, 10% had swelling, 38% had pain at pressure of the Achilles tendon and 67% had pain at pressure of the aponeurosis.
MRI and PDUS analysis
Seventy-five patients were analysed by MRI and 66 by PDUS. The analysis was conducted both by patients and by heels. No difference was observed in the results when the analysis was conducted by patients (data not shown) either for MRI or PDUS. Details of the analysis by heels are shown below.
MRI findings
Seventy-five patients (150 heels) underwent MRI; three patients were excluded as no clinical data were available (see flow chart in online supplement). Complete data are shown in table 2.
MRI analysis of the patients with spondyloarthritis (SpA) and controls by heel
We first analysed the data by pooling heels from all patients with SpA and comparing those heels with controls. Considering early signs of enthesopathy, two abnormalities were of interest: Achilles tendon insertion thickening was greater in control heels than in SpA heels (5.38±1.05 mm vs 4.54±1.79 mm, p<0.001) and more heels of patients with SpA had inferior bone oedema than control heels (18% vs 2%, p=0.02) (figure 2). No difference in chronic signs of enthesopathy was observed between SpA and controls on MRI.

MRI and power Doppler ultrasonography (PDUS) in a patient with spondyloarthritis (SpA) and current heel pain. (A) T1-weighted MR sagittal image. (B) Suppressed short-τ inversion recovery (STIR)w MR coronal image. (C) STIRw MR sagittal image. Calcaneal inferior bone marrow oedema (arrow head) and focal bone erosion (arrow) are shown close to the aponeurosis enthesis, together with thickening and intra-aponeurosis high signal area (curved arrow). (D) PDUS sagittal image. Aponeurosis thickening with loss of fibrillar pattern and Doppler signal (arrow head) are shown associated with bone erosion (arrow).
We then analysed data by comparing the findings in heels of patients with SpA with current heel pain with the heels of other patients with SpA (no current heel pain) pooled together. Considering early signs of enthesopathy, no difference between abnormalities was observed on the Achilles tendon. Plantar aponeurosis insertion was thicker in heels of patients with SpA with current pain than in heels from other patients (3.79±1.37 mm vs 3.04±0.61 mm, p=0.006). An increased aponeurosis signal was observed more frequently in heels of patients with SpA with current pain than in heels from other patients (67% vs 24%, p<0.001). Furthermore, inferior bone oedema measurement was increased in heels of patients with SpA with current pain in comparison with heels from other patients (3.48±5.59 mm vs 0.87±2.50, p=0.03). Considering chronic signs of enthesopathy, we observed some discrepancies depending on the localisation of the lesions. Thus, enthesophytes were more frequent on the Achilles tendon insertion in patients without heel pain (22% vs 0%, p=0.019) but were more frequent at aponeurosis insertion in patients with heel pain (38% vs 16%, p=0.037).
PDUS findings
Nine patients who underwent MRI examination were not available for the PDUS examination schedule; 63 patients underwent PDUS (see table 3 and flow chart in online supplement). As for MRI, we first analysed pooled data from all patients with SpA and compared them with controls. No significant difference was observed between patients with SpA and controls in signs at the insertion of the Achilles tendon, the retrocalcaneal bursa or the plantar aponeurosis (figure 3). When findings in heels from patients with SpA with current heel pain were compared with heels from other patients with SpA pooled together, the following abnormalities were more frequent among painful heels than in heels with no pain (58% vs 17%, p<0.001). More heels presented with Achilles tendon thickening of >5.29 mm in patients with SpA with current heel pain than in other patients with SpA pooled together (31% vs 10%, p=0.033); the aponeurosis was also slightly thicker in the heels of patients with SpA with current heel pain than in the heels of other patients with SpA (3.9 mm vs 3.1 mm, p=0.007; figure 2). Moreover, the aponeurosis was abnormal more frequently in those same heels (32% vs 5%, p=0.004). PDUS did not show any difference between patients with SpA and controls or between painful heels and heels without pain.

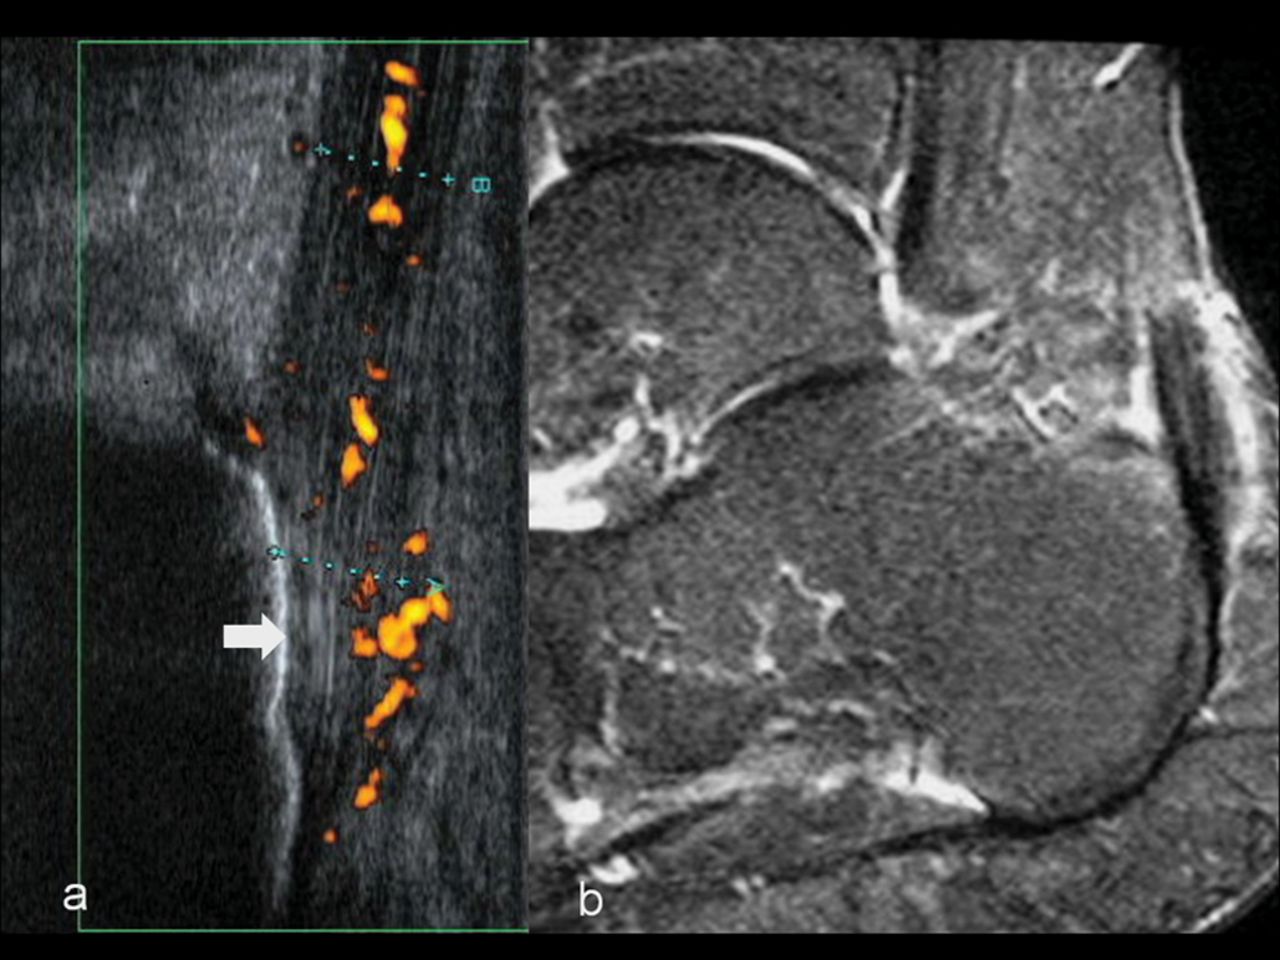
MRI and power Doppler ultrasonography (PDUS) in a patient with spondyloarthritis (SpA) and a history of heel pain. (A) PDUS sagittal image, intratendinous Doppler signal. No Doppler signal close to cortical bone (arrow). (B) STIRw MR sagittal image, intra and peri-tendinous high signal abnormalities and retrocalcaneal bursitis.
Power Doppler ultrasonography (PDUS) analysis of patients with spondyloarthritis (SpA) and controls by heel Please note that table 3 is not cited in the text.
Interobserver reliability of MRI and PDUS on 20 patients was high. For MRI, κ=1 except for right bursitis and right aponeurosis thickness (κ=0.64 for both). For PDUS, prevalence-adjusted bias-adjusted κ ranged from 0.91 to 1.
MRI and PDUS findings: summary of relevant results
With MRI, abnormalities of the heels were observed in 81% of patients with SpA with current heel pain compared with 56% of other patients with SpA (SpA without heel pain and SpA with history of heel pain) (p<0.005). Similarly, PDUS abnormalities were observed in 58% and 17% of these groups, respectively (p<0.001). With MRI, abnormalities of the heels were observed in 53% of patients with SpA without heel pain compared with 67% of controls (p=0.045) Similarly, PDUS abnormalities were observed in 12% versus 28%, respectively (p=0.008). To distinguish patients with SpA from controls, only oedema of the calcaneum on MRI was specific to SpA (94%) but was not sufficiently sensitive for diagnosis (22% of all patients with SpA).
To assess painful heels in ankylosing spondylitis, the most useful features were intra- or peri-aponeurosis signal abnormalities on MRI (sensitivity 70%, specificity 78%) and the presence of any of several early signs on PDUS (sensitivity 58%, specificity 87%). Bone oedema on MRI was specific to painful heels (specificity 86%) but was not often present (38% of painful heels). PDUS was rarely positive, even in painful heels (11%).
Discussion
In this study MRI and PDUS showed a number of abnormalities including early and chronic signs of enthesopathy in patients with SpA. However, these abnormalities were not specific of a diagnosis of SpA as they were all also observed in controls with mechanical low back pain. Thus, the comparison between imaging findings in patients with SpA without heel pain and controls showed that PDUS and MRI abnormalities were more frequent in controls.
The small sample size, which could impact on the statistical power, is a limitation of this study. However, we did not observe even a trend in favour of a difference in MRI and PDUS findings between SpA groups and controls. Moreover, to our knowledge, this prospective study included one of the largest groups of patients evaluated for the diagnostic ability of MRI and PDUS in heel enthesopathy in patients with SpA. MRI and PDUS were performed and analysed on the same day as the clinical visit by two experienced musculoskeletal radiologists. Furthermore, the PDUS and MRI interobserver reliability was very good and correlation between PDUS and MRI global results was high enough (data not shown) for us to be confident with the data presented. Similarly, we tried to use different published scoring systems for the assessment of heel enthesopathy but the results were unchanged (data not shown).5,–,8 Despite the high number of abnormalities revealed by MRI and PDUS in patients with SpA, no differences were found compared with the control group. This is in contradiction with previous reported studies.7 8 One study found no Doppler abnormality in a control group with mechanical back pain and 81% abnormal entheses in patients with SpA8 whereas, in our study, hypervascularisation with power Doppler was positive in only 5% of patients with SpA and 6% of controls. Positive Doppler findings were observed only in the Achilles tendon and never in the plantar aponeurosis. This means that Doppler has a low validity in plantar aponeurosis, and only in very active patients did the Doppler signal appear in this location.
Furthermore, when we observed a power Doppler signal at the enthesis, it was always associated with bone erosions in both patients with SpA and controls. As power Doppler is highly sensitive to strong specular reflectors, false positive Doppler signals called edge artefacts and twinkling artefacts may be visualised in the vicinity of the cortical bone and confused with true vascularisation.11 Edge artefact appears as a steady signal along the rim of the cortical bone. The twinkling artefact is generated by a strongly reflective medium composed of individual reflectors with very different acoustic impedance.12 The twinkling artefact is determined not to be a true vascularisation of enthesopathy because this signal band completely disappears upon stabilisation of US probe application at the same region. The twinkling artefact is observed most strongly behind the cortical surface of the bone in the absence of cortical bone erosion or other destructive change.13 Thus, the presence of a power Doppler signal close to the bony entheses of the heel should be interpreted with caution.
In our study the control group, which included patients with mechanical back pain, had a very high rate of abnormalities compared with other studies.5,–,8 14 However, all the patients included in our study had been diagnosed by expert rheumatologists as having either mechanical back pain or SpA. These similarities between controls and patients with SpA may be explained by the selection of patients with SpA with low disease activity since patients treated with anti-TNF agents were excluded from our study. We do not have a specific explanation for the imaging abnormalities in the controls; in particular, the controls had no physical activity at the time of assessment. Further studies of heels in non-SpA patients are therefore needed. The only abnormality found more frequently in patients with SpA by MRI was bone oedema, but this sign was limited to 18% of patients with SpA and was also present in 4% of the controls. In any case, it is not possible to assess bone marrow inflammation with PDUS.
Our data therefore suggest that neither MRI nor PDUS of the heel is useful in the diagnosis of SpA. However, with regard to the SpA groups, both MRI and PDUS showed more early lesions among painful heels, suggesting that MRI and PDUS may be helpful in patients with SpA who currently have heel pain. An imaging study using PDUS and MRI in patients with SpA with symptoms and tenderness on palpation related to the Achilles enthesis was recently published. This study focused on the Achilles tendon and showed that MRI demonstrates more tendon abnormalities than PDUS in this clinical setting.15
Our study, conducted in a tertiary centre, evaluated both MRI and PDUS in the assessment of heel enthesopathy in patients with SpA. The findings show that PDUS of the heel should not be used as a screening tool for the diagnosis of SpA. MRI of the heel did not perform better for that purpose. Heel imaging with PDUS or MRI is not useful in patients with SpA without heel pain. However, in patients with SpA who have heel pain, both MRI and PDUS showed significantly more abnormalities than in patients with SpA without heel pain. These findings suggest that MRI and PDUS could be useful in the diagnosis of enthesopathy in patients with SpA.
References
Supplementary materials
Supplementary Data
This web only file has been produced by the BMJ Publishing Group from an electronic file supplied by the author(s) and has not been edited for content.
Files in this Data Supplement:
- Web Only Data - This web only file has been produced by the BMJ Publishing Group from an electronic file supplied by the author(s) and has not been edited for content.
Footnotes
-
Competing interests None.
-
Patient consent Obtained.
-
Ethics approval Approval for the study was obtained from the institutional ethics committee.
-
Provenance and peer review Not commissioned; externally peer reviewed.