Article Text

Abstract
Objectives To evaluate if the mean smallest detectable change (SDC) of multiple time intervals using the Bland & Altman (B&A) levels of agreement (LoA) method is an appropriate surrogate for the generalisability analysis method for estimating the overall SDC of radiological progression in rheumatoid arthritis (RA) trials. Secondly, to compare the SDC based on 95% LoA with the SDC based on 80% LoA, and to investigate the association between SDC and baseline damage and progression.
Methods Fifteen datasets from randomised controlled trials in RA were scored by 13 experienced readers as pairs according to the modified Sharp/van der Heijde method. The SDC using the 95% and 80% LoA and the generalisability methods was calculated.
Results 21 295 radiographic time points from 7643 patients were included. The mean (range) SDC for the LoA and the generalisability methods was 3.1 (2.3–4.3) and 3.2 (2.3–4.6) units, respectively. The mean±SD difference between the two methods was −0.13±0.28. The mean SDC including all intervals (n=31) was 3.0±0.7 for 95% LoA and 2.0±0.4 for 80% LoA. No relationship was observed between baseline damage and the SDC, whereas the SDC increased with increasing radiological progression.
Conclusions The mean of the interval SDCs obtained by the simple LoA method is a valid surrogate for the SDC obtained by complex generalisability methods. The SDC depends on the level of radiographic progression rather than on the level of absolute damage. In addition, the use of an SDC based on 80% rather than on 95% LoA is proposed.
- Rheumatoid Arthritis
- Outcomes research
- Quality Indicators
Statistics from Altmetric.com
Introduction
Prevention of structural damage has been included as one of the claims in the US Food and Drug Administration1 and the European Medicines Agency (EMA) guidelines on clinical investigation of new drugs for treatment of rheumatoid arthritis (RA).2 The gold standard imaging technique for assessing the degree of structural damage is conventional radiography,3 and the Sharp/van der Heijde Scoring (SHS) method is the method recommended by the EMA for assessing radiological progression.2
Reliability of the scoring method is essential to be able to detect differences in radiological progression between treatment arms, in order to assess the efficacy of therapeutic interventions in randomised controlled trials (RCTs). Reliability can be reported in relative terms using statistics such as intraclass correlation coefficients; however, descriptions of other statistics such as the smallest detectable difference (SDD) and the smallest detectable change (SDC) is recommended because they provide an estimate of absolute rather than relative reliability, and they may give clinical guidance for assessing real changes at the individual patient level.4 While the SDD has been recommended as one of the measures in the guidelines on reporting radiographic data of RCTs in RA, the SDC is nowadays recognised as the preferred measure for absolute agreement.5 ,6 The SDD is appropriate for determining if progression in patient A is different from progression in patient B. In order to determine if progression in an individual patient is beyond measurement error, however, the SDC is the most appropriate statistic.5 ,6
At least two analytical methods for estimating the SDC are available: one ‘simple’ method is based on the standard deviation (SD) of the difference between change scores obtained by two readers resulting in 95% levels of agreement (LoA) (also referred to as the Bland & Altman (B&A) method); the other method is more complex and based on generalisability analysis (the analysis of variance (ANOVA) method).
Two arguments challenge the methodology of obtaining SDC cut-off levels as appropriate surrogates for inter-reader reliability.
-
The simple LoA method is only applicable if two scores (twice scored by the same observer or two observers) are obtained. In the case of multiple time points or multiple readers (complex databases), which is common in RA trials, only a generalisability analysis is appropriate. However, estimating the SDC in complex databases requires more statistical expertise and is more laborious, and a simpler method is warranted.
-
The SDC is calculated using 95% LoA, basically assuming that 95% of the inter-reader differences between paired observations in a scenario with two readers is captured within the area delineated by the upper and lower 95% LoA, and that no more than 5% of the differences are more extreme. It can be argued that this requirement is rather strict. For example, it has been shown that the SDD (SDC multiplied by squared root (SQRT2)) is a conservative estimate, as rheumatologists have rated progression at or below this level as clinically significant.7 Further, there is no scientific basis for choosing a 95% limit over a less strict limit, and one may argue that the use of 80% LoA is not only sufficiently strict to select a cut-off to determine if a patient shows progression beyond measurement error, but is also closer to reality in terms of what clinicians consider relevant.
The principal aim of this study is twofold: first, to evaluate if the mean SDC of multiple time intervals in complex databases using the ‘simple’ LoA method per interval is an appropriate surrogate for the generalisability analysis for estimating the overall SDC of radiological progression; second, to compare the SDC based on 95% LoA with the SDC based on 80% LoA, and to investigate the association between baseline radiological damage/radiological progression and the magnitude of the SDC.
Methods
Data were extracted from 15 databases of RCTs testing biological treatments in patients with RA. All these trials were performed according to good clinical practice and all studies received ethics approval. We selected these studies because they had been used for registration purposes using similar methodologies and all scored by members of our group according to the SHS method.8 Thirteen experienced readers, who had all received the same training, scored all digitised films in pairs on a 21 CFR Part 11 compliant read system deployed by BioClinica, Code of Federal Regulations. The readers were blinded to patient identification, treatment and chronology of the time points. Initially, the total SHS for all patients was calculated per visit and per reader for all visits. Next, the SDC was calculated using the simple LoA9 and a generalisability analysis as follows.
LoA (B&A method)
First, the change score per reader was calculated on a per time-point basis (baseline–first follow-up, first follow-up–second follow-up, and second follow-up–third follow-up (if applicable)), and subsequently the difference in change scores between the two readers was calculated. Second, the SD of that difference was calculated. The SDC for all intervals of each trial was estimated using the formula (±1.96×SD)/(√2×√k) for 95% LoA and (±1.28×SD)/(√2×√k) for 80% LoA, in which k represents the number of readers within the same reading session (equals 2 in this study). Finally, we estimated a mean 95% LoA SDC per study by calculating the average of the 95% LoA SDCs of all intervals of the study (SDC1st interval+SDC2nd interval+SDC3rd interval……+SDCn interval)/n.
Generalisability analysis (ANOVA method)
For the generalisability analysis, we performed an ANOVA as proposed by Bruynesteyn et al.6 Random variation in change scores (the residual error) per trial was determined, taking into account all the time points from the same trial, using a full-factorial univariate linear model, as detailed in the statistical analysis below. The standard error of the mean (SEM) was calculated by taking the square root of this residual error, and the SDC for all intervals of each trial was estimated using the formula (±1.96×SEM)/√k for 95% LoA and (±1.28×SEM)/√k for 80% LoA, where k represents the number of readers (equals 2 in this study).
To compare the B&A method with the ANOVA method, we excluded studies with only two time points (n=2) from this analysis.
Statistical analysis
For descriptive purposes, the values including the characteristics of all RCTs are presented as median (IQR). All treatment arms were considered as one per trial. The variance components (including residual error) were estimated by three-way ANOVA, with change score between two time points per reader as the dependent variable, patient and reader as random factors, and time interval as fixed factor, and all possible interactions (patient×reader, patient×time interval and patient×reader×time interval) were also included in the ANOVA to obtain the residual error components. Statistical analysis was performed using SPSS software V.18.0.
Results
A total of 21 295 time points from 7643 patients were included in the analysis. From all RCTs, two studies had two time points, 10 studies had three time points, and three studies had four time points. The median (range) sample size of the studies was 517 (103–921) patients, and the number of time points within one reading session was two for 1172 patients, three for 5296 patients, and four for 1175 patients. The median (IQR) disease duration of patients included in the studies was 6 (3–7) years, and the median (IQR) baseline radiological damage and progression in SHS to last follow-up across all studies was 32 (18–48) and 1.1 (0.5–2.0), respectively.
Since the principal aim of this study was to propose a surrogate for the ANOVA method for calculating the SDC when more than two time points are scored within the same reading session, we evaluated the agreement between the two different methods (LoA method and ANOVA method) using a B&A plot; this means plotting the difference between the methods against their mean as shown in figure 1. The mean (range) SDC over the included studies based on the 95% LoA and ANOVA methods was 3.1 (2.3–4.3) and 3.2 (2.3–4.6) units, respectively. The mean±SD difference between the two methods was −0.13±0.28, range (−0.48, 0.25) units. The mean of the SDC for all studies was somewhat higher for the ANOVA method (not statistically significant). No particular trend was observed, and therefore the difference between the two methods did not tend to get larger (or smaller) as the average discrepancy increased. The variability was also consistent along the range of observations (homoscedasticity of the scatter). Moreover, median values for the difference between the 95% LoA and ANOVA methods were higher in studies with less radiographic damage at baseline and less radiographic progression compared with studies with more radiographic damage and progression (−0.22 vs 0.07 and −0.22 vs 0.04, respectively), but no differences in the range was observed (see online supplementary table S1).

Difference in smallest detectable change (SDC) between the Bland & Altman (B&A) levels of agreement (LoA) method (mean of all intervals) and the analysis of variance (ANOVA) method (taking into account all intervals), for trials with two or more intervals.
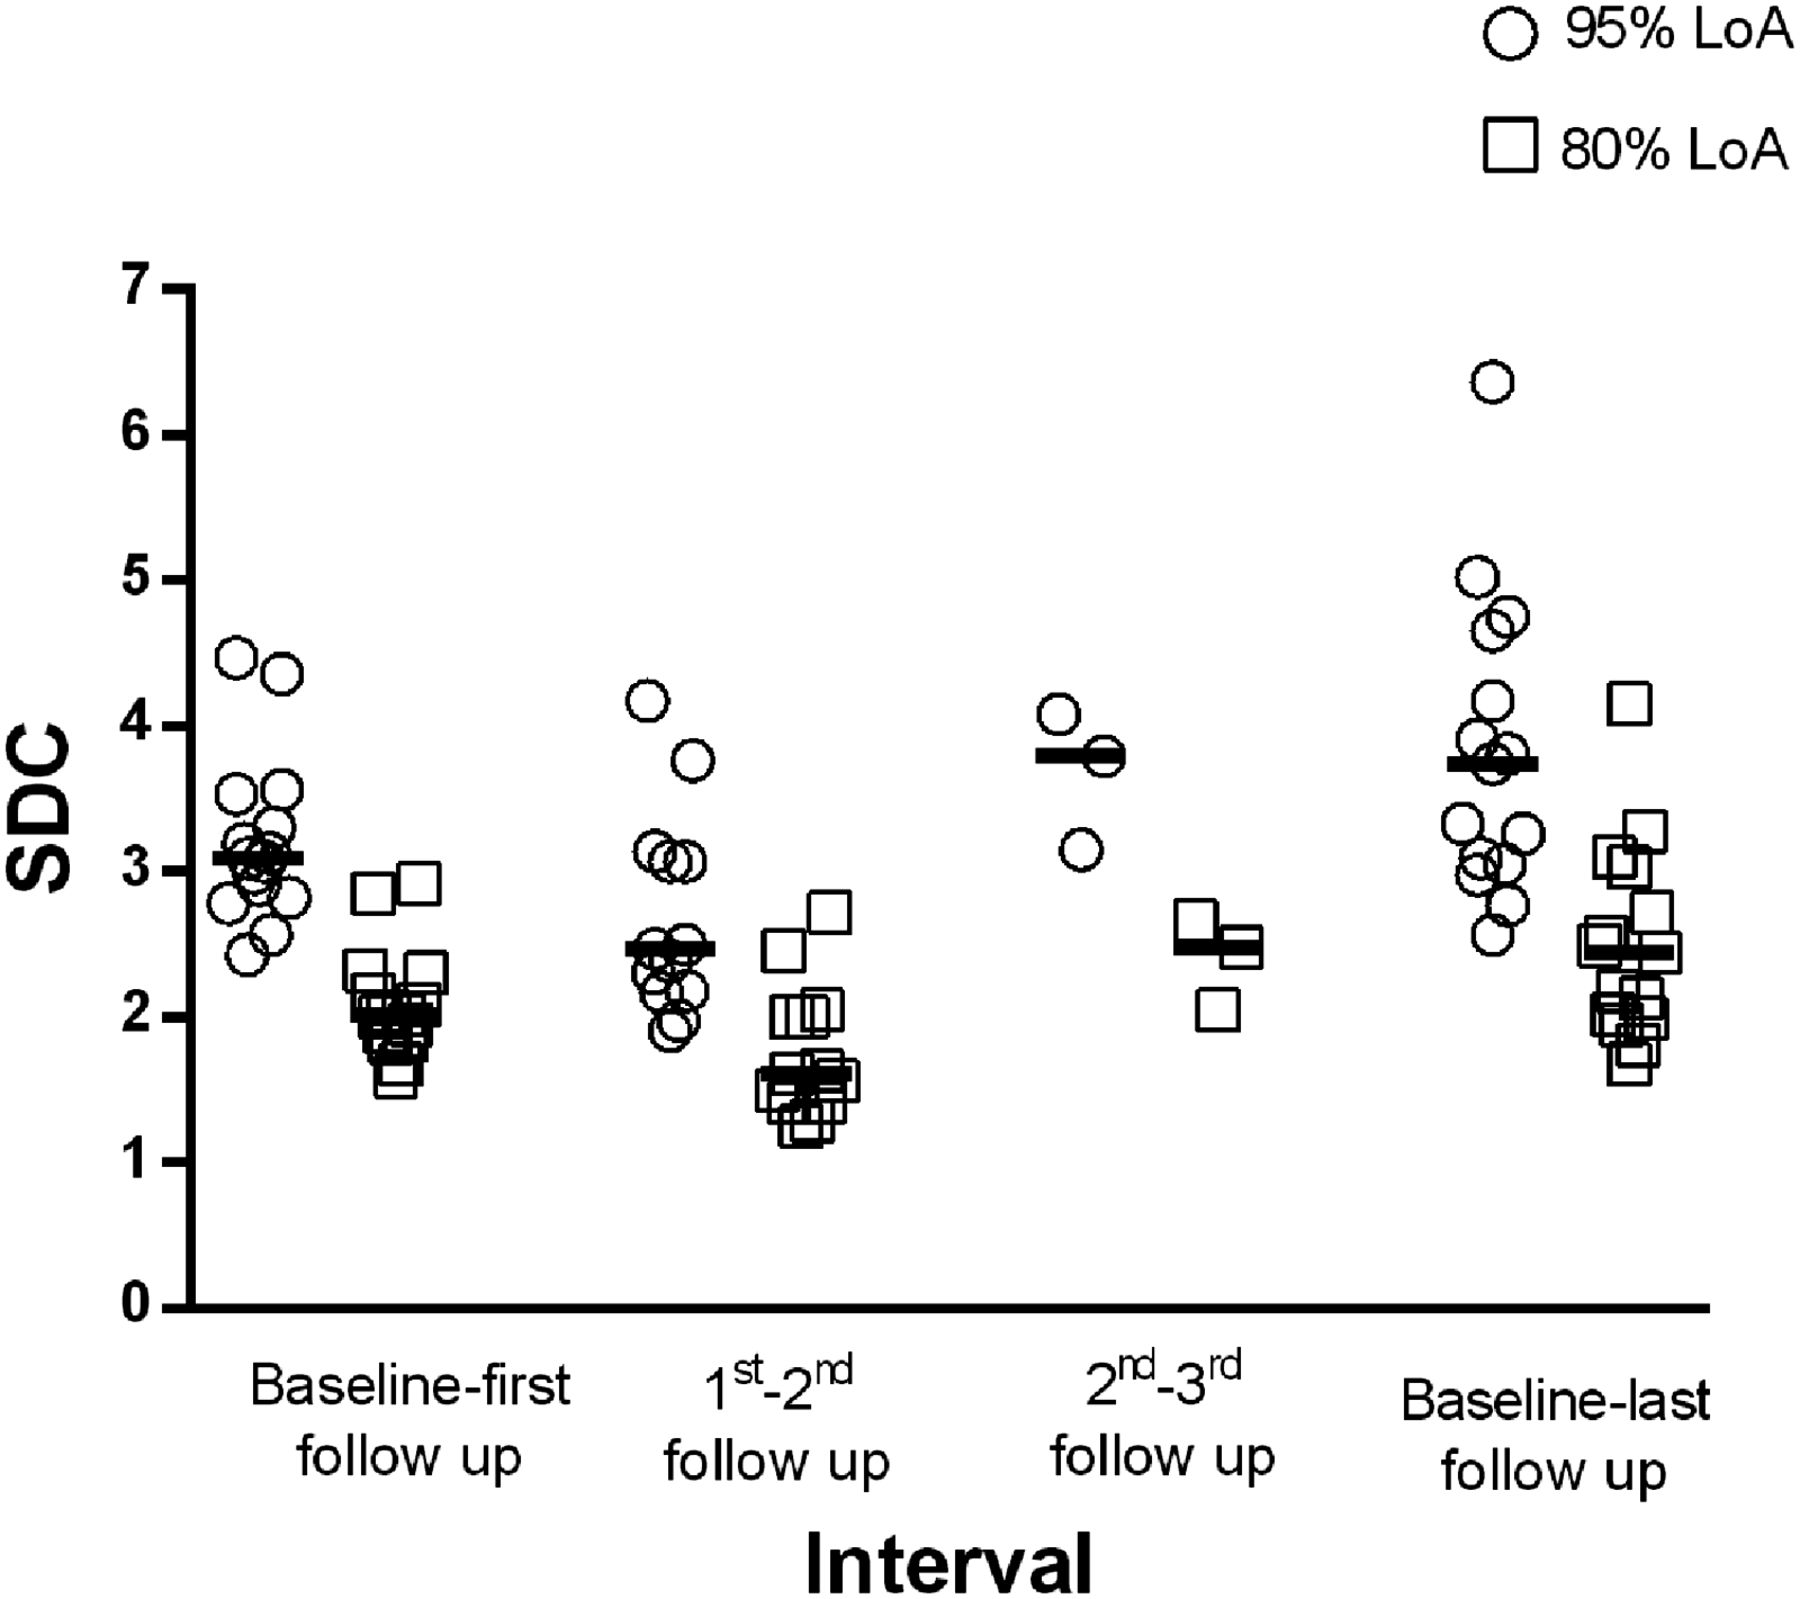
Second, we compared the SDC based on the 95% LoA with the SDC based on the 80% LoA using the LoA method. Figure 2 shows the SDC values for all intervals and studies based on both LoAs. The median (range) difference between the 95% and 80% LoA SDCs was 1.1 (0.8–1.6) for the first interval, 0.9 (0.7–1.5) for the second interval, and 1.3 (1.1–1.4) for the third interval. The mean±SD SDC including all the SDCs calculated for all intermediate intervals (n=31) was 3.0±0.7 for 95% LoA and 2.0±0.4 for 80% LoA.

Smallest detectable change (SDC) for 95% and 80% levels of agreement (LoA) based on the LoA method.
Finally, we also investigated if there was an association between baseline radiological damage and radiographic progression to last follow-up with the SDC. We did not observe any relationship between the degree of damage at baseline (SHS) and the SDC (r2=0.01, p=0.8) (figure 3A), while an association between radiological progression and the SDC was obvious (r2=0.64, p<0.001; figure 3B), indicating that the SDC is higher in trials with more progression, although this relationship is strongly influenced by two trials with the highest progression rate.

Association between baseline radiographic damage and radiographic progression with smallest detectable change (SDC) for 95% level of agreement. Regression lines summarise the association of radiographic damage (A) and radiographic progression to last follow-up (B) with the SDC. SHS, Sharp/van der Heijde Score.
Discussion
The results of this analysis suggest that, in complex databases with multiple time points and time intervals, the mean of the interval SDCs obtained by the simple LoA method is a valid surrogate for the ‘umbrella SDC’ obtained by complex methods based on the generalisability theory. Further, we have found evidence that the SDC is dependent on the level of radiographic progression in a trial rather than on the level of absolute damage. In addition, we here propose the use of an SDC based on 80% rather than 95% LoA, for reasons explained below.
The maximum discrepancy in SDCs of 0.48 unit when calculated by the two methods, and the systematic difference of only 0.13 unit is negligible, in the light of the minimal clinically important difference (MCID) of 3–4.5 units for radiographic progression.10 On the other hand, we should take into account the fact that this MCID cut-off was selected on the basis of results of a study performed when biological agents were just entering clinical use and therefore when tolerance for progressive joint damage was less strict. However, we consider it very unlikely that an updated MCID would even approach 0.48 unit.
Further, there was consistency in variability, and no particular trend was observed when the two methods were compared, which adds to the validity of the mean LoA method. Obviously, the mean LoA method has important advantages in that it is simpler, less time consuming, and more familiar to researchers.
With respect to the proposal to base SDCs on the 80% LoA, it can be argued that there is no solid scientific basis to choose 95% instead of a lower LoA. The 95% cut-off level has its basis in distribution theory, where it is a boundary for including 95% of observations of a distribution with standard normal (‘bell-shaped’) properties (the mean±2 SDs), and was therefore probably chosen because it resembles the 95% CI used in statistical hypothesis testing. Conceptually, though, CI and LoA are not related: whereas 95% CI statistically tests the null hypothesis that the mean difference in change scores obtained by two readers is zero, the 95% LoA quantifies the boundaries that include 95% of all paired observations and has nothing in common with hypothesis testing.11 The justification for choosing boundaries other than 95% as LoA depends on the relevance of avoiding potential misclassifications. In radiographic analysis, the SDC concept is used to determine whether a patient is a ‘true progressor’ (ie, progression beyond reasonable measurement error) or not (ie, progression still compatible with measurement error, and therefore classified as zero progression). If an 80% LoA is accepted as the basis for the SDC, and the SDC is accepted as the level that distinguishes ‘progression beyond measurement error’ from ‘progression still compatible with measurement error’, more patients will be accepted as ‘true progressors’. Obviously, there will also be some more ‘progressors’ for whom progression is due to measurement error, but this misclassification will affect both arms of an RCT in an unbiased manner. Given the context of the RCT, in which a treatment is tested against a comparator for its potential to avoid radiographic progression, and the current mean progression scores observed in such trials, it is unlikely that a cut-off level based on an 80% SDC will spuriously influence the trial results. In fact, a trial with higher percentages of patients with progression per trial arm may provide increased conservatism, which is advantageous from the perspective of internal validity of a trial. In the light of the well-recognised phenomenon of deflating radiographic progression rates over time in clinical trials,12 increased rates of ‘progressors’ per trial arm using more lenient SDC cut-offs is advantageous for the statistical power of a trial. Increased misclassification is unlikely to be relevant here, since one may expect that these misclassifications will be evenly distributed among trial arms. However, the ultimate effect will depend on the analyses and the degree of misclassification.
It is therefore proposed that 80% LoA-based SDCs be used instead of 95% LoA-based SDCs, so that measurement error is substantially lower than the change in radiographic damage that rheumatologists consider clinically relevant: approximately 3 units.10
Another observation of note was that the degree of joint damage at baseline did not influence the SDC, whereas the level of radiographic progression did have a slight influence on the SDC—that is, the SDC tended to increase with increasing radiographic progression rates. The first observation is somewhat unexpected, since readers usually recognise unaffected joints relatively easily and in general achieve a high level of agreement, while they have to make far more decisions in the case of multiple affected joints with different states of joint involvement. An explanation could be that the studies included in this analysis covered a relatively small range of potential involvement at baseline (10–65 units). SDCs may therefore still be relatively low if baseline joint damage is low to moderate, but increase if baseline damage exceeds 65 units. Moreover, trials with even lower baseline damage were not included and therefore baseline damage below 10 could not be tested. This study does not provide resolution for this. The second observation of increasing SDCs with increasing progression rates is in compliance with what has been found in detailed analyses. In a recent analysis of the TEMPO trial,13 with four independent reads of the same patient, a very high level of agreement was reached for the great majority of individual joints that showed zero progression in SHS. In contrast, agreement on a per joint basis was poor in those joints that were scored as ‘progressive’ by at least one of the four readers. This lack of agreement is lost when total per-patient scores are calculated, as is standard practice or in evaluation in RCTs, explaining increasing SDCs with increased progression rates. A limitation of this observation is that this positive correlation was largely determined by two trials.
A limitation of our study is that the maximum number of time points within the same reading session in the RCTs included was four, so we do not know if these results would be applicable if five or more time points are present. However, not many clinical trials include more than four time points in one read campaign, and the question is therefore rather theoretical. Importantly, all images were scored in unknown chronological order by experienced readers, and these results cannot be extrapolated to reads with known time order and to reads by inexperienced readers or those that have not been trained similarly. Although a recent study suggests that chronological reading is more precise than random reading,14 regulatory agencies still require radiographs to be scored randomly. Random scoring is therefore still considered the reference setting.15 Moreover, although not tested, it can be assumed that the issues addressed in this paper are equally applicable to studies scored in chronological order, as the topics under investigation in this study are not directly influenced by the (un)blinding of the time order.
In conclusion, for reasons of convenience, we propose to report the mean of all interval SDCs as an appropriate surrogate for the ANOVA-based SDC in trials with multiple time points. In addition, we consider an SDC based on an 80% LoA to be an acceptable alternative to an SDC based on a 95% LoA. For the SHS method, based on these large datasets involving many different readers, we propose a cut-off level of 3.0 units for a 95% LoA SDC and 2.0 units for an 80% LoA SDC as the threshold for deciding if the RA of an individual patient shows radiographic progression.
References
Supplementary materials
Supplementary Data
This web only file has been produced by the BMJ Publishing Group from an electronic file supplied by the author(s) and has not been edited for content.
Files in this Data Supplement:
- Data supplement 1 - Online table
Footnotes
Handling editor Tore K Kvien
-
Contributors VN-C and RW performed the statistical analysis. DvdH and RL participated in the design of the study and interpreted the results. VN-C, DvdH, HAA, CGM, RW and RL drafted the manuscript. All authors read and approved the final manuscript.
-
Funding VN-C was partially supported by a grant from the Fundación Española de Reumatología.
-
Ethics approval Ethics permission was obtained from local ethics committees for each study.
-
Competing interests DvdH has received consulting fees and/or research grants from AbbVie, Amgen, AstraZeneca, BMS, Centocor, Chugai, Daiichi, Eli-Lilly, GSK, Janssen Biologics, Merck, Novartis, Novo-Nordisk, Otsuka, Pfizer, Roche, Sanofi-Aventis, Schering-Plough, UCB and Vertex and is Director of Imaging Rheumatology bv. HAA is an employee of BioClinica. CGM is an employee of BioClinica and at the time of the study was also a shareholder of BioClinica. RL has received consulting fees and/or research grants from AbbVie, Amgen, AstraZeneca, BMS, Centocor, Chugai, GSK, Janssen Biologics, Merck, Novartis, Pfizer, Roche, Schering-Plough, UCB, Vertex and is Director of Rheumatology Consultancy bv.
-
Provenance and peer review Not commissioned; externally peer reviewed.