Article Text

Abstract
Aims: To investigate the phenotype of cells in normal and degenerate intervertebral discs by studying the expression of molecules characteristic of chondrocytes in situ.
Methods: Human intervertebral discs taken at surgery were graded histologically, and classified on this basis as normal or degenerate. Eighteen of each type were selected, and in situ hybridisation was performed for the chondrocytic markers Sox9 and collagen II using 35S labelled cDNA probes. Aggrecan was located by immunohistochemistry, using the monoclonal antibody HAG7E1, and visualised with an avidin–biotin peroxidase system.
Results: In the normal discs, strong signals for Sox9 and collagen II mRNA, and strong staining for the aggrecan protein were seen for the cells of the nucleus pulposus (NP), but reactions were weak or absent over the cells of the annulus fibrosus (AF). In degenerate discs, the Sox9 and collagen II mRNA signals remained visible over the cells of the NP and were again absent in the AF. Aggrecan staining was not visible in the NP cells, and was again absent in the AF.
Conclusions: Cells of the normal NP showed expression of all three markers, clearly indicating a chondrocytic phenotype. In degeneration, there was evidence of a loss of aggrecan synthesis, which may contribute to the pathogenesis of disc degeneration. AF cells showed no evidence of a chondrocytic phenotype in either normal or degenerate discs.
- AF, annulus fibrosus
- BSA, bovine serum albumin
- DTT, dithiothreitol
- EDTA, ethylenediamenetetraacetic acid disodium salt
- H&E, haematoxylin and eosin
- NP, nucleus pulposus
- PBS, phosphate buffered saline
- SCC, standard saline citrate
- TBS, Tris buffered saline
- intervertebral disc
- chondrocyte
- phenotype
- AF, annulus fibrosus
- BSA, bovine serum albumin
- H&E, haematoxylin and eosin
- NP, nucleus pulposus
- PBS, phosphate buffered saline
- TBS, Tris buffered saline
Statistics from Altmetric.com
- AF, annulus fibrosus
- BSA, bovine serum albumin
- DTT, dithiothreitol
- EDTA, ethylenediamenetetraacetic acid disodium salt
- H&E, haematoxylin and eosin
- NP, nucleus pulposus
- PBS, phosphate buffered saline
- SCC, standard saline citrate
- TBS, Tris buffered saline
- intervertebral disc
- chondrocyte
- phenotype
- AF, annulus fibrosus
- BSA, bovine serum albumin
- H&E, haematoxylin and eosin
- NP, nucleus pulposus
- PBS, phosphate buffered saline
- TBS, Tris buffered saline
Low back pain is one of the most common causes of morbidity in the West today, with 60–80% of people affected at some point in their lives.1 A variety of studies indicate that in a large proportion of cases low back pain is associated with degeneration of the intervertebral discs.2–6
In the normal intervertebral disc, the nucleus pulposus (NP) exerts a hydrostatic pressure against the constraining annulus fibrosus (AF), which allows the disc to maintain flexibility between adjacent vertebrae, while absorbing compressive forces. The NP performs this role because of its hydrophilic gel-like structure. The extracellular matrix of the NP is up to 80% hydrated,7 as a result of large amounts of the aggregating proteoglycan, aggrecan. This proteoglycan is enmeshed in a randomly orientated network of fine type II collagen fibres, (collagen I in the AF).8,9
Degeneration involves all parts of the disc. Although disorders of the AF10 and the cartilaginous endplates11 have been implicated in initiating degeneration, alterations to the chemical composition of the NP, and subsequent changes in its physical structure are a constant feature of degeneration. Chief among these is a reduction in the proteoglycan content of the NP, and there is reason to believe that loss of proteoglycan may be the cause of degeneration.12
“There are no in situ studies examining whether cells of the intervertebral disc express the classic markers of a chondrocytic phenotype—Sox9, collagen II, and aggrecan”
As in all tissues, the composition of the matrix is determined by the cells within it. The cells of the NP have a chondrocyte-like appearance, being rounded and enclosed within a lacuna. The cells of the AF on the other hand, especially in the outer AF, have an elongated fibroblastic appearance and are orientated in the same axis as the collagen fibrils.13 Despite presumptions based on their morphology, surprisingly little is known of the phenotype of the cells in either normal or degenerate disc tissue, and ????? To date, most studies have concentrated on the discal matrix, or examined disc cells cultured on various media. Cultured cells taken from rabbit14 and human15 NP show expression of collagen II, and both keratan and chondroitin sulfate (glycosaminoglycans found on aggrecan). There has been only one study investigating matrix molecule expression by human disc cells in situ. In a study of type X collagen, Aigner and colleagues16 demonstrated the expression of the collagen in degenerate cells of the outer AF only; perhaps indicating some conversion to a hypertrophic chondrocyte phenotype.
In our study, by examining the expression of Sox9, collagen II, and aggrecan in human disc NP cells in situ, we investigate the following hypotheses: (1) cells of the NP of the intervertebral disc express a chondrocytic phenotype, whereas those of the annulus fibrosus do not; (2) in degeneration of the intervertebral disc the phenotype of the cells of the NP changes.
Sox9 plays a major role in chondrocyte differentiation and maintenance of the chondrocytic phenotype.17–19 The product of the collagen II (Col2a1) gene is an early and practically unique marker of chondrocyte differentiation, and aggrecan is the characteristic proteoglycan produced by chondrocytes. We report the results of in situ hybridisation (Sox9 and collagen II mRNA) and immunohistochemistry (aggrecan) performed on tissue sections of human intervertebral disc. (In situ hybridisation was used for collagen II and Sox9 because: (a) the structure of collagen II is so highly conserved between species that there are considerable technical difficulties in obtaining reliable antibodies to the gly-X-Y component of the molecule, and (b) there are as yet no antibodies for the product of the human Sox9 gene.)
MATERIALS AND METHODS
Unless stated otherwise, all reagents were supplied by Sigma (Poole, Dorset, UK). Ethical committee approval for our study was granted by the ethics committees of: Salford and Trafford Health Authority (01049 and 01050), Central Manchester Health Authority (C/01/008), and Bury and Rochdale Health Authority (175a and 175b).
Tissue processing and the “degeneration score”
Sixty three intervertebral disc wedges, taken from patients undergoing anterior fusion surgery for back pain, where multilevel surgery afforded the opportunity to obtain normal and degenerate discs, were trimmed to give tissue blocks in which AF and NP were represented in the correct anatomical relation to one another. The blocks were fixed in 10% vol/vol neutral buffered formalin and embedded in paraffin wax. Sections (5 μm thick) were cut and then mounted and baked on 3-aminopropyl-triethoxysilane (APES) coated slides.
The biopsies were scored for their degree of degeneration based on histological appearances. Standard haematoxylin and eosin (H&E) sections were graded out of 12 by two independent observers for signs of degeneration in the NP and AF (fig 1). This scoring system was based on a previously published system20 modified for use in biopsy (rather than cadaveric) material. A score from 0 to 3 was allocated in each of four categories (table 1), and these were added together to give a final score out of 12. On the basis of this scoring system, 27 biopsies of intervertebral discs were selected for investigation, nine in each of three groups. The three groups were: no/minimal degeneration (degeneration score of 0 or 1), moderate degeneration (score 4–6), and severe degeneration (score 9–12). Patients were matched as closely as possible for age and sex—no/minimal degeneration group, M : F = 4 : 5, age = 27–44 (mean, 38.6); moderate degeneration group, M : F = 5 : 4, age = 30–49 (mean, 39.3); and severe degeneration group, M : F = 4 : 5, age = 32–48 (mean, 40.3).
Breakdown of the four groups of parameters used for the scoring system

Histological appearance of non-degenerate (A and B) and degenerate (C and D) intervertebral discs. Note the lack of haematoxyophilia and the presence of slits (C) and chondrocyte clusters (D) in the degenerate intervertebral discs. The distinction between the annulus fibrosus and nucleus pulposus in the non-degenerate intervertebral discs (arrowed) is lost in the degenerate disc. Original magnification: ×1 (A and C) and ×150 (B and D).
In situ hybridisation
The method used has been described in detail previously.21 Briefly, in situ hybridisation was performed using human cDNA probes. The Sox9 probe, specific for the 3` end of the Sox9 molecule, was 600 bp long. It came from A Schafer22(Laboratory of Human Molecular Genetics, University of Cambridge, Cambridge, UK). The collagen II cDNA probe was obtained from M Sandberg23; it was a 550 bp fragment covering approximately 400 bp of the 3` non-translated region of type II procollagen, which has previously been shown not to crossreact with type I or type III procollagen. The probes were random prime labelled to specific activities of approximately 1 x 10⁸ counts per minute/μg with 35S dCTP (ICN, Basingstoke, UK), using the Amersham Megaprime DNA labelling system (Amersham Pharmacia Biotech, Little Chatfield, UK).
Tissue sections (7 μm thick) were dewaxed in xylene and rehydrated in 95% ethanol. The tissue was permeabilised in the following solutions: 0.2M HCl (20 minutes), 2× SSC (standard saline citrate; 0.15M NaCl and 0.015 M sodium citrate; 2 × 3 minutes), 0.05M Tris (pH 7.4; three minutes), 2.5 μg/ml proteinase K in 1M Tris (pH 7.4; one hour at 37°C ), 0.2% glycine in PBS (phosphate buffered saline; pH 7); 2 × 3 minutes), and PBS (2 × 3 minutes). At this point, while test sections were left in 2× SSC, the control sections were treated with 1 mg/ml RNase A in DNase buffer (1 mg/ml; two hours at 37°C). All were then rinsed in PBS (three minutes). Postfixation was carried out in 0.4% wt/vol paraformaldehyde (4°C for 20 minutes), followed by PBS (2 × 5 minutes). Sections were treated to reduce interactions between probe and basic tissue proteins using 0.1M triethanolamine (pH 8; two minutes), 0.25% vol/vol acetic anhydride/triethanolamine (30 minutes), and water (three minutes).
All sections were prehybridised for one hour at 37°C to reduce non-specific probe binding, in a solution consisting of 0.1 g dextran sulfate, 100 μl 10× modified Denhardt's solution, 200 μl 3M NaCl, 20 μl salmon sperm DNA (10 mg/ml), 10 μl 1M Tris (pH 7.4), 1 μl 0.5M EDTA (ethylenediamenetetraacetic acid disodium salt), 10 μl 1M DTT (dithiothreitol), and 500 μl deionised formamide (BDH, Poole, Dorset, UK). Each slide was hybridised overnight at 37°C with 50 μl hybridisation solution, which contained heat denatured 35S labelled probe (100 ng/ml prehybridisation solution), and the same blocking and spacing agents as the prehybridisation solution.
The coverslips were removed with 4× SSC, and the slides rinsed with 0.5× SSC, 1mM EDTA, 10mM DTT (2 × 5 minutes); 0.5× SSC, 1mM EDTA (2 ×5 minutes); and 50% formamide/50% 0.15M NaCl, 5mM Tris (pH 7.4), 0.5mM EDTA (pH 8) (10 minutes). High stringency washes were done with 5× SSC (4 × 5 minutes at 55°C and five minutes at room temperature), before the sections were dehydrated in 95% ethanol and left to dry.
Autoradiography was performed by coating the slides with Ilford K5 emulsion (Ilford Imaging, Knutsford, UK), melted at 40°C and diluted 1/1 with distilled water, and exposed for seven days. They were developed with Ilford Phenisol developer and Hypam fixer, and counterstained with H&E before being dehydrated, cleared, and mounted.
Immunohistochemistry
Tissue sections (5 μm thick) were dewaxed in xylene and rehydrated with 95% ethanol. Endogenous peroxidase activity was blocked with hydrogen peroxide solution (3% vol/vol in IMS for 30 minutes), and antigen retrieval was performed with α-chymotrypsin (0.0001 mg/ml and 0.001 mg/ml CaCl2 in TBS (Tris buffered saline); 20 minutes at 37°C). After rinsing in TBS (3 × 5 minutes), non-specific secondary antibody binding was blocked with rabbit serum (5% in TBS for 30 minutes).
A 100 μl volume of mouse monoclonal anti-aggrecan antibody (HAG7E1; Abcam Ltd, Cambridge, UK), dissolved in a solution of BSA (1% wt/vol bovine serum albumin in TBS) at a 1/25 dilution was applied to each section. Control sections were incubated with mouse immunoglobulin solution at a 1/2.5 dilution. They were left at room temperature for 15 minutes, and then overnight at 4°C. After rinsing with TBS (3 × 5 minutes), 100 μl of biotinylated rabbit antimouse polyclonal secondary antibody (E0413; Sigma) was applied to each section at a 1/400 dilution in BSA for one hour. Sections were again rinsed in TBS (3 × 5 minutes). Immunoreactivity was amplified using an avidin–biotin system and visualised using the peroxidase reaction with DAB (3,3'-diaminobenzidinetetrahydrochloride). The sections were then rinsed, stained with haematoxylin, dehydrated, cleared, and mounted.
Evaluation of results
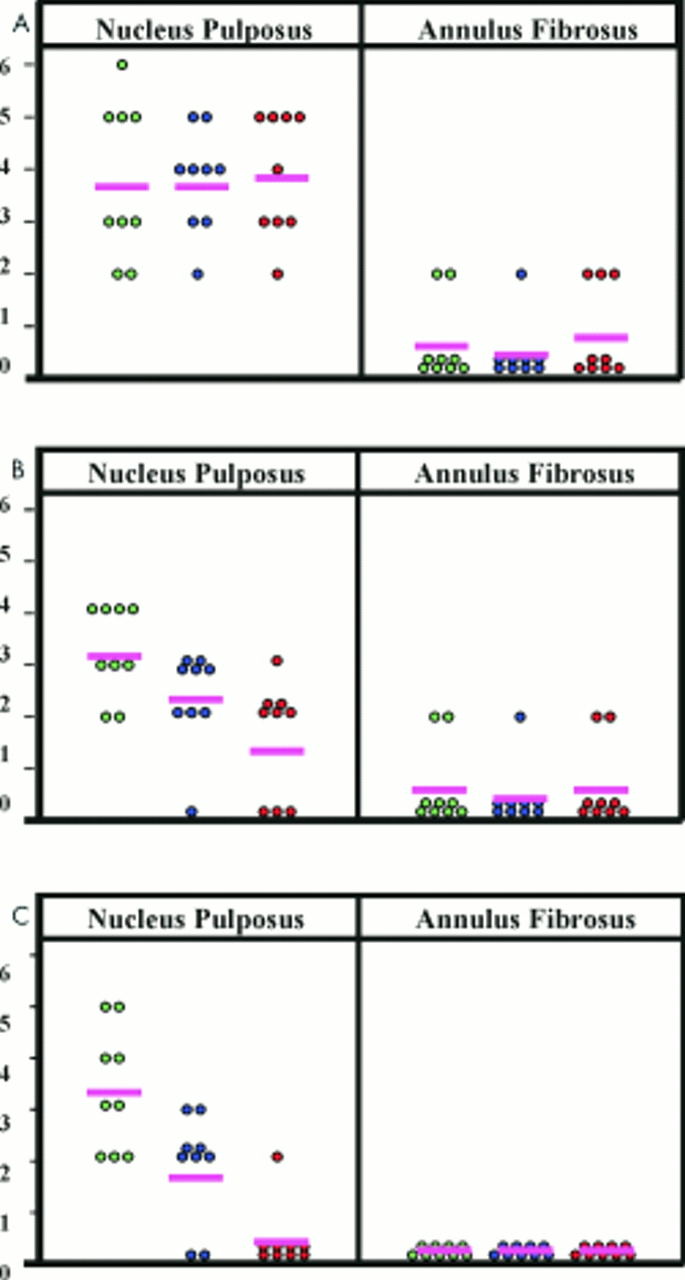
All parameters were semiquantitatively evaluated in terms of two distinct variables: the proportion of cells staining within a given area (0, none; 1, < 25%; 2, 25–75%; 3, > 75%) and the intensity of staining in a given cell over and above background (0, none; +, weak; ++, moderate; +++, strong). The data are presented in tabular form using this system, which allows a distinction to be drawn between the number of reactive cells and the density of the reaction product. The data are also presented graphically using a combined score derived from adding the two components (for example, 2++ = 2 + 2 = 4; fig 2). For each biopsy both NP and AF were assessed in this way, independently, by two of the authors (JIS and AJF); if there was disagreement the specimen was reassessed in consultation. In keeping with the hypotheses being examined, aggrecan staining in the extracellular matrix was not assessed.

Graphical representation of the combined score (proportion of cells staining plus the density of the reaction product for all three molecules); (A) Sox9 mRNA, (B) collagen II mRNA, (C) aggrecan core protein. Light green circles, no or minimal degeneration; blue circles, moderate degeneration; red circles, severe degeneration; pink line, mean.
RESULTS
Sox9
A Sox9 signal was seen over the cells of the normal and degenerate NP, but not over the AF cells (fig 3A–D). In the normal NP, the signal was moderately strong and was seen over most of the cells. In the degenerate NP, there were greater numbers of clustered cells, and fewer lacunae containing individual cells. However, the degree of Sox9 message expression was maintained.

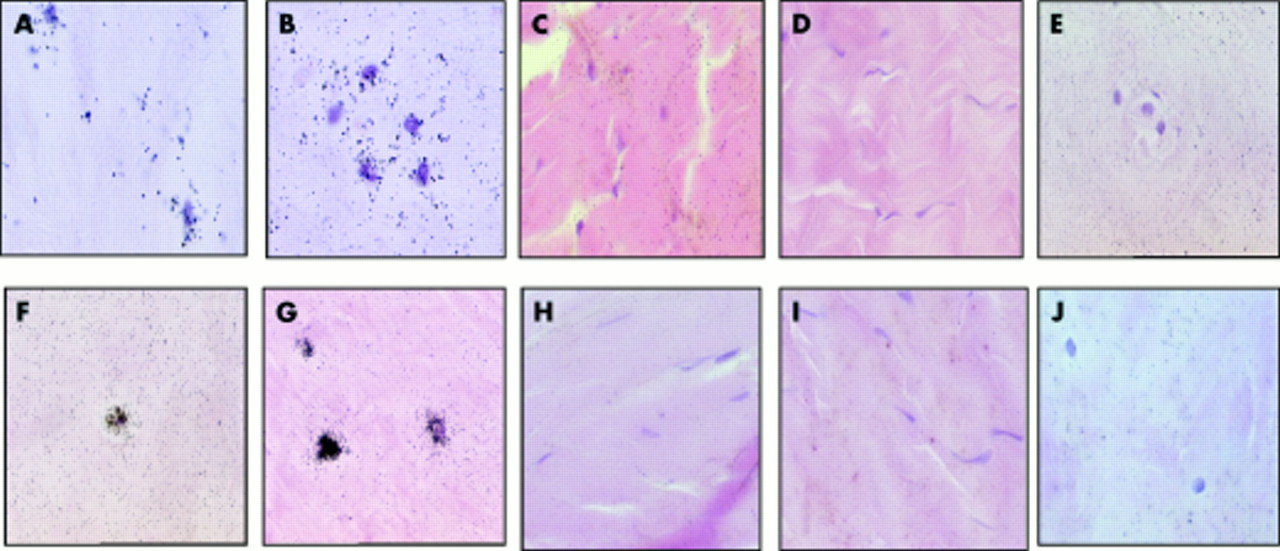
In situ hybridisation; black grains indicate a positive reaction (A, B, F, and G). (A–E) Sox9 mRNA expression: (A) normal nucleus, (B) degenerate nucleus, (C) normal annulus, (D) degenerate annulus, and (E) normal nucleus with RNase pretreatment. (F–J) collagen II mRNA expression: (F) normal nucleus, (G) degenerate nucleus, (H) normal annulus, (I) degenerate annulus, and (J) normal nucleus with RNase pretreatment.
In the AF there was much less signal in both the normal and degenerate discs (table 2; fig 2A). In those biopsies where a signal was recorded, it tended to be in those cells with a more chondrocytic appearance in the inner AF.
Sox9 mRNA expression scores
Background signal over the matrix was negligible in all the discs. RNase treated control sections showed no signal (fig 3E). By combining the scores for the proportion of cells staining and the intensity of staining (fig 2A), the difference between NP and AF cells can be seen more clearly.
Collagen II
A collagen II signal was seen over the cells of the normal and degenerate NP, but not over the AF cells (fig 3F–I). About 50% of cells of the NP in intervertebral discs showing minimal degeneration expressed the gene. In NP cells in moderately and severely degenerate intervertebral discs, those cells in lacunae containing only one cell reacted in a similar manner to cells in the discs showing minimal degeneration. In cell clusters (where each lacuna contained more than one cell) both the proportion of cells staining and the signal intensity was reduced.
In all of the biopsies, the cells of the AF gave either a weak signal or no signal at all (table 3). As with Sox9, where a signal was recorded, it tended to be in those cells with a more chondrocytic appearance in the inner AF, and then only infrequently. The background signal over the matrix was very low and RNase treated controls showed no signal (fig 3J). By combining the scores for the proportion of cells staining and the intensity of staining (fig 2B), the difference between NP and AF cells can be seen more clearly.
Collagen II mRNA expression scores
Aggrecan
Aggrecan staining was seen only in the cells of the normal NP. Cells in the AF were uniformly negative (fig 4A–D; table 4). There was moderate to strong cytoplasmic staining in most (> 75%) of the cells of the NP in normal discs, with the cells of the inner NP showing stronger immunoreactivity than those in the outer NP. In contrast, aggrecan staining in the NP of degenerate discs was absent in almost all of the biopsies. There was no background staining in any of the test sections, and IgG control sections showed no staining (fig 4E). By combining the scores for the proportion of cells staining and the intensity of staining (fig 2C), the difference between normal NP cells and all other cells can be seen more clearly.
Aggrecan immunoreactivity scores

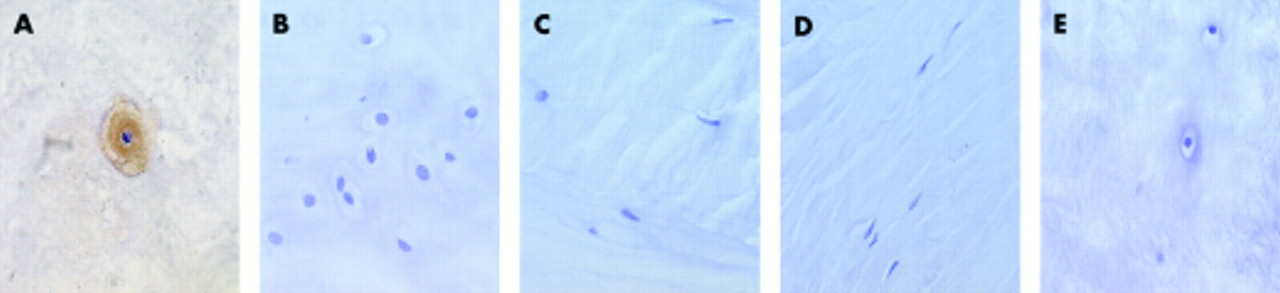
Immunohistochemistry; brown indicates a positive reaction (A). Aggrecan immunoreactivity: (A) normal nucleus, (B) degenerate nucleus, (C) normal annulus, (D) degenerate annulus, and (E) normal nucleus with an IgG control.
DISCUSSION
Previous studies of the human intervertebral disc have tended either to concentrate on the extracellular matrix as a guide to the activity of cells,13,24,25 or to examine cells removed from the disc and cultured on various media,15,26 which is clearly not physiological. Apart from one other report, which looked exclusively at the expression of collagen X,16 we believe that this is the first study to examine, in situ, human intervertebral disc cells for chondrocytic markers. The three molecules (Sox9, collagen II, and aggrecan) were selected because their combined expression distinguishes chondrocytes from all other cells. Sox9 is the major regulator of the chondrocytic phenotype.17 It is a potent promoter of type II collagen gene expression,18 a molecule which is produced almost exclusively in the chondrocyte. The proteoglycan aggrecan is also a characteristic gene product of chondrocytes.27 In broad terms we have shown that within the non-degenerate intervertebral disc the cells of the NP have a chondrocytic phenotype, whereas the cells of the AF do not.
“This is the first in situ evidence of decreased production of aggrecan by cells in the degenerate human intervertebral disc when compared with age matched non-degenerate controls”
We were also interested in studying whether, in degeneration, the phenotype of the cells within the NP changes. In particular, we were interested in whether the expression of the aggrecan gene product decreased with the onset of degeneration. It is recognised that the amount of proteoglycan is reduced within the degenerate intervertebral disc,28,29 and that aggrecanase expression is increased.30 It is equally clear that there are few differences between the aging and degenerate intervertebral disc31 for either parameter. What is not known is whether there are differences in the in situ biosynthesis of aggrecan between the morphologically degenerate intervertebral disc and age matched discs showing no evidence of morphological degeneration. To undertake our study we needed morphological markers of degeneration against which gene expression could be assessed. We chose to use a histological scoring system to define the extent of degeneration. The advantages of this approach are that it permits in situ gene expression to be compared with internally gradable and accepted parameters of degeneration and it makes no assumptions about the changes in cell function or matrix molecules that might underlie degeneration. The major shortcomings are that the system relies on morphological criteria that, although they characterise degeneration, are secondary and relatively late phenomena, and there are no data to support the inherent assumption that degeneration is uniformly progressive. Accepting these limitations, our data show that aggrecan expression by cells in the NP decreases as the degree of degeneration increases. Although decreased synthesis of aggrecan has been shown in a mouse model of intervertebral disc degeneration,32 this is the first in situ evidence of decreased production of aggrecan by cells in the degenerate human intervertebral disc when compared with age matched non-degenerate controls. This is an important observation because it indicates a potential therapeutic target in the management of degenerative disease of the intervertebral disc.
Interestingly there was some suggestion from the data that although Sox9 expression remained high in the NP cells of the degenerate intervertebral disc, collagen II expression, like aggrecan, decreased as the degree of degeneration increased. Although Sox9 function is closely linked with collagen II expression, there is evidence that other regulatory proteins may influence Sox9 action.33,34 In particular, the inflammatory cytokines interleukin 1 and tumour necrosis factor α, which are expressed in the degenerate intervertebral disc,35 may inhibit Sox9 promotion of collagen II expression.36 Previous immunohistochemical investigations have studied collagen II in the matrix of the aging and degenerate human intervertebral disc and have shown no differences in the amount of protein between the aged and age-matched degenerate intervertebral discs.10 However, the techniques used in our study to examine molecule expression are very crude and more sensitive techniques are required to demonstrate whether the imbalance between Sox9 and collagen II expression in the degenerate intervertebral disc is important.
Take home messages
-
Cells of the normal nucleus pulposus showed expression of all three markers—Sox9 and collagen II mRNA, and the aggrecan protein—clearly indicating a chondrocytic phenotype
-
In degeneration, there was evidence of a loss of aggrecan synthesis, which may contribute to the pathogenesis of disc degeneration
-
Annulus fibrosus cells showed no evidence of a chondrocytic phenotype in either normal or degenerate discs
Within the AF, cells did not generally exhibit chondrocyte markers. In intervertebral discs showing minimal or no degeneration, Sox9 and collagen II gene expression was rare and was restricted to the cells of the inner AF (referred to by some authors as the “transition zone”). In this area, the cells have a morphology intermediate between the chondrocytic morphology of the NP and the fibroblastic morphology of the AF. Immunoreactive aggrecan was never seen in the cells of the AF. Although the cells of the AF have a spindle cell morphology more typical of the fibroblast than the chondrocyte, and our data show that they do not exhibit a detectable chondrocytic phenotype, there is substantial evidence that after culture in specific media they can take on both a chondrocytic morphology and phenotype.14,37 Ongoing experiments within our research group are focused on examining the lineage and regulation of the plasticity of the cells within the intervertebral discs.
“Our data suggest that collagen II mRNA production is uncoupled from that of Sox9 in the degenerate disc when compared with age matched controls”
Our study shows that the NP cells of the intervertebral disc express the chondrocytic markers Sox9, collagen II, and aggrecan, indicating a chondrocytic phenotype. In degenerate intervertebral discs, Sox9 expression remains high, collagen II expression is reduced, and aggrecan is absent. This shows, for the first time in situ, that the process of degeneration is associated with profound changes in the cells of the NP affecting the synthetic pathways of matrix molecules. Cells of the AF are not phenotypically chondrocytes.