Article Text

Abstract
Objectives To study whether there is an association between body mass index (BMI) category and survival of various tumour necrosis factor inhibitors (TNFi) in rheumatoid arthritis (RA) patients in a real-life longitudinal international registry.
Methods Data from 5230 patients with RA starting treatment with any TNFi were selected from the METEOR registry. Patients were divided into six BMI categories: 3.7% underweight, BMI<18.5 kg/m2; 46% normal weight, BMI 18.5–25 kg/m2; 32% pre-obesity, BMI 25–30 kg/m2; 13% obesity class I, BMI 30–35 kg/m2; 3.4% obesity class II, BMI 35–40 kg/m2; and 1.6% obesity class III, BMI >40 kg/m2. Time on treatment in the different BMI categories was compared for all TNFi combined and for the infliximab, adalimumab and etanercept separately, using Kaplan–Meier curves and Cox regression analyses. Cox regression analyses were adjusted for potential confounders, with follow-up censored at 5000 days.
Results Patients in obesity class II (HR 1.28, 95% CI 1.06 to 1.54) and III (HR 1.67, 95% CI 1.29 to 2.18) and underweight patients (HR 1.30, 95% CI 1.07 to 1.58) showed statistically significantly shorter TNFi survival than normal weight patients. The effect in underweight patients was strongest for infliximab (HR 1.82, 95% CI 1.20 to 2.76), the effect in overweight patients was strongest for infliximab (category II (HR 1.49, 95% CI 0.98 to 2.26); category III (HR 1.46, 95% CI 0.79 to 2.71)) and etanercept (category II (HR 1.27 95% CI 0.98 to 1.65); category III (HR 1.79, 95% CI 1.25 to 2.55)). No significant effect modification from reported pain was found.
Conclusion Both underweight and overweight patients discontinued TNFi treatment earlier than normal weight patients, without evidence of reported pain as the main determinant. It remains uncertain what determines TNFi survival in individual patients.
- Rheumatoid arthritis
- DMARDs (synthetic)
- Disease activity
- DMARDs (biologic)
- Autoimmune diseases
- Arthritis
This is an open access article distributed in accordance with the Creative Commons Attribution Non Commercial (CC BY-NC 4.0) license, which permits others to distribute, remix, adapt, build upon this work non-commercially, and license their derivative works on different terms, provided the original work is properly cited, appropriate credit is given, any changes made indicated, and the use is non-commercial. See: http://creativecommons.org/licenses/by-nc/4.0/.
Statistics from Altmetric.com
INTRODUCTION
In the past 30 years, the average body mass index (BMI) of adults increased globally, resulting in a worldwide obesity prevalence of 13% in 2016, which is also reflected in an increasing number of obese patients with rheumatoid arthritis (RA).1–3 Since adipose tissue is known to release mediators of inflammation, obese patients may have increased levels of inflammatory cytokines such as tumour necrosis factor α (TNFα), interleukin (IL)-1, IL-6 and MCP-1, which might lead to higher levels of inflammation independently of RA disease activity.4 5 It has been hypothesised that this may lead to a more therapy-resistant state.6 7 Several studies have investigated the association between BMI and disease activity in patients starting TNFα inhibitors (TNFi), not only in patients with RA but also in patients with other inflammatory diseases treated with TNFi, including spondyloarthritis, psoriatic arthritis and inflammatory bowel disease.8–10 Although the majority of these studies found a worse treatment response for patients with higher BMI, results have not been conclusive and some authors have argued that instead of increased inflammatory activity, increased pain levels explain the association between BMI and success of TNFi treatment.11
Furthermore, there is a large heterogeneity between studies.6 7 11–18 Extreme BMI categories (WHO classification criteria19) were rarely included, even though there are indications that response to TNFi may be especially different in patients in the lowest and highest BMI categories.20
Also, follow-up duration in previous studies was usually less than 1 year. It may be hypothesised that response or potential failure to treatment with TNFi may be determined by different mechanisms after longer follow-up (>1 year) than the direct response to treatment. This may result in different associations with BMI, which has not been previously investigated.
Moreover, different studies included different TNFi or assessed all TNFi as one group, whereas a previous study suggested that the association between a high BMI and worse treatment response was stronger for infliximab than for other TNFi in RA.7
Therefore, we aimed to study the association between BMI category and primary and delayed drug survival in patients starting treatment with various TNFi in a real-life longitudinal registry with several years of follow-up.
METHODS
Data selection
Data from patients with a clinical diagnosis of RA were included from the METEOR registry. This is an international, observational registry capturing patient and disease characteristics, disease activity, physical functioning and medication use during daily clinical practice. Patients may be newly diagnosed, but may also have an existing RA diagnosis. Since visits and measurements were scheduled according to clinical practice, the total follow-up time and the frequency of visits differ per patient. Since all data are anonymised and treatment and measurements are non-protocolled, medical ethics approval was not required. A detailed description of the METEOR registry has been previously published.21
For the current analysis, data were selected from adult patients with RA starting their first TNFi who had available data on weight, with at least one visit with an available composite disease activity measure (disease activity score 28 (DAS28), Simplified Disease Activity Index (SDAI), Clinical Disease Activity Index (CDAI) or Routine Assessment of Patient Index Data 3), at least 3 months follow-up and available data on start- and end date of medication. For analyses,TNFi data of the individuals from their first course of the specific drug were selected.
All available follow-up visits were included, but follow-up was censored at 5000 days, because after that timepoint, almost no follow-up data were available. A flow chart of the patient selection process is depicted in figure 1. A comparison of included and non-included patients is described in supplementary file 1.

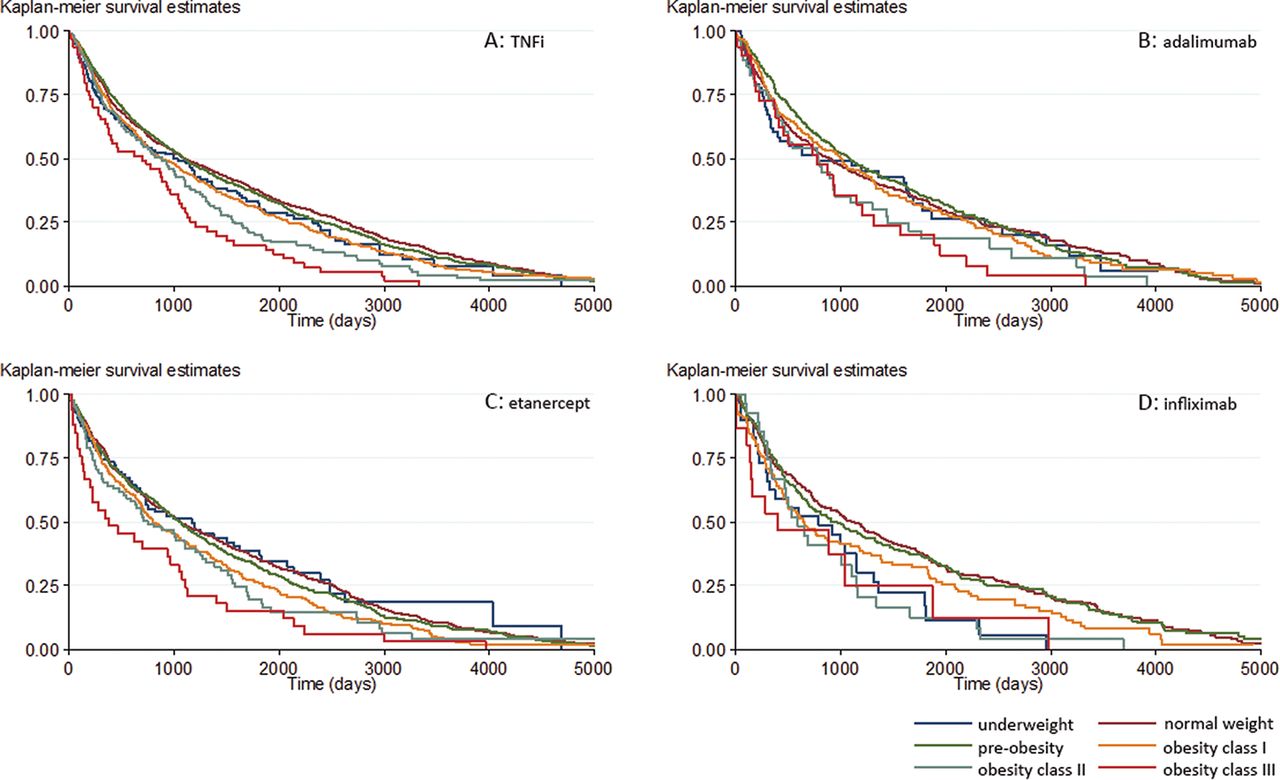
Kaplan–Meier curves for the association between BMI category and drug survival in patients starting TNFi. (A) Data of all patients starting their first TNFi. Data for patients starting adalimumab (B), etanercept (C) and infliximab (D) are shown separately. Kaplan–Meier curves are based on non-imputed and non-adjusted data.
BMI, body mass index; TNFi, tumour necrosis factor inhibitor.
Supplemental material
BMI categories and outcome measures
Patients were divided into six BMI categories according to the international classification for BMI categories defined by the WHO: 1) underweight, BMI <18.5 kg/m2; 2) normal weight, BMI between 18.5 and 24.9 kg/m2; 3) pre-obesity, BMI between 25.0 and 29.9 kg/m2; 4) obesity class I, BMI between 30.0 and 34.9 kg/m2; 5) obesity class II, BMI between 35.0 and 39.9 kg/m2; and 6) obesity class III, BMI >40.0 kg/m2.22
The primary outcome measure was time on first TNFi (as proxy for time to treatment failure), which was defined as the time between the start date and end date of the first prescribed course of TNFi for each patient. Secondary outcome measures were the times on the first prescribed courses of the different types of TNFi: adalimumab, certolizumab, etanercept, golimumab and infliximab. If a second course of the same TNFi was started within 2 months of the first course, this was considered as one consecutive course, and the total time between the start date of the first course and the end date of the second course was calculated.
Statistical analyses
Baseline characteristics were compared between the different BMI categories. Additionally, baseline characteristics were compared between the various TNFi. Kaplan–Meier curves were drawn to compare unadjusted time on treatment for the different BMI categories, for all TNFi combined and for the various TNFi separately.
Missing data were imputed using chained equations (40 imputation cycles) with predictive mean matching (with five observations to draw from) for continuous variables and (multinomial) logit regression for categorical variables. Missing data were imputed for the variables such as BMI, height, age, symptom duration, DAS28, baseline DAS28, SDAI, CDAI, Health Assessment Questionnaire, erythrocyte sedimentation rate (ESR), C reactive protein, visual analogue scale (VAS) patient and physician global, 28 tender and swollen joint count, gender, rheumatoid factor, anti-citrullinated protein antibodies and smoking, based on complete information on weight, treatment, country, follow-up duration, the total number of prescribed biologicals per patient and date of the first TNFi prescription. Continuous variables that did not follow a Gaussian distribution were transformed by taking the square root.
Subsequently, as primary analysis Cox proportional hazards regression analyses were performed in the imputed database to investigate the association between BMI category and time on treatment, for time on first TNFi and for time on the first course of the different TNFi separately. As primary failure (direct non-response) of a TNFi may occur through different mechanisms than delayed failure (later loss of response), we performed secondary analyses, in which we repeated the same analyses with follow-up time limited to 1 year. All Cox regression analyses were adjusted for the potential confounders such as age, gender, smoking (yes, no, quit smoking, defined at entry in the registry), baseline DAS28 and concomitant glucocorticoid use. All potential confounders were selected based on current literature and expert knowledge.11 12 16 18 Additionally, it was tested whether adjusting for country of residence influenced the results. However, as this did not influence any of the outcomes, these results are not presented.
In addition, since patients with a high BMI are described to report more pain, it was assessed whether the association between BMI and time on treatment was similar for patients with similar levels of pain at baseline.11 23–26 For this, potential effect modification by pain category (VAS pain between 0 and 25, 25 and 50, 50 and 75, and 75 and 100) was tested by adding an interaction term between BMI category and pain category. Lastly, we performed linear regression analyses to investigate the association between BMI category and DAS at the final available visit before stopping the TNFi, to investigate whether the decision to stop treatment was made at different disease activity levels. All analyses were performed using Stata SE version 14 (StataCorp LP) and p values <0.05 were considered statistically significant.
Patient and public involvement
Patient and public were not involved in design, conduct, reporting or dissemination of the research.
RESULTS
Patient characteristics
From the 9423 patients in the METEOR registry who were eligible for inclusion in the current study, 5230 patients who had started treatment with a first TNFi had sufficient data to be included in the analyses. A flow chart of the patient selection process and baseline characteristics of included and non-included patients is available in supplementary file 1. Most baseline characteristics were similar between the included and non-included patients. Only the percentage of never smokers was higher in the included patients, and the country of inclusion differed for the included and non-included patients.
Supplemental material
Baseline characteristics of patients starting their first TNFi per BMI category are presented in table 1. Most patients had a normal weight (46%) or had pre-obesity (32%). Four per cent of patients were underweight and 18% of patients belonged to one of the three obesity categories. All patients were bionaïve at the start of their first TNFi.
Baseline characteristics of patients starting their first TNFi per BMI category
Patients in the underweight category were more often female and were younger. The percentage of current smokers decreased with increasing BMI category. Disease activity as measured by DAS28 was lowest in underweight patients and highest in obesity class III patients. This was mainly caused by differences in ESR and in VAS scores for patient global health.
For the analyses regarding the first course of each TNFi separately, data were available from 2069 patients starting adalimumab, 263 patients starting certolizumab, 2936 patients starting etanercept, 84 patients starting golimumab and 1390 patients starting infliximab (table 2). Ninety-one per cent of the patients starting infliximab were bionaïve, compared with 76% of the patients starting etanercept and 78% of the patients starting adalimumab. Patients starting golimumab more often had obesity and patients starting certolizumab were more often underweight. Moreover, patients starting golimumab were more often male patients from the USA or the Netherlands and they were less often current smokers, with shorter symptom duration and slightly lower disease activity. Other patient characteristics were similar between the different TNFi.
Baseline characteristics per TNFi
BMI category and treatment failure during the total follow-up
The Kaplan–Meier curve in figure 1 shows the crude association between the different BMI categories and overall drug survival in patients starting their first TNFi. Over the total follow-up duration of a maximum of 5000 days (approximately 13.5 years), 72% of patients stopped their TNFi. Of these, a limited number of patients had a short treatment stop of <2 months: n=8 for etanercept and infliximab, n=1 for adalimumab and certolizumab, and n=0 for golimumab. Patients in the normal weight and pre-obesity categories had the longest drug survival and patients in obesity class II and III the shortest drug survival. Especially patients in obesity class III had shorter drug survival than patients from the other BMI categories. Reasons for treatment failure were unavailable, but the mean (SD) DAS28 at the final visit before stopping treatment was 3.9 (1.6), supporting the assumption that most patients stop treatment because of ineffectiveness.
Results from fully adjusted Cox regression analyses based on the imputed data set support these findings, with statistically significantly shorter drug survival for patients in obesity class III (HR 1.67, 95% CI 1.29 to 2.18) and obesity class II (HR 1.28, 95% CI 1.06 to 1.54), but also for patients in the underweight category (HR 1.3, 95% CI 1.07 to 1.58), compared with patients in the normal weight category (table 3). We observed no statistically significant effect modification by baseline pain category (p=0.725), indicating that the association between BMI and drug survival was similar in patients reporting different levels of pain. However, we did observe that the last measured DAS28 before stopping treatment was higher for patients in higher BMI categories (table 5). After adjustment, this association remained significant for obesity category II (p=0.025) and obesity category III (p=0.032), indicating that for patients in the highest BMI categories, the decision to stop treatment was made at higher disease activity levels.
Results of the Cox regression analyses to assess the association between BMI category and drug survival per TNFi
Results of the Cox regression analyses to assess the association between BMI category and drug survival per TNFi within 1 year of follow-up
Results of the linear regression analyses to assess the association between BMI category and DAS28 at the final visit before stopping TNFi
Analyses for the individual bDMARDs were only performed for adalimumab, etanercept and infliximab, because the number of patients per BMI category were too small for certolizumab and golimumab. In figure 2, the Kaplan–Meier curves are presented for the crude association between the different BMI categories and drug survival in patients starting adalimumab, etanercept and infliximab. Seventy per cent of patients on adalimumab stopped their treatment during 5000 days of follow-up, and 74% of patients on etanercept and infliximab stopped their treatment. For all three drugs, obese patients had shorter drug survival, although we observed slight differences between the different TNFi. For adalimumab, patients from obesity class II and III showed shorter drug survival. For etanercept, patients from all three obesity classes showed shorter drug survival, with shortest drug survival for patients from obesity class III. For infliximab, patients with a normal weight or pre-obesity had longest drug survival, and patients from obesity class II and III and also underweight patients had shortest drug survival. However, it must be noted that in the obesity class III category, the number of patients on infliximab was limited (n=15 in the non-imputed database).

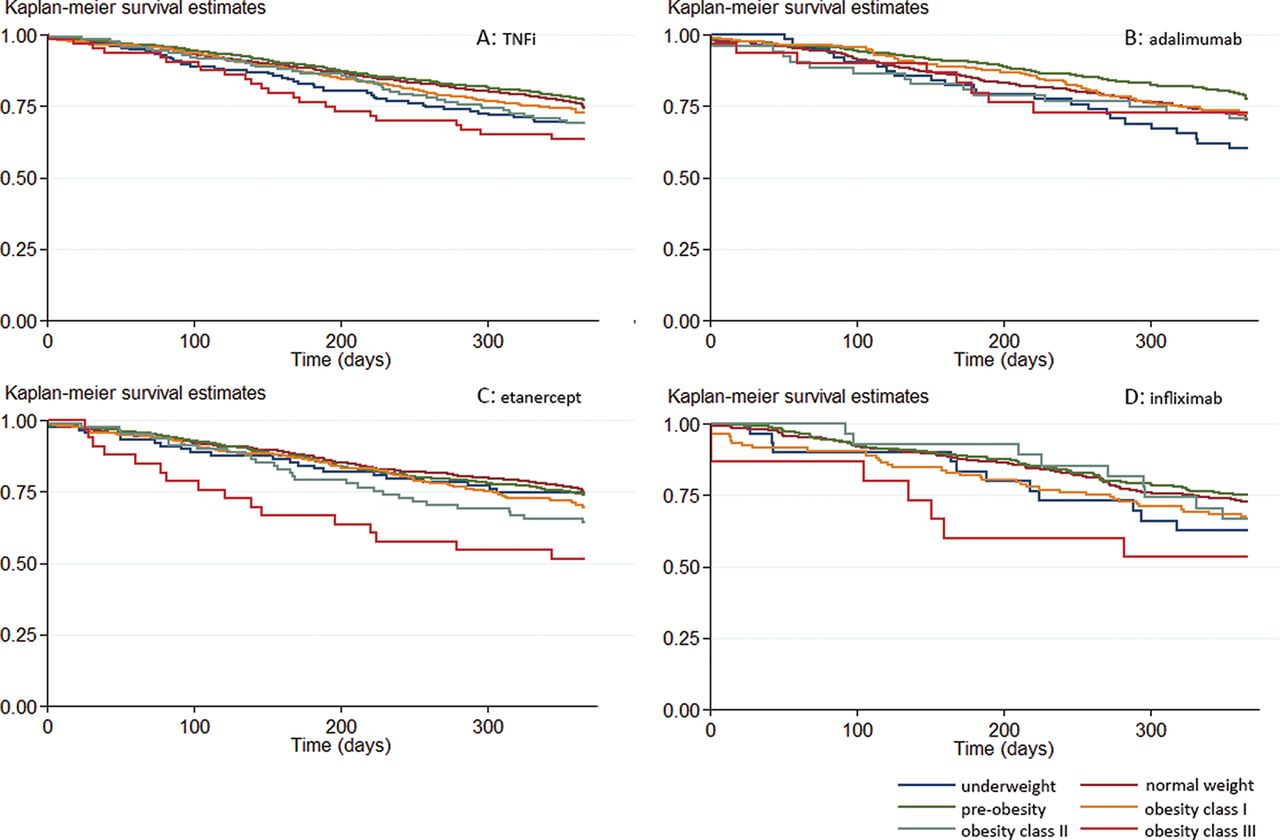
Kaplan–Meier curves for the association between BMI category and drug survival in patients starting TNFi during the first year of follow-up. (A) Data of all patients starting their first TNFi. Data for patients starting adalimumab (B), etanercept (C) and infliximab (D) are shown separately. Kaplan–Meier curves are based on non-imputed and non-adjusted data.
BMI, body mass index; TNFi, tumour necrosis factor inhibitor.
Numerically, these results were supported by the outcomes of the adjusted Cox regression analyses based on the imputed database, although not all of these aforementioned effects reached statistical significance (table 3). With normal weight patients as the reference category, we observed a statistically significantly longer drug survival for patients in the pre-obesity category starting adalimumab (HR 0.86, 95% CI 0.75 to 0.99). For etanercept, we observed a statistically significantly shorter drug survival for patients in obesity class II (HR 1.27, 95% CI 0.98 to 1.65) and obesity class III (HR 1.79, 95% CI 1.25 to 2.55). For infliximab, we observed a statistically significantly shorter response for patients from the underweight (HR 1.82, 95% CI 1.20 to 2.76) and obesity class II categories (HR 1.49, 95% CI 0.98 to 2.26).
For none of these drugs, statistically significant effect modification by pain category was observed (adalimumab p=0.849, etanercept p=0.984, infliximab p=0.598), indicating that the differences in the association between BMI category and drug survival for patients with different reported pain levels were not dependent on those reported pain levels.
BMI category and treatment failure during the first year of follow-up
Next, we limited our analysis to the first year of follow-up, to investigate the association between BMI category and primary treatment failure. Overall, the Kaplan–Meier curve in figure 2, with follow-up duration limited to 1 year, shows similar results as in figure 1, with shortest drug survival duration for patients from obesity class III. However, there is also a shorter drug survival for underweight patients. For etanercept and infliximab, also mainly a shorter drug survival for patients in obesity class III was observed. For adalimumab during the first year of follow-up, no major differences between the different weight categories were seen.
After adjustment for potential confounders in the Cox regression analyses (table 4), we found statistically significant differences in drug survival (for all TNFi combined) in the underweight patients (shorter drug survival (HR 1.37, 95% CI 1.01 to 1.86) compared with normal weight patients) and in patients with pre-obesity (longer drug survival (HR 0.85, 95% CI 0.74 to 0.99). For etanercept, patients from obesity class II and III had statistically significantly shorter drug survival (obesity class II (HR 1.64, 95% CI 1.11 to 2.42) and obesity class III (HR 2.23, 95% CI 1.33 to 3.76)). For adalimumab, underweight patients had statistically significantly shorter drug survival (HR 1.58, 95% CI 1.03 to 2.42) and patients with pre-obesity had statistically significantly longer drug survival (HR 0.67, 95% CI 0.53 to 0.85). For infliximab, we did not observe any statistically significant difference, possibly due to relatively limited patient numbers.
DISCUSSION
In this large real-life observational registry with long-term follow-up, we found that patients with RA who were underweight and in obesity class II (BMI between 35 and 40 kg/m2) and III (BMI>40 kg/m2) had shorter drug survival on TNFi, with the strongest effect for patients from obesity class III. This association was not related to levels of reported pain, as has been previously suggested.11 Furthermore, this is the first study investigating drug survival for different TNFi separately. We investigated adalimumab, etanercept and infliximab individually and observed that underweight patients mainly had a worse response to infliximab, whereas the relationship between obesity classes and drug survival seemed less strong for adalimumab than for etanercept and infliximab.
Primary failure or delayed failure after initial good response may occur through different mechanisms and we therefore also investigated the association between BMI category and treatment failure during the first year after TNFi initiation. Overall, we found similar results, with shortest TNFi survival in obesity class III, but not for adalimumab, and for underweight patients, but not for etanercept. In general, BMI appears to be associated with (chance of) clinical response (levels) in RA.8 9 Whether there is an association between response to treatment with specifically TNFi and BMI, and if so, through what mechanism, has been the subject of several studies in RA, as well as in other areas of TNFi use.12 18 20 27 Most of these previous studies in RA have chosen composite disease activity measures such as the DAS28 as outcome variable. However, interpretation of composite disease activity measures may be challenging in patients with obesity. The examination of joint swelling may be more difficult, and ESR and reported pain levels are expected to be higher.23 24 28 29 To combine disease activity measurements with ‘soft’ outcomes that steer treatment decisions, we have chosen to study treatment survival to investigate whether differences in BMI were indeed associated with stopping treatment more often.
One previous smaller study has also reported that drug survival was shorter in obese patients with RA starting TNFi, although differences between the three defined BMI categories were not statistically significant.12 In contrast, another large observational study concluded that obesity was not associated with treatment discontinuation in patients with RA starting TNFi.18 However, in that study, results were adjusted for several comorbidities, such as diabetes and hypertension. As it may be argued that these factors exert their effect on drug survival to a large extent through the causal pathway between BMI and drug survival, considering these factors as potential confounders is incorrect and would obscure an association between BMI and drug survival. Neither study stratified for the various TNFi types.
We looked at drug survival as proxy for (duration of) clinical response, but drug survival may also be determined by costs, clinical remission (less likely a reason in year 1 after treatment start), occurrence of side effects or comorbidities (including pain-related comorbidities), some of which may also increase the DAS, or otherwise by wish of the patient. In the current study, we could not stratify between the different reasons for stopping the treatment. However, as the DAS28 at the final visit before stopping the treatment was high, it is likely that drug survival was mainly determined by treatment failure.
It has been hypothesised that the association between BMI and treatment response is a result of inflammatory pathways that are active in excess adipose tissue.4–7 Also, a relation between higher bodyweight and accelerated clearance of monoclonal antibodies such as TNFi has been suggested, although the mechanism remains uncertain, and possibly vary per drug.8 30
Alternatively, it has been suggested that RA patients in higher BMI categories report more pain and are more often diagnosed with chronic pain syndrome and osteoarthritis, which may increase disease activity measures and may therefore influence treatment response.11 23–26 31 In the current study, we assessed whether the association between BMI category and drug survival was different for patients indicating different baseline levels of pain, but we observed similar effects in all pain categories. Therefore, it seems unlikely that differences in pain can explain the association between BMI and treatment response. We did observe that disease activity measured with DAS28 before stopping the TNFi was higher with increasing BMI category, suggesting that besides the DAS28, additional reasons influence shared decision-making processes between rheumatologist and patient that ultimately determine TNFi survival.
None of the previously published studies into the relationship between BMI and treatment outcomes in RA used the BMI categories as defined by the WHO, and patients with RA being underweight are rarely studied. Low bodyweight is increasingly rare and possibly in relation to a focus on effects of obesity, underweight patients are often grouped with normal weight patients in the comparator group.1 9 Our data show that underweight patients are a neglected group that may require customised treatment and may also help to shed light on the relation between bodyweight and treatment outcomes, because the strongest effects are observed in the underweight and the more extreme obesity categories. This is in accordance with a previous study in patients with Crohn’s disease starting infliximab therapy, which also found worse disease outcomes at the underweight and the most extreme obese categories.10
A limited number of Asian patients were included in the current study. It has been previously suggested that the cut-off points for BMI categories should be adjusted for Asian populations, since health risks in these populations may occur at a lower BMI than in other populations. We have followed the current advice of the WHO and used the international classification for BMI categories for all included patients.19 To what extent BMI correctly reflected differences in fat mass and lean body mass in all patients cannot be determined based on our data.
We observed slight differences between the various TNFi with a stronger association between BMI and drug survival in patients with RA starting infliximab, as was previously observed, but also in patients starting etanercept compared with patients starting adalimumab.7 Underweight patients mainly had a shorter drug survival on infliximab, and during the first year of follow-up also on adalimumab. This does not seem to be related to the mode of administration, as infliximab is given intravenously in a weight-based dose and both etanercept and adalimumab are administered subcutaneously in a fixed dose. Several studies in other rheumatic diseases also studied the association between BMI and treatment response in different TNFi, but results were inconsistent and even opposite between studies and underweight patients were not previously studied.7 32–37 The reason for this difference between different TNFi is yet unclear and requires further study.
As our data are daily practice based, our results may be affected by bias, including bias in treatment decision-making and bias due to missing data. We performed multiple imputation in an attempt to prevent bias due to missing data and we have adjusted our analyses for several potential confounders to reduce the risk of confounding by indication, but a risk of residual bias should always be considered. Despite performing separate analyses for three different TNFi, we did not perform an adjustment for multiple testing and therefore it is possible that some of the observed effects are statistically significant by chance. However, if we would have performed a Bonferroni correction and would have used a p value of 0.017 (=0.05/3), most effects would still be significant and only the observed longer drug survival for pre-obesity patients on adalimumab would not be significant anymore.
Another factor that could influence TNFi survival is the number of previous bDMARDs used. For our first analysis in which we assessed all TNFi combined, all patients were bionaïve. For analyses on the infliximab, etanercept and adalimumab separately, up to 24% of patients had used a previous bDMARD. However, we did not aim to compare retention of the different bDMARDs, but we rather aimed to compare the association between BMI categories and drug survival for the different TNFi. As we did not observe an association between BMI and the number of previous bDMARDs, the number of previous bDMARDs was not considered a potential confounder.
Overall, we included a large number of patients. However, for the analyses of the different TNFi, patient numbers were smaller for the lowest and highest BMI categories. Therefore, the power to detect differences between the groups may has been limited, especially for infliximab. Especially for longer follow-up, this may have introduced a risk of overfitting. To limit this risk, we have censored follow-up at 5000 days.
In conclusion, we found shorter treatment survival for underweight patients with RA having a BMI <18.5 kg/m2 and for obese patients with RA having a BMI >30 kg/m2 who started treatment with TNFi in a large international registry based on real-life data. This effect seemed strongest for patients from obesity class III (BMI>40 kg/m2), who showed shorter treatment survival already early during follow-up. When independently assessing these effects for infliximab, adalimumab and etanercept, the effect in underweight patients was mainly observed for infliximab and during the first year of follow-up also for adalimumab, whereas the effect in obese patients was mainly observed for infliximab and etanercept. What determines these associations remains unclear, and whether interventions to stimulate weight loss for instance could lead to a better treatment response to TNFi in obese patients, as has been previously shown in psoriatic arthritis patients, remains to be elucidated.38
Key messages
What is already known about this subject
Obese patients may have increased levels of inflammatory cytokines. It has been hypothesised that this may lead to a more therapy-resistant state, resulting in a lower response rate to TNFi for patients with rheumatoid arthritis (RA) having a high BMI.
What does this study add
In a real-life observational registry with long-term follow-up, we found shorter treatment survival on TNFi for patients with RA who were both underweight and obese (BMI>30 kg/m2). This effect seemed strongest for patients from obesity class III (BMI>40 kg/m2), who showed shorter treatment survival already early during follow-up. This association was not related to levels of reported pain, as has been previously suggested. Furthermore, this is the first study investigating drug survival for different TNFi separately. We observed that underweight patients mainly had a worse response to infliximab, whereas the relationship between obesity and drug survival seemed less strong for adalimumab than for etanercept and infliximab.
How might this impact on clinical practice
Our data show that in clinical practice, differences in treatment survival may be expected for patients with different BMI levels on different TNFi. Moreover, underweight patients seem to be a neglected group in research that may require customised treatment. Whether interventions to stimulate weight loss for instance could lead to a better treatment response in obese patients remains to be elucidated.
REFERENCES
Footnotes
Contributors SAB and CFA involved in the concept and design of the study, analysis and interpretation of data, and drafting the manuscript. CFA, DVM, MB, EM, KSE and TWJH involved in the acquisition of data. CFA, DVM, MB, EM, KSE and TWJH revised the manuscript critically. All authors read and approved the final manuscript.
Funding This work was supported by a research grant from Bristol-Myers Squibb.
Competing interests Dr Vega-Morales is a speaker for Roche and Bristol-Myers Squibb. The other authors reported no conflicts of interest.
Patient consent for publication Not required.
Ethics approval All data were fully anonymised, and treatment and measurements were performed without any change to daily practice. Therefore, medical ethics approval or consent to participate were not required.
Data sharing statement Data are available upon reasonable request.
Provenance and peer review Not commissioned; externally peer reviewed.
Data availability statement The data sets used and/or analysed during the current study are available from the corresponding author on reasonable request.