Article Text

Abstract
Abstract In 2003, the Nobel Prize for Medicine was awarded for contribution to the invention of MRI, reflecting the incredible value of MRI for medicine. Since 2003, enormous technical advancements have been made in acquiring MR images. However, MRI has a complicated, accident-prone dark side; images are not calibrated and respective images are dependent on all kinds of subjective choices in the settings of the machine, acquisition technique parameters, reconstruction techniques, data transmission, filtering and postprocessing techniques. The bright side is that understanding MR techniques increases opportunities to unravel characteristics of tissue. In this viewpoint, we summarise the different subjective choices that can be made to generate MR images and stress the importance of communication between radiologists and rheumatologists to correctly interpret images.
- magnetic resonance imaging
- rheumatoid arthritis
- spondyloarthritis
This is an Open access article distributed in accordance with the Creative Commons Attribution Non Commercial (CC BY-NC 4.0) license, which permits others to distribute, remix, adapt, build upon this work non-commercially, and license their derivative works on different terms, provided the original work is properly cited, appropriate credit is given, any changes made indicated, and the use is non-commercial. See: http://creativecommons.org/licenses/by-nc/4.0/.
Statistics from Altmetric.com
Advanced imaging modalities are increasingly used because of its capacity to measure inflammation more sensitive than physical examination and structural damage more sensitive than radiographs. MRI has important advantages; in terms of imaging, it is the only modality depicting bone marrow oedema (BME). Scientific methodological advantages of MRI are the presence of validated scan and scoring protocols, the little operator dependency and the possibility that scans can be scored by different (blinded) observers.
The use of MRI in rheumatology
MRI is increasingly used, for instance, in patients with (suspected) spondyloarthitis (SpA) or rheumatoid arthritis (RA). It is role is most prominent in SpA, where MRI-detected sacroiliitis is part of the Assessmentin Spondyloarthritis International Society classification criteria.1 2 Sacroiliitis is earlier detectable with MRI than with radiographs, and therefore, the performance of MRI contributes to earlier classification of patients. Although classification criteria are not developed as an aid in the diagnostic process and the value of MRI is demonstrated in light of classification criteria, its use has expanded to regular care. MRI also has a role in scientific studies in RA. MR images are frequently used as outcome measure in clinical trials now that clinically relevant radiographic joint damage has become infrequent. The use of MRI-detected synovitis to assess the extent of joint inflammation is incorporated in the 2010 EuropeanLeague Against Rheumatism/AmericanCollege of Rheumatology classification criteria for RA.3 Although there are no evidence-based guidelines for the use of MRI in the diagnostic process of RA, there is increasing evidence that MRI is valuable in the prognostication of patients withClinically Suspect Arthralgia.4 Thus rheumatologists will see more and more MR images and tend to consider an MR image and MR protocols as stable as a conventional X-ray. However, this assumption is incorrect.
Focus of this viewpoint
Creating an MR image is a complicated process that depends on tissue characteristics of the patient including flow and motion, MR machine parameters and environmental factors. Some basic knowledge on these concepts will be discussed as this is required to stay on the bright side of MRI, using its potential to its fullest, and avoiding the dark side with flaws in interpretation of images.
Our objective is to provide some practical MRI concepts that are useful in daily clinical practice. We will demonstrate that the concept of T1-weighting and T2-weighting is useful but too simplified. Some basic knowledge on the many mechanisms that have an impact on image appearance has to be added to this T1 and T2 concept to avoid major pitfalls.
Other elements, namely tissue characteristics and environmental issues that are addressed at installation (like absence of distortion of the magnetic field by nearby elevators or trains, absence of radiofrequency contamination and absence of motion of the MR system), are beyond the scope of this viewpoint.
What is needed for an MR image?
An MR system is placed in a room shielded from external magnetic fields and radiofrequency contamination and consists of a wire system to conduct electricity creating the magnetic field. In the typically used superconducting MR systems, this wire system is placed in a container filled with liquid He at a temperature of −269°C, to produce superconductivity of the wire and thus a permanent magnetic field. A gradient system consisting of gradient coils allows spatial encoding by controlled variation of the magnetic field. Rapid switching of these coils is responsible for the mechanical noise during the MR exam. Radiofrequency coils emit (and receive) radiofrequency waves that are used to create images by changing the energy status of nuclei of H atoms. The coils collect signal from the patient. Because this signal, and therefore image quality, is much better if the coil is small and close to the tissue imaged, special dedicated coils are used for specific anatomical parts like hands and feet. Magnetic field strength (expressed in Tesla), homogeneity of the field, amplitude and speed of the gradient system, quality and type of coil, and method of data transmission and handling are hardware specifications that determine the quality of an MR system. In the clinical setting, MR machines, ranging between as low as 0.2–0.6 T to 3 T, are used. In addition to whole-body systems, dedicated extremity scanners exist which have specific advantages (low cost) and disadvantages (low field, small field of view not allowing imaging of a hand in one acquisition, long scan times).
What is done to create an MR image?
The chain of events leading to an MR image consists of aligning the magnetic property of protons in tissue imaged parallel to a homogeneous magnetic field, applying radiofrequency pulses to alter the status of these protons, encoding the space in the three coordinates X, Y, Z by applying gradients to create local differences in magnetic field, sampling radiofrequency signal emitted by the protons after termination of applying the radiofrequency waves, transferring these data to a domain called K-space and performing a mathematical reconstruction to create an image. The image is a digital image consisting of voxels (volume elements) each with a number that are displayed in two-dimensional pixels (picture elements) with a level of grey. The size of these voxels and pixels determines sharpness and noise in the image. It is essential to realise that these numbers are relative and not absolute values. This is different from the numbers used to create a CT image because these are calibrated so that water is 0 Hounsfield units.
The signal intensity on an MR image is governed by many factors including MR hardware, tissue characteristics (such as T1 and T2 relaxation times, proton density, flow and motion), type of pulse sequence, method of K-space filling, reconstruction algorithm and display of grey scale. We will now show a few examples of common misconceptions in these categories that may cause mistakes in image interpretation.
Influence of pulse sequences; proton density, T1-weighted and T2-weighted contrast
After the patient’s protons are aligned in the main magnetic field by placing the patient in the magnet, a so-called pulse sequence is applied to cause these protons to emit radiofrequency waves on returning to their baseline status from before the pulse sequence was administered. The well-known T1 and T2 relaxation times describe this process and are tissue-specific parameters. The type of pulse sequence and its particular parameters govern the expression of the tissue parameters in the MR image. Therefore, the terms T1-weighted and T2-weighted images are frequently used. In addition to tissue, the T1 and T2 relaxation times also depend on magnetic field strength. This means that images obtained with identical pulse sequences at different field strengths will exhibit different features.
Typically structures with fat have high signal intensity (ie, are white) on T1-weighted images and exhibit a relatively low signal intensity on T2-weighted images (ie, are dark). Tissue with a relatively large fraction of water (inflammatory tissue, BME, synovial fluid) will mirror this and typically display a low-signal intensity on T1-weighted images and a high-signal intensity on T2-weighted images. There are however many exceptions to this rule of thumb. One of these is related to protons. If protons are fixed (cortical bone), or are fixed in molecules that are too big to resonate (cholesterol in xantoma’s), the signal intensity will be extremely low (black) on all pulse sequences. Flow within vessels is second parameter to take into consideration; it will be dependent on velocity, turbulence, direction of flow and details of the pulse sequence be bright or dark independent of T1 and T2 weighting. A third parameter is the type of pulse sequence. Currently, fast spin echo (FSE), also called turbo spin echo, is the main type allowing high-resolution time-efficient scanning. Because fat has a high-signal intensity similar to fluid on fluid-sensitive FSE (figure 1), fat suppression (FS) techniques are normally used. Gradient echo (GE) sequences are faster, but have the disadvantage of image distortion due to sensitivity to field inhomogeneity and limited image contrast. To express this sensitivity to field inhomogeneity and the ensuing impact on the images, fluid-sensitive GE sequences are mentioned to express T2* contrast, rather than T2 contrast.

Without fat suppression techniques, fat and fluid both have a high-signal intensity on fluid-sensitive fast spin echo. This adult patient with a history of spinal surgery and radiotherapy complained of pain after a fall. On the sagittal T1-weighted FSE image (A) material containing fluid has a dark signal intensity. This can be appreciated in the cerebral spinal fluid and in the compression fracture of the third lumbar vertebral body. Fat in the yellow bone marrow in the spine has a high signal intensity. On the T2-weigted FSE image obtained without adding fat suppression (B), both fat and fluid have a high signal intensity as seen in the cerebral spinal fluid and the edematous part of the fracture (arrow). Contrast between fat and fluid has disappeared.
In practice, the MR protocol for RA imaging includes a minimum of two orientations of the scanned area (eg, an axial and coronal view) and should have a combination of T1-weighted, and fluid-sensitive FSE sequences with FS, as well as post-contrast T1-weighted with FS sequences.5 6 In the rheumatology research setting, MR protocols can be adapted to shorten scan time.7–10
Fluid-sensitive and FS techniques
FS techniques are normally used in combination with T2-weighted FSE imaging (because fluid is relatively bright and difficult to differentiate from bright fat) (figure 1) and with contrast-enhanced imaging. There are many techniques to achieve this, and between vendors these techniques vary. We will discuss clinically relevant differences between the most commonly used techniques; Short-TI Inversion Recovery (STIR), frequency selective FS and Dixon.
A STIR sequence is a fluid-sensitive sequence that is reconstructed in such a way that it looks similar to, but is definitely not a T2-weighted image. T1 relaxation time is one of the major parameters that determine contrast in this image type. T1 and T2 effects are additive in STIR sequences. Depending on reconstruction algorithm, fluid may be displayed as bright (usual method) or dark signal. Because FS is non-selective (as opposed to the other two techniques), enhancing tissue may be dark instead of bright and signal to noise ratio (SNR) drops by 40%. It should only be used if the other techniques cannot be used because of machine limitations or when magnetic field is inhomogeneous.
The advantage of frequency selective FS is that it only suppresses signal of fat, which results in high SNR, but it requires a homogeneous field and it cannot be used below 1 T field strength because the difference of precession frequency between water and fat protons is less at lower field strength.
Dixon techniques have been modified recently and now allow high-resolution high-contrast water and/or fat images in a very time-efficient way.11 After one short acquisition of approximately 2 min, many types of images with different contrast, including water only and water and fat combined, can be reconstructed without time penalty (figure 2). Dixon techniques are less susceptible to artefacts caused by field inhomogeneity and have less problems than frequency fat suppressed sequences at mid and low field. Because of its versatility independent of field strength, these novel Dixon techniques have the important potential to decrease technical differences between various MR systems.

Three different reconstructions after one single mDixon sequence of <2 min. The patient has a myopericytoma anterior to the tibia. Tumors normally have signal intensities similar to bone marrow edema. On the in phase reconstruction (A) signal intensity of fat in bone marrow is high, that of the tumor is intermediate. On the fat only reconstruction (B) signal intensity of fat is again high, but that of tumor is very low. On the water only reconstruction (C) signal intensity of fat is low, and that of tumor is very high.
Rheumatology scoring methods designed and used by rheumatologists are rigidly connected to certain MR sequence protocols12 ; however, incorporation of Dixon techniques to these sequence protocols can increase reproducibility between institutions.13
Use of contrast agents
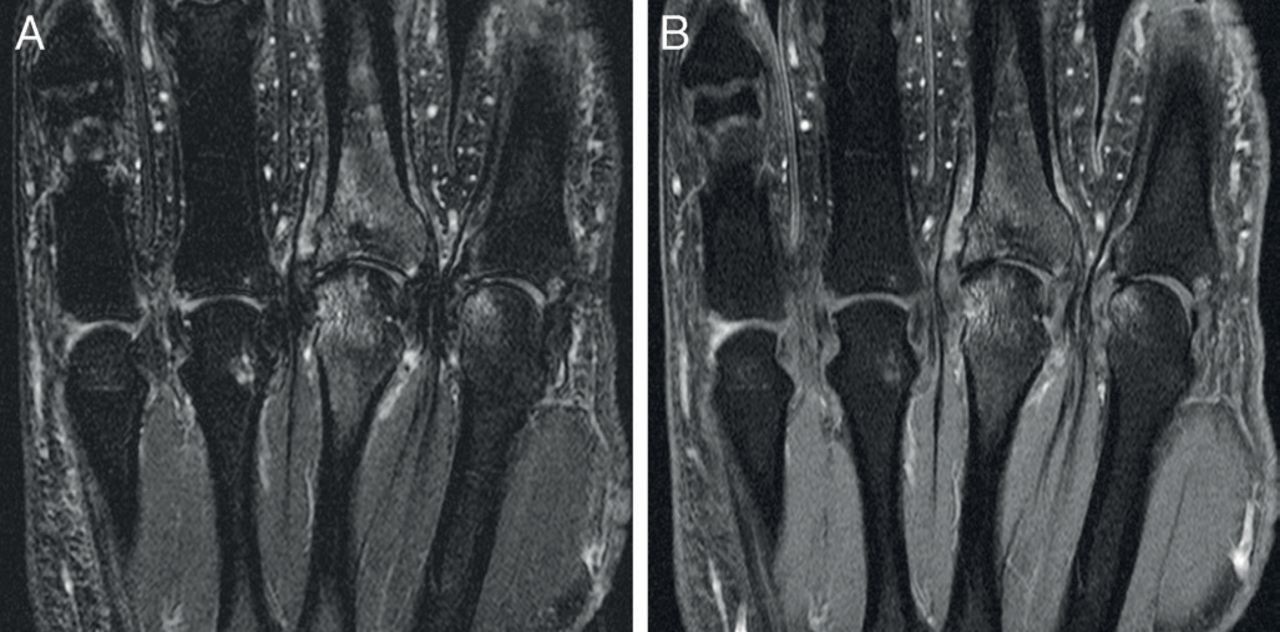
There are several types of contrast agents, of which the extracellular Gd-chelate-based contrast agents (GBCAs) are used in the muskuloskeletal (MSK) system. They shorten T1 and T2 relaxation times, which is dose dependent. They are used in a way that T1 shortening is dominant, which results in an overall increased SNR, but especially in an increase of signal intensity of enhancing tissue such as synovium, BME and inflammatory tissue. Typically T1-weighted pulse sequences with FS (but not in combination with STIR as explained above) are used, producing high-contrast and high SNR images allowing for instance differentiation between synovitis and synovial fluid, a distinction that cannot be made on T2-weighted images. For the detection of BME, studies performed in patients with and without arthritis have shown that STIR (or T2-fatsat) and T1-Gd fatsat perform equally in depicting BME (table 1), as illustrated in figure 3.7–10

Depiction of bone marrow oedema using different techniques. Coronal images of MCP(2-5) joints of a patient with RA imaged both with frequency-selective fat saturation using T2-FSE (A) and T1 –Gd-chelate enhanced FSE sequences (T1 Gd) (B); BME is similarly depicted on both sequences.
Comparison of T2 frequency selective fat saturation (T2 fatsat) or STIR images versus Gd-chelate enhanced T1 fast spin echo sequences with frequency-selective fat saturation (T1 Gd)—although the underlying cause for the signal intensity differs, the sequences perform equally in depicting bone marrow oedema (BME)
Fast dynamic data acquisition during administration of Gd-chelate has been used as a biomarker in oncology, producing functional information on perfusion of tissue, which can be analysed in several qualitative and quantitative ways. These novel techniques have great potential as biomarkers for inflammation and therapy response.14
Influence of FS and scaling on image information
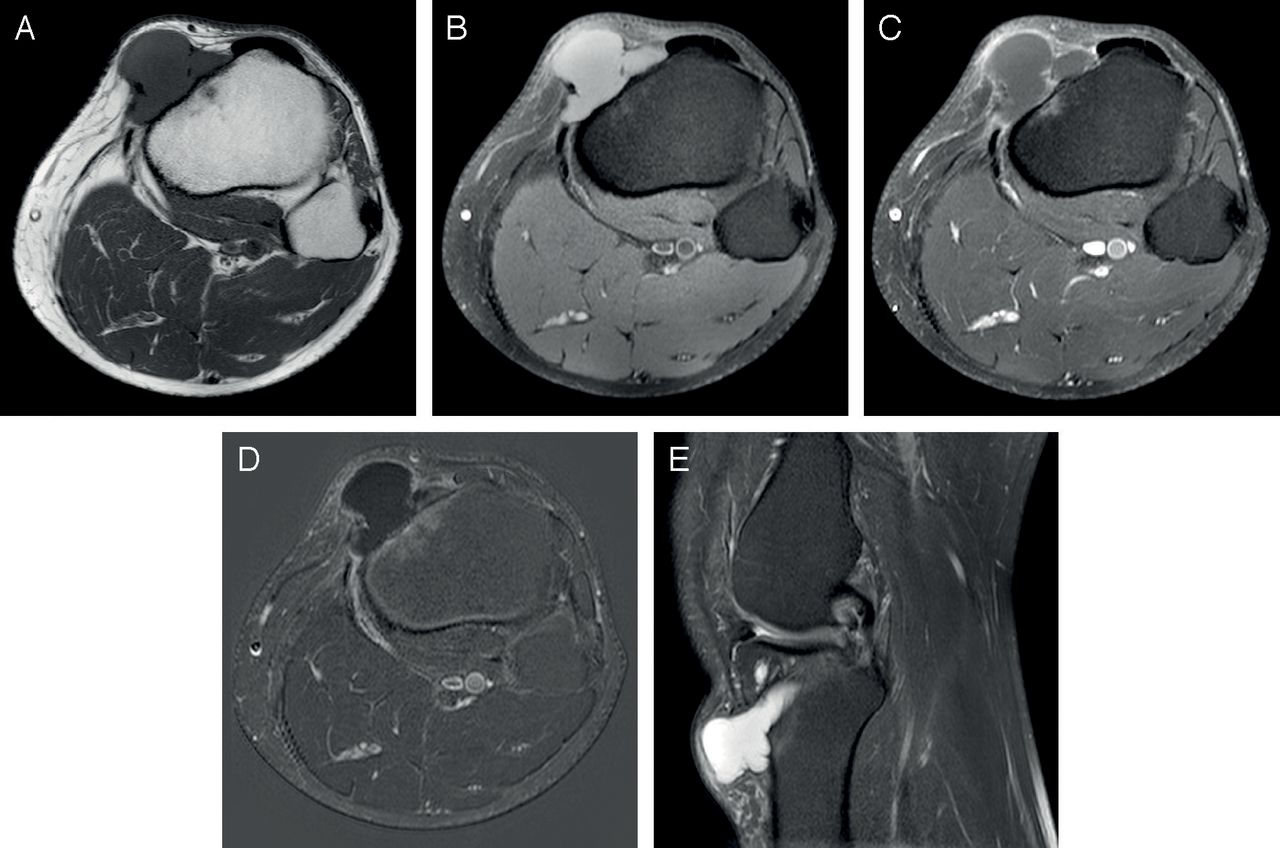
The grey scale also has a paramount impact on signal intensity displayed on the image because the values in the image are relative and not absolute. All values present in a MR image are distributed over the dynamic grey scale. If the image is a T1-weighted image, fat signal will occupy the highest values, and thus will have the highest signal intensity on the image. If fat signal is eliminated, by using FS techniques, the upper values of the dynamic grey scale do not represent fat, but non-fatty tissue that moves up the dynamic scale because of the elimination of fat signal. In other words, the signal intensity of a certain tissue type, including fluid, also depends on other tissue types included (or excluded) in the image that produce signal and thus will be given a place on the grey scale. This may result in higher signal intensity of fluid or fluid-containing structures such as inflammatory tissue or malignancies on non-enhanced fat suppressed T1-weighted images (figure 4). Use of subtraction images is one way to differentiate this pseudo-enhancement from real enhancement.

Signal intensity is dependent on scaling. A patient with a bone cyst following anterior cruciate ligament plasty. The axial images are obtained with T1-weighted (A), T1-frequency selective fat suppression (B), T1 Gd-chelate enhanced frequency selective fat suppression (C), and subtraction techniques (D). Note that the fluid has high signal intensity on the nonenhanced T1-weighted image with frequency selective fat suppression (B); which is in contrast to the ‘rule of thumb’ that fluid is of low intensity on T1. On the contrast enhanced (C) and subtraction images (D) only a small rim enhancement is seen. The explanation is the use of a grey scale on which the signal intensity of fat has been eliminated (see text). The axial T1- (A) and sagittal T2-weighted frequency selective fat suppressed (E) techniques show the well-known signal characteristics of fluid.
Safety issues Gd-based contrast agents
Water-soluble MRGBCAs, introduced in 1984, are rapidly eliminated by the kidneys. Considering the huge amount of GBCAs administered, the paucity of complications is striking. No less than 40% of 36 million MR studies in the USA in 2017 were done after GBCA administration.15 There are two types of gadolinium, linear and macrocyclic, of which macrocyclic GBCA is the more stable and most commonly used. A crisis with nefrogenic systemic fibrosis, in the period 2006–2009, was related to the use of one specific linear GBCA, used in patients with impaired renal function. Since then neither serious side effects (other than extremely rare anaphylactic reactions), nor causal relationship between GBCA administration and clinical symptoms such as transient pain have been identified.15 However, since the paper of Kanda et al in 2014 the safety debate with approximately 80 papers since then focuses on Gd retention in the brain.16 It has been proven that gadolinium retention occurs in various organs including the brain after already four gifts of GBCA. Although originally retention was thought to occur only in linear and not in macrocyclic GBCAs, but extensive research showed that there are also major differences between specific linear agents.17 Interestingly, an autopsy study showed that Gd is retained in vessel walls, correlates with microvessel density and does not show pathological changes with respect to astrocytes, microglia and neuronal loss.18 Based on the knowledge that Gd retains in multiple organs including the brain and insufficient knowledge on various details, the Pharmacovigilance Risk Assessment Committee (PRAC) of the European Medicines Agency (EMA) recommended restrictive guidelines in using two linear GBCAs for the liver, and one for joints. Three linear agents, but none of the macrocyclic were suspended (EMA), while the US Food and Drug Administration (FDA), in their last version (16 May 2018) updated the medication guide for patients containing information on Gd retention, required a new class warning and asked for more research. Both FDA and PRAC conclude that currently no specific conditions have been linked to Gd deposition in organs including the brain.19 20 Although further research is needed and performed, at this moment macrocyclic GBCAs, but not all linear GBCAs are considered safe if used appropriately.19–21
Special MR pulse sequences
There are many special MR pulse sequences, each with its own advantages and disadvantages. Some of these are being introduced in clinical and research practices. Among these are the above-mentioned Dixon techniques. GE sequences with T1 and/or T2* mechanisms can be used in specific situations, for instance, to enhance visibility of erosions. Especially in osteoarthritis (OA) research pulse sequences that can quantify or map cartilaginous abnormalities have been developed. Among these are T2 mapping, delayed GBCA enhanced imaging and the technically very demanding T1rho mapping. T2 mapping and delayed GBCA-enhanced imaging are routinely used in OA research settings, while recently some interest in using these techniques in analysing cartilage damage in patients with RA has surfaced.22 Dynamic GBCA-enhanced imaging has great potential in quantifying inflammatory parameters in RA.14
MR scoring
The technical details and their implication for the evaluation of MR images are important regardless of whether the MRIs are made for diagnostic purposes or for scientific research. Validation scoring methods have been developed for MRIs of hands and feet,6 and also for the spine in SpA,23 24 supporting the use of MRI as outcome measure in clinical trials.
Conclusion
In conclusion, many factors govern the display of data on our black and white MR image and thus have a major impact on image information and thus interpretation. Some basic knowledge on MRI assists us in avoiding the dark side of erroneous interpretation of MRI and opens new chapters of using MRI in clinical and research applications to the benefit of patients in rheumatology. In our view, communication and collaboration between rheumatologists and radiologists is instrumental in developing the bright side of MRI while avoiding the dark side. Furthermore, novel techniques like modified Dixon and functional quantitative Gd-chelate-enhanced dynamic MRI are appetising prospects waiting to be explored in the near future.
Acknowledgments
The authors thank Dr Eva Llopis for providing Figure 4.
References
Footnotes
Contributors All authors contributed to the writing and approved the final manuscript.
Funding The authors have not declared a specific grant for this research from any funding agency in the public, commercial or not-for-profit sectors.
Competing interests None declared.
Patient consent Not required.
Provenance and peer review Commissioned; externally peer reviewed.
Data sharing statement No additional data are available.